A study on Air pollution in Rwanda with reference to Kigali ... - REMA
A study on Air pollution in Rwanda with reference to Kigali ... - REMA
A study on Air pollution in Rwanda with reference to Kigali ... - REMA
- No tags were found...

Create successful ePaper yourself
Turn your PDF publications into a flip-book with our unique Google optimized e-Paper software.
20111A STUDY ON AIR POLLUTION IN RWANDA WITH REFERENCE TOKIGALI CITY AND VEHICULAR EMISSIONSClient: <strong>REMA</strong>THE NATIONAL UNIVERSITY OF RWANDA CONSULTANCYBUREAU (NUR-CB)Po Box 212, Butare, <strong>Rwanda</strong>F<strong>in</strong>al ReportBy Dr Hermogene Nsengimana (PhD)Mr Jean Pierre Bizimana (MSc)Mr Yves Sezirahiga (MSc)Copyright: <strong>Rwanda</strong> Envir<strong>on</strong>ment Management AuthorityMay 2011
35.4. Increase <strong>in</strong> <strong>in</strong>dustrial activities ...........................................................................................385.5. Increase <strong>in</strong> number of vehicles ..........................................................................................395.6. From vehicular growth <strong>to</strong> <strong>in</strong>crease of air polluti<strong>on</strong> ..............................................................445.7. <strong>Air</strong> polluti<strong>on</strong>: a grow<strong>in</strong>g problem <strong>in</strong> <strong>Kigali</strong> ...........................................................................465.7.1. Combusti<strong>on</strong> sources ......................................................................................................475.7.2. Transport and au<strong>to</strong>mobile ..............................................................................................495.7.3. Industrial sources ...........................................................................................................545.7.4. Indoor air polluti<strong>on</strong> .........................................................................................................575.7.5. Progress so far made <strong>in</strong> <strong>Rwanda</strong> ...................................................................................635.7.6. Identified gaps and challenges ......................................................................................636. Propagati<strong>on</strong> fac<strong>to</strong>rs of air polluti<strong>on</strong> <strong>in</strong> <strong>Kigali</strong> City ....................................................................646.1. Influence of <strong>to</strong>pography ......................................................................................................646.2. Influences of meteorology ..................................................................................................666.2.1. Temperature and ra<strong>in</strong>falls ..............................................................................................666.2.2. W<strong>in</strong>d speed and directi<strong>on</strong> ..............................................................................................706.2.3. Effects of air polluti<strong>on</strong> ....................................................................................................756.2.3.1. Health Effects ................................................................................................................756.2.3.2. <strong>Air</strong> polluti<strong>on</strong> and Climate change ...................................................................................807. Model<strong>in</strong>g the <strong>Air</strong> Polluti<strong>on</strong> <strong>in</strong> <strong>Kigali</strong> City ..................................................................................817.1.1. Statistical models ...........................................................................................................827.2. <strong>Air</strong> polluti<strong>on</strong> trends <strong>in</strong> <strong>Kigali</strong> City .........................................................................................847.2.1. Suspended particulate matter ........................................................................................847.2.2. Sulphur dioxide ..............................................................................................................857.2.3. Nitrogen oxides ..............................................................................................................887.2.4. Carb<strong>on</strong> m<strong>on</strong>oxide ..........................................................................................................897.2.5. Oz<strong>on</strong>e (O3).....................................................................................................................917.2.6. Lead (Pb).......................................................................................................................947.3. Strategies for reduc<strong>in</strong>g air polluti<strong>on</strong> ....................................................................................957.3.1. Strategic approaches .....................................................................................................957.3.1.1. Technical strategies .......................................................................................................967.3.1.2. Vehicle technology .........................................................................................................96
47.3.1.3. Fuel technology .............................................................................................................987.3.1.4. Systemic strategies ........................................................................................................987.3.1.5. Role of <strong>in</strong>ternati<strong>on</strong>al community .....................................................................................998. Exist<strong>in</strong>g Policy Framework .....................................................................................................998.1. <strong>Air</strong> polluti<strong>on</strong> policies and regulati<strong>on</strong>s <strong>in</strong> <strong>Rwanda</strong> ................................................................998.2. Multilateral agreements and <strong>in</strong>ternati<strong>on</strong>al c<strong>on</strong>venti<strong>on</strong>s ....................................................1008.3. Local policies, laws, programs and strategies ..................................................................1018.4. Role of public transport plann<strong>in</strong>g ......................................................................................1029. Towards urban air polluti<strong>on</strong> policy <strong>in</strong> <strong>Rwanda</strong> ......................................................................1039.1.1. Visi<strong>on</strong> of air quality m<strong>on</strong>i<strong>to</strong>r<strong>in</strong>g policy ...........................................................................1049.1.2. Policy statement ..........................................................................................................1059.1.3. Policy objectives ..........................................................................................................1069.1.4. Core pr<strong>in</strong>ciples .............................................................................................................1069.1.5. Polluti<strong>on</strong> preventi<strong>on</strong> .....................................................................................................1079.1.5.1. <strong>Air</strong> pollutant m<strong>on</strong>i<strong>to</strong>r<strong>in</strong>g, analysis, model<strong>in</strong>g, and <strong>in</strong>ven<strong>to</strong>ry .........................................1079.1.5.2. Polluti<strong>on</strong> preventi<strong>on</strong> and emissi<strong>on</strong>s c<strong>on</strong>trol ..................................................................1099.1.5.3. Car emissi<strong>on</strong>s <strong>in</strong>specti<strong>on</strong> and c<strong>on</strong>trol program ............................................................1109.1.5.4. Oil quality standards ....................................................................................................1119.1.5.5. Tax <strong>in</strong>centive <strong>to</strong> eco-cars .............................................................................................1119.1.6. Mandate of regula<strong>to</strong>ry authority ...................................................................................1129.1.7. Policy recommendati<strong>on</strong>s ..............................................................................................1139.1.8. S<strong>to</strong>ckholder’s collaborati<strong>on</strong> ..........................................................................................1139.1.8.1. <strong>Rwanda</strong> Revenue Authority (RAA) ..............................................................................1149.1.8.2. <strong>Rwanda</strong> Envir<strong>on</strong>ment Management Authority (<strong>REMA</strong>) ................................................1149.1.8.3. <strong>Rwanda</strong> Bureau of Standards (RBS) ...........................................................................1149.1.8.4. <strong>Rwanda</strong> Nati<strong>on</strong>al Police (RNP)....................................................................................1159.1.8.5. Research <strong>in</strong>stitutes ......................................................................................................11510. C<strong>on</strong>cluded remarks ..........................................................................................................11610.1. C<strong>on</strong>clusi<strong>on</strong>s .....................................................................................................................11610.2. Recommendati<strong>on</strong>s ...........................................................................................................119i. Establishment of c<strong>on</strong>t<strong>in</strong>uous air polluti<strong>on</strong> m<strong>on</strong>i<strong>to</strong>r<strong>in</strong>g system/schemes <strong>in</strong> <strong>Kigali</strong> City ............119
5ii. Improv<strong>in</strong>g the transport system <strong>in</strong> urban areas ....................................................................120iii. Promot<strong>in</strong>g the public awareness and educati<strong>on</strong>. ..................................................................121iv. Promot<strong>in</strong>g the use of renewable energy sources such bio-fuel ............................................121v. C<strong>on</strong>duct an impact assessment <strong>on</strong> health and envir<strong>on</strong>ment ................................................12210.3. Acti<strong>on</strong>s related <strong>to</strong> recommendati<strong>on</strong>s ................................................................................122<strong>Air</strong> polluti<strong>on</strong> m<strong>on</strong>i<strong>to</strong>r<strong>in</strong>g system/schemes <strong>in</strong> <strong>Kigali</strong> City .................................................................12211. References .......................................................................................................................124
6List of figuresFigure 1: Road network and air polluti<strong>on</strong> sources <strong>in</strong> <strong>Kigali</strong> City. ................................................................... 19Figure 2: Evaporative emissi<strong>on</strong>s from vehicles ............................................................................................. 27Figure 3: Cause of <strong>Air</strong> Polluti<strong>on</strong>, Pollutants, Associated Problems and Scale .............................................. 30Figure 4: Urban Ec<strong>on</strong>omic Transiti<strong>on</strong> and Associated Envir<strong>on</strong>mental Agendas for Developed Countries ... 31Figure 5: Evoluti<strong>on</strong> of CO and SO 2 emissi<strong>on</strong> <strong>in</strong> <strong>Kigali</strong> City <strong>in</strong>n 2009 ............................................................. 36Figure 6: Evoluti<strong>on</strong> of populati<strong>on</strong> of <strong>Kigali</strong> City .............................................................................................. 37Figure 7: Vehicles emissi<strong>on</strong> by speed .......................................................................................................... 45Figure 8: Transport <strong>Air</strong> polluti<strong>on</strong> shares <strong>in</strong> 2004 ........................................................................................... 45Figure 9: CO2 from c<strong>on</strong>sumpti<strong>on</strong> petroleum products <strong>in</strong> <strong>Rwanda</strong> (estimate <strong>on</strong>ly) ........................................ 51Figure 10: Evoluti<strong>on</strong> of vehicles imported <strong>in</strong> <strong>Rwanda</strong> between 2001 and 2010 ............................................ 52Figure 11: Fuel use, CO 2 and PM emissi<strong>on</strong> for TCS and ICS ....................................................................... 60Figure 12: Topography, land use and landscape <strong>in</strong> <strong>Kigali</strong> City ..................................................................... 65Figure 13: Variati<strong>on</strong> of annual average temperature and ra<strong>in</strong>fall at <strong>Kigali</strong> .................................................... 67Figure 14: Temperature trend for the measur<strong>in</strong>g period 1971– 2008; city of <strong>Kigali</strong>, <strong>Rwanda</strong>. ...................... 68Figure 15: Results of PM 10 measur<strong>in</strong>g route <strong>in</strong> <strong>Kigali</strong> City <strong>in</strong> February 2008 ................................................ 69Figure 16: Measurements of PM 10 for nighttimes <strong>with</strong> cold-air dynamic from the ridge <strong>to</strong> the “Marais”. ....... 70Figure 17: Impacts of calm and w<strong>in</strong>dy c<strong>on</strong>diti<strong>on</strong>s <strong>on</strong> carb<strong>on</strong> m<strong>on</strong>oxide levels adjacent <strong>to</strong> a major road ..... 72Figure 18: Annual trends of w<strong>in</strong>d directi<strong>on</strong> and speed <strong>in</strong> <strong>Kigali</strong> City between 1974 and 2010 ...................... 73Figure 19: Respira<strong>to</strong>ry Illness <strong>in</strong> Policl<strong>in</strong>ic du Carrefour between 2008 and 2011 ........................................ 78Figure 20: Respira<strong>to</strong>ry Illness <strong>in</strong> Kimir<strong>on</strong>ko Health Centre between 2002 and 2011 .................................... 79Figure 21: Respira<strong>to</strong>ry Illness <strong>in</strong> Kanombe Military Hospital between 2008 and 2011 ................................. 79Figure 22: L<strong>on</strong>g term SO 2 C<strong>on</strong>centrati<strong>on</strong> <strong>with</strong><strong>in</strong> <strong>Kigali</strong> City .......................................................................... 86Figure 23: C<strong>on</strong>centrati<strong>on</strong> of SO2- 4 and SO 2 <strong>in</strong> sample taken <strong>in</strong> <strong>Kigali</strong> City .................................................... 87Figure 24: L<strong>on</strong>g term NO-O 3 C<strong>on</strong>centrati<strong>on</strong> <strong>with</strong><strong>in</strong> <strong>Kigali</strong> City ....................................................................... 88Figure 25: Diagram of l<strong>on</strong>g term NO 2-O 3 C<strong>on</strong>centrati<strong>on</strong> <strong>with</strong><strong>in</strong> <strong>Kigali</strong> City ................................................... 89Figure 26: L<strong>on</strong>g term C0 C<strong>on</strong>centrati<strong>on</strong> <strong>with</strong><strong>in</strong> <strong>Kigali</strong> City ............................................................................. 90Figure 27: L<strong>on</strong>g term CO-O 3 C<strong>on</strong>centrati<strong>on</strong> <strong>with</strong><strong>in</strong> <strong>Kigali</strong> City ....................................................................... 91Figure 28: Diurnal Oz<strong>on</strong>e (O 3) c<strong>on</strong>centrati<strong>on</strong> <strong>in</strong> August 2009 <strong>with</strong><strong>in</strong> <strong>Kigali</strong> City ........................................... 92Figure 29: L<strong>on</strong>g-term Oz<strong>on</strong>e (O 3) c<strong>on</strong>centrati<strong>on</strong> <strong>with</strong><strong>in</strong> <strong>Kigali</strong> City ................................................................ 93Figure 30: Proposed sites for air polluti<strong>on</strong> m<strong>on</strong>i<strong>to</strong>r<strong>in</strong>g stati<strong>on</strong>s ....................................................................119
7List of tablesTable 1: Data type and sources ......................................................................................................21Table 2: Comm<strong>on</strong> pollutants, sources and characteristics ..............................................................26Table 3: Different Gases emissi<strong>on</strong> <strong>in</strong> <strong>Rwanda</strong> <strong>in</strong> 2005 ....................................................................35Table 4: Vehicle Polluti<strong>on</strong> Emissi<strong>on</strong> ................................................................................................40Table 5: Number of registered vehicles by category .......................................................................41Table 6 : <strong>Air</strong> polluti<strong>on</strong> emissi<strong>on</strong> <strong>in</strong> ppm ............................................................................................46Table 7: Greenhouse Gas emissi<strong>on</strong>s <strong>in</strong> <strong>Rwanda</strong> ............................................................................48Table 8: Petroleum product import <strong>in</strong> <strong>Rwanda</strong> between 2004 and 2007 .........................................50Table 9: <strong>Air</strong> pollutant sources <strong>in</strong> cement fac<strong>to</strong>ry ..............................................................................54Table 10: Level of dust emissi<strong>on</strong> .....................................................................................................56Table 11: Summary of the PM2.5 and CO values for TCS and ICS..................................................61Table 12: Ambient <strong>Air</strong> Quality Tolerance Limits <strong>in</strong> East African Community ...................................76Table 13: Human Health Effects of Comm<strong>on</strong> <strong>Air</strong> Pollutants ............................................................77Table 14: <strong>Air</strong> polluti<strong>on</strong> effects <strong>on</strong> envir<strong>on</strong>mental climate change .....................................................81Table 15: Gases emissi<strong>on</strong> <strong>in</strong> <strong>Kigali</strong> City from June <strong>to</strong>-December 2009 ...........................................82Table 16: Gases emissi<strong>on</strong> <strong>in</strong> <strong>Kigali</strong> City <strong>in</strong> 2010 .............................................................................83Table 17: Gases emissi<strong>on</strong> <strong>in</strong> <strong>Kigali</strong> City <strong>in</strong> January 2011 ................................................................84
8AcknowledgmentThis <str<strong>on</strong>g>study</str<strong>on</strong>g> was funded by the <strong>Rwanda</strong> Management Authority (<strong>REMA</strong>) under the M<strong>in</strong>istry ofEnvir<strong>on</strong>ment, Lands and Forest. On the technical side, we s<strong>in</strong>cerely wish <strong>to</strong> thank all <strong>REMA</strong> staff,for the tireless support that has made it possible <strong>to</strong> have reached this stage of the project. At allstages, we received the needed f<strong>in</strong>ancial support <strong>in</strong> due time, the required data and <strong>in</strong>formati<strong>on</strong>;and as well as the professi<strong>on</strong>al guidance <strong>in</strong> sec<strong>on</strong>dary data collecti<strong>on</strong> and survey. The field workwas undertaken <strong>in</strong> different areas of <strong>Rwanda</strong> by a team of field surveyors. We express ourgratitude <strong>to</strong> them for hardly work<strong>in</strong>g <strong>with</strong> us under pressure for a period of more than two weeks.The document has been prepared by the Nati<strong>on</strong>al University of <strong>Rwanda</strong> C<strong>on</strong>sultancy Bureau teamheaded by Dr. Hermogene Nsengimana, Vice Dean of the Faculty of Science <strong>in</strong> collaborati<strong>on</strong> <strong>with</strong>Mr. Jean Pierre Bizimana, Lecturer <strong>in</strong> the Faculty of Science and Mr. Yves Sezirahiga, AssistantLecturer Faculty of Law.
9List of acr<strong>on</strong>ymsBATsCO 2COCOPDCGIS-NURCDMCERsGISGTZHEIGDPGHGIAPIRSTKISTLULUCFMDGsMINECOFINMINICOMMININFRAMININTERMINALOCMINISANTEMICNO XNISRNLCBest Available TechnologiesCarb<strong>on</strong> dioxideCarb<strong>on</strong> m<strong>on</strong>oxideChr<strong>on</strong>ic Obstructive Pulm<strong>on</strong>ary DiseaseGeographic Informati<strong>on</strong> Systems and Remote Sens<strong>in</strong>g Research and Tra<strong>in</strong><strong>in</strong>g ofThe Nati<strong>on</strong>al University of <strong>Rwanda</strong>Clean Development MechanismCertified Emissi<strong>on</strong>s Reducti<strong>on</strong>sGeographic Informati<strong>on</strong> SystemsDeutsche Gesellschaft Für Technische ZusammenarbeitHealth Effects InstituteGlobal Domestic ProductGreen House GasIndoor <strong>Air</strong> Polluti<strong>on</strong><strong>Rwanda</strong> Institute of Scientific and Technological Research<strong>Kigali</strong> Institute of Science and TechnologyLand Use Change and ForestMillennium Development GoalsM<strong>in</strong>istry of Ec<strong>on</strong>omy and F<strong>in</strong>ancial Plann<strong>in</strong>gM<strong>in</strong>istry of Industries , Commerce and TourismM<strong>in</strong>istry of InfrastructureM<strong>in</strong>istry of Internal SecurityM<strong>in</strong>istry of Local GovernmentM<strong>in</strong>istry of HealthMo<strong>to</strong>r Vehicle Inspecti<strong>on</strong> CentreNitrogen OxidesNati<strong>on</strong>al Institute of Statistics <strong>in</strong> <strong>Rwanda</strong>Nati<strong>on</strong>al Land Centre
10NUR-CBOECDO 3PbPAHPM 2.5PM 10PPMRBSRRARADRNP<strong>REMA</strong>RURASPMSNCRSNCSO 2SONATUBETCSTCSUNCHSUNEPUNFCCCUN-HabitatUS-EPAVERsVOCsWHONati<strong>on</strong>al University of <strong>Rwanda</strong> C<strong>on</strong>sultancy BureauOrganisati<strong>on</strong> for Ec<strong>on</strong>omic Co-operati<strong>on</strong> and DevelopmentOz<strong>on</strong>eLeadPolycyclic Aromatic Hydrocarb<strong>on</strong>sParticulate matter <strong>with</strong> aerodiameter less than 2.5 micr<strong>on</strong>Particulate matter <strong>with</strong> aerodiameter less than 10 micr<strong>on</strong>Parts per milli<strong>on</strong><strong>Rwanda</strong> Bureau of Standards<strong>Rwanda</strong> Revenue AuthorityReactive <strong>Air</strong>ways Diseases<strong>Rwanda</strong> Nati<strong>on</strong>al Police<strong>Rwanda</strong> Envir<strong>on</strong>ment Management Authority<strong>Rwanda</strong> Utilities Regula<strong>to</strong>r AgencySpended Particles MatterSelective N<strong>on</strong>-Catalytic Reducti<strong>on</strong>Sec<strong>on</strong>d Nati<strong>on</strong>al Communicati<strong>on</strong>Sulfur dioxideSociété Nati<strong>on</strong>ale des TubesImproved Cook<strong>in</strong>g S<strong>to</strong>veTraditi<strong>on</strong>al Cook<strong>in</strong>g S<strong>to</strong>veUnited Nati<strong>on</strong>s Centre for Human SettlementUnited Nati<strong>on</strong>s Envir<strong>on</strong>ment ProgrammeUnited Nati<strong>on</strong>s Framework C<strong>on</strong>venti<strong>on</strong> <strong>on</strong> Climate ChangeUnited Nati<strong>on</strong>s Human Settlement ProgrammeUnited States Envir<strong>on</strong>mental Protecti<strong>on</strong> AgencyVerified Emissi<strong>on</strong>s Reducti<strong>on</strong>sVolatile Organic CompoundsWorld Health Organisati<strong>on</strong>
11Executive summary<strong>Rwanda</strong>, comm<strong>on</strong>ly referred <strong>to</strong> as a land of thousand hills, is witness<strong>in</strong>g rapid ec<strong>on</strong>omic growthand development, effectuated by its political stability and progressive policies. <strong>Kigali</strong> City, theCapital of <strong>Rwanda</strong> <strong>in</strong>dicates a fast grow<strong>in</strong>g populati<strong>on</strong> of approximately 970,000 <strong>in</strong>habitants. The<strong>in</strong>creas<strong>in</strong>g rate of urbanizati<strong>on</strong> of this city is becom<strong>in</strong>g a matter of great attenti<strong>on</strong>. This ris<strong>in</strong>gpopulati<strong>on</strong> and the coherent ris<strong>in</strong>g rate of mo<strong>to</strong>rizati<strong>on</strong> are <strong>on</strong>e of the reas<strong>on</strong>s for a susta<strong>in</strong>abledegradati<strong>on</strong> of the urban air quality. With this regards, the <strong>Rwanda</strong> Envir<strong>on</strong>ment ManagementAuthority (<strong>REMA</strong>) has agreed <strong>to</strong> commissi<strong>on</strong> a comprehensive <str<strong>on</strong>g>study</str<strong>on</strong>g> that analyses the currentstate of air polluti<strong>on</strong> <strong>in</strong> <strong>Rwanda</strong> <strong>with</strong> emphasis <strong>on</strong> au<strong>to</strong>motive air polluti<strong>on</strong> and <strong>Kigali</strong> City, itscauses and drivers, the future trends of air polluti<strong>on</strong>, the associated health and envir<strong>on</strong>mental risksand the acti<strong>on</strong>s <strong>to</strong> be taken.The overall objective was <strong>to</strong> develop a solid understand<strong>in</strong>g of air quality <strong>in</strong> <strong>Rwanda</strong> <strong>with</strong> focus <strong>on</strong><strong>Kigali</strong> and <strong>to</strong> develop a related strategy and policy recommendati<strong>on</strong>s <strong>to</strong> address the polluti<strong>on</strong>issues. This <str<strong>on</strong>g>study</str<strong>on</strong>g> focused <strong>on</strong> pollutants result<strong>in</strong>g from vehicular emissi<strong>on</strong> and other activities <strong>in</strong>cities accord<strong>in</strong>g <strong>to</strong> the World Health Organisati<strong>on</strong>. To achieve the above def<strong>in</strong>ed objective, bothprimary and sec<strong>on</strong>dary data collecti<strong>on</strong> methods have been used. The review of literature helped <strong>to</strong>identify the exist<strong>in</strong>g standards, regulati<strong>on</strong>s and policy about air quality; the state of air polluti<strong>on</strong> <strong>in</strong><strong>Rwanda</strong> <strong>with</strong> emphasis <strong>on</strong> <strong>Kigali</strong> City and its c<strong>on</strong>sequences <strong>on</strong> human health <strong>with</strong> a focus <strong>on</strong>respira<strong>to</strong>ry illnesses. A desk <str<strong>on</strong>g>study</str<strong>on</strong>g> was carried out <strong>to</strong> acquire and analyse relevant <strong>in</strong>formati<strong>on</strong>perta<strong>in</strong><strong>in</strong>g <strong>to</strong> the air polluti<strong>on</strong>/air quality from the previous studies and from government<strong>in</strong>structi<strong>on</strong>s.As an example, <strong>in</strong>formati<strong>on</strong> related <strong>to</strong> the number of number and type of registered vehicles <strong>in</strong> the<strong>Rwanda</strong> was collected from <strong>Rwanda</strong> Revenue Authority. <strong>Air</strong> polluti<strong>on</strong> c<strong>on</strong>trol policy framework for<strong>Rwanda</strong> was <strong>in</strong>vestigated from Multilateral Agreements and Internati<strong>on</strong>al C<strong>on</strong>venti<strong>on</strong>s <strong>on</strong> airpolluti<strong>on</strong> preventi<strong>on</strong> and climate such that <strong>Rwanda</strong> has signed such Kyo<strong>to</strong> Pro<strong>to</strong>col C<strong>on</strong>venti<strong>on</strong>,United Nati<strong>on</strong>s Framework C<strong>on</strong>venti<strong>on</strong> <strong>on</strong> Climate Change and Vienna C<strong>on</strong>venti<strong>on</strong> <strong>on</strong> theProtecti<strong>on</strong> of the Oz<strong>on</strong>e Layer. The air quality emissi<strong>on</strong>s standards for <strong>Rwanda</strong> and <strong>in</strong> East AfricanCommunity have been documented based <strong>on</strong> <strong>Rwanda</strong> Bureau of Standards publicati<strong>on</strong>.Government publicati<strong>on</strong>s <strong>on</strong> air quality and envir<strong>on</strong>ment policies, laws, programs and strategies
12have also been c<strong>on</strong>sulted <strong>in</strong> this research. These <strong>in</strong>clude for example the, Initial Nati<strong>on</strong>alCommunicati<strong>on</strong> under the United Nati<strong>on</strong>s Framework C<strong>on</strong>venti<strong>on</strong> <strong>on</strong> Climate Change, <strong>Rwanda</strong>Envir<strong>on</strong>ment Organic law, <strong>Kigali</strong> City sub-area and transport plann<strong>in</strong>g document, <strong>Rwanda</strong>Envir<strong>on</strong>mental Health Policy, <strong>Rwanda</strong>’s Energy Policy; Cleaner Producti<strong>on</strong> Programme, Mo<strong>to</strong>rVehicle Inspecti<strong>on</strong> Programme ..Etc. The previous studies and recent publicati<strong>on</strong> <strong>on</strong> air qualityand air polluti<strong>on</strong> <strong>in</strong> <strong>Kigali</strong> City have also been explored for better understand<strong>in</strong>g of the exist<strong>in</strong>gsituati<strong>on</strong> of air quality <strong>in</strong> the <str<strong>on</strong>g>study</str<strong>on</strong>g> area.After literature review and exist<strong>in</strong>g policy documents analysis, other sec<strong>on</strong>dary data have collectedfrom different government <strong>in</strong>stituti<strong>on</strong>s. For <strong>in</strong>stance, data <strong>on</strong> locati<strong>on</strong> of health facilities <strong>in</strong> <strong>Kigali</strong>City; medical records <strong>on</strong> upper respira<strong>to</strong>ry <strong>in</strong>fecti<strong>on</strong>s diseases such as cough, phlegm, <strong>in</strong>fluenza,whistl<strong>in</strong>g/wheez<strong>in</strong>g of the chest, headaches and eye irritati<strong>on</strong> and as well as the chr<strong>on</strong>icrespira<strong>to</strong>ry disease (asthma, pneum<strong>on</strong>ia, br<strong>on</strong>chitis) have acquired from the M<strong>in</strong>istry of Health.The list of <strong>in</strong>dustries <strong>in</strong> <strong>Kigali</strong> City and the annual import/c<strong>on</strong>summati<strong>on</strong> of petroleum products(gasol<strong>in</strong>e, diesel, and kerosene) have been gathered from the MINICOM. As meteorology andclimate are seen as the dispersi<strong>on</strong> fac<strong>to</strong>rs of pollutants and gas emissi<strong>on</strong>s, meteorological recordsand climate data over time <strong>on</strong> <strong>Kigali</strong> City were analysed for the weather stati<strong>on</strong> of KanombeInternati<strong>on</strong>al <strong>Air</strong>port. These <strong>in</strong>cluded w<strong>in</strong>d redirecti<strong>on</strong> and speed; annual average temperature andra<strong>in</strong>falls. All theses climate were available from the “Service Meteo du <strong>Rwanda</strong>” under the M<strong>in</strong>istryof Infrastructure. As the <strong>to</strong>pography also <strong>in</strong>fluence the dispersi<strong>on</strong> of pollutant <strong>in</strong><strong>to</strong> the atmosphere,the <strong>to</strong>pographic <strong>in</strong>formati<strong>on</strong> above <strong>Kigali</strong> City was modelled us<strong>in</strong>g the Digital Elevati<strong>on</strong> Model andthe result was overlaid <strong>to</strong> the exist<strong>in</strong>g road network and land uses <strong>to</strong> show where the ma<strong>in</strong> sourcesof air polluti<strong>on</strong> such <strong>in</strong>dustrial z<strong>on</strong>es, roads traffic lights, roundabouts and car stati<strong>on</strong>s and s<strong>to</strong>psare located <strong>with</strong><strong>in</strong> <strong>Kigali</strong> City. The <strong>in</strong>formati<strong>on</strong> <strong>on</strong> <strong>in</strong>door air polluti<strong>on</strong> was gathered from otherstudies which tried <strong>to</strong> measure the PM2.5 and CO us<strong>in</strong>g the Traditi<strong>on</strong>al Cook<strong>in</strong>g S<strong>to</strong>ves and theImproved Cook<strong>in</strong>g S<strong>to</strong>ves <strong>in</strong> rural areas.The prelim<strong>in</strong>ary research f<strong>in</strong>d<strong>in</strong>gs revealed that the rapid <strong>in</strong>crease <strong>in</strong> urban populati<strong>on</strong> of <strong>Kigali</strong> hasresulted <strong>in</strong> unplanned urban development, <strong>in</strong>crease <strong>in</strong> c<strong>on</strong>sumpti<strong>on</strong> patterns and higher structure,thereby lead<strong>in</strong>g <strong>to</strong> the air polluti<strong>on</strong> problems. This situati<strong>on</strong> is exacerbated by the follow<strong>in</strong>g: the<strong>in</strong>creas<strong>in</strong>g and high vehicle density <strong>in</strong> urban centers, older vehicles predom<strong>in</strong>ant <strong>in</strong> vehicle time;
13<strong>in</strong>adequate <strong>in</strong>specti<strong>on</strong> and ma<strong>in</strong>tenance of facilities; adulterati<strong>on</strong> of fuel and fuel products; impropertraffic management system and road c<strong>on</strong>diti<strong>on</strong>s, high levels of polluti<strong>on</strong> at traffic <strong>in</strong>tersecti<strong>on</strong>s;absence of effective mass rapid transport system and <strong>in</strong>tra-city railway networks and the highpopulati<strong>on</strong> exodus <strong>to</strong> <strong>Kigali</strong> City.C<strong>on</strong>cern<strong>in</strong>g the current state of air polluti<strong>on</strong> <strong>in</strong> <strong>Kigali</strong> City, the measurement results <strong>on</strong> suspendedparticulate matter showed that <strong>Kigali</strong> City exceeded already the recommendati<strong>on</strong>s of the WHO (50μg m-3). This suggests that the <strong>in</strong>habitants of <strong>Kigali</strong> are exposed <strong>to</strong> enormous levels of PM10 dur<strong>in</strong>gmost of their time outdoors especial <strong>in</strong> the even<strong>in</strong>g hours. A seas<strong>on</strong>al variati<strong>on</strong> was found asc<strong>on</strong>sistently higher dust load was found <strong>in</strong> the dry seas<strong>on</strong>s which might possibly be attributed <strong>to</strong>the prevailed meteorological c<strong>on</strong>diti<strong>on</strong>s such as low precipitati<strong>on</strong> and w<strong>in</strong>d speed. Compar<strong>in</strong>g theaerosol particles c<strong>on</strong>centrati<strong>on</strong> sampled dur<strong>in</strong>g weekend-days <strong>in</strong> <strong>Kigali</strong> City, the results showedthat the c<strong>on</strong>centrati<strong>on</strong> of particle matter was higher <strong>in</strong> dry seas<strong>on</strong> than <strong>in</strong> the ra<strong>in</strong>y seas<strong>on</strong>. In thesame l<strong>in</strong>e, the Diurnal Oz<strong>on</strong>e (O3) c<strong>on</strong>centrati<strong>on</strong> <strong>in</strong> August 2009 us<strong>in</strong>g the s<strong>in</strong>gle m<strong>on</strong>i<strong>to</strong>r<strong>in</strong>g systemlocated at <strong>Kigali</strong> Institute of Science and Technology revealed a higher c<strong>on</strong>centrati<strong>on</strong> of Oz<strong>on</strong>e(O3) <strong>in</strong> atmosphere <strong>in</strong> the morn<strong>in</strong>g between 6:00-12:00 AM. This c<strong>on</strong>centrati<strong>on</strong> of ground-leveloz<strong>on</strong>e is already bey<strong>on</strong>d the major envir<strong>on</strong>mental standards, and the problem of air polluti<strong>on</strong> isalready at present. When c<strong>on</strong>sider<strong>in</strong>g the scale of <strong>in</strong>dustrial activities <strong>in</strong> <strong>Kigali</strong>, we can assume thatthe primary source of this polluti<strong>on</strong> is mo<strong>to</strong>r vehicle exhaust especially caused by bad ma<strong>in</strong>tenanceof its emissi<strong>on</strong> c<strong>on</strong>trol.Even if the sulphur dioxide released <strong>in</strong> the atmosphere of <strong>Kigali</strong> City is low when compared <strong>to</strong> theaccepted annually average recommended by East African Standard for some comm<strong>on</strong> substancesfound <strong>in</strong> polluted air (80 g/m 3 for <strong>in</strong>dustrial areas, 60 g/m 3 for residential areas; a 15 g/m 3c<strong>on</strong>trolled areas), the sulphur dioxide is already a c<strong>on</strong>cern for <strong>in</strong>habitants. But dur<strong>in</strong>g the dryseas<strong>on</strong>s, the measures taken at KIST air quality m<strong>on</strong>i<strong>to</strong>r<strong>in</strong>g are bey<strong>on</strong>d the permissible limits. Theaverage c<strong>on</strong>centrati<strong>on</strong> of nitrogen oxide <strong>in</strong> <strong>Kigali</strong> City was estimated between 15 and 20 g/m 3while the permissible limit value of proposed by the East African Standard for some comm<strong>on</strong>substances found <strong>in</strong> polluted air is 150 g/m 3. This c<strong>on</strong>centrati<strong>on</strong> level is also <strong>in</strong> the range ofaccepted limit for air quality c<strong>on</strong>trol and m<strong>on</strong>i<strong>to</strong>r<strong>in</strong>g guidel<strong>in</strong>es for East African Community. Thec<strong>on</strong>centrati<strong>on</strong> of Pb level <strong>in</strong> the aerosols <strong>in</strong> <strong>Kigali</strong> City was found below the World Health
14Organizati<strong>on</strong> (WHO, 0.5-1.5µg/m 3 ) and East African Community recommended levels (0.5-1.0µg/m 3 ).Therefore, based <strong>on</strong> the above results, the air quality <strong>in</strong> <strong>Kigali</strong> City is still at a favourable level ascompared <strong>to</strong> most countries <strong>in</strong> the world, but the <strong>in</strong>dustrial activities and traffic density c<strong>on</strong>t<strong>in</strong>ue <strong>to</strong>grow. The result<strong>in</strong>g <strong>in</strong>crease <strong>in</strong> air polluti<strong>on</strong> is already a c<strong>on</strong>cern for its <strong>in</strong>habitants. The susta<strong>in</strong>ableurban management of <strong>Kigali</strong> City calls therefore <strong>to</strong> take the comprehensive measures <strong>to</strong> tackle <strong>with</strong>this issue <strong>in</strong> order <strong>to</strong> reduce the <strong>in</strong>creas<strong>in</strong>g air polluti<strong>on</strong> and its human health effects. Some of theelements <strong>to</strong> take <strong>in</strong><strong>to</strong> c<strong>on</strong>siderati<strong>on</strong> <strong>to</strong> prevent or reduce harmful effects <strong>on</strong> human health and theenvir<strong>on</strong>ment as a whole <strong>in</strong> <strong>Rwanda</strong> are proposed by this <str<strong>on</strong>g>study</str<strong>on</strong>g>.
151. General Introducti<strong>on</strong>1.1. Background<strong>Rwanda</strong>, comm<strong>on</strong>ly referred <strong>to</strong> as a land of thousand hills, is witness<strong>in</strong>g rapid ec<strong>on</strong>omic growthand development, effectuated by its political stability and progressive policies. “Visi<strong>on</strong> 2020”envisages <strong>Rwanda</strong> as a modern and ec<strong>on</strong>omically str<strong>on</strong>g nati<strong>on</strong> and a regi<strong>on</strong>al leader ofdevelopment <strong>in</strong> Africa. <strong>Kigali</strong> City, the nati<strong>on</strong>al capital, which celebrated the 100 th year of itsfound<strong>in</strong>g <strong>in</strong> 2007, is <strong>on</strong>e of the fastest grow<strong>in</strong>g cities <strong>in</strong> Africa and has the highest rate ofurbanizati<strong>on</strong> (MININFRA, 2009a). <strong>Kigali</strong> <strong>in</strong>dicates a fast grow<strong>in</strong>g populati<strong>on</strong> of approximately970,000 <strong>in</strong>habitants. The <strong>in</strong>creas<strong>in</strong>g rate of urbanizati<strong>on</strong> of this city is becom<strong>in</strong>g a matter of greatattenti<strong>on</strong>. This ris<strong>in</strong>g populati<strong>on</strong> and the coherent ris<strong>in</strong>g rate of mo<strong>to</strong>rizati<strong>on</strong> are <strong>on</strong>e of the reas<strong>on</strong>sfor a susta<strong>in</strong>able degradati<strong>on</strong> of the urban air quality. Poorly ma<strong>in</strong>ta<strong>in</strong>ed, old mopeds, mo<strong>to</strong>rcycles,heavy mach<strong>in</strong>es and vehicles cause an <strong>in</strong>creas<strong>in</strong>g c<strong>on</strong>centrati<strong>on</strong> of different air pollutants.Clima<strong>to</strong>logical parameters as well as air pollutants measured <strong>in</strong>dicate a rise from 1971 <strong>to</strong> 2008(Henn<strong>in</strong>ger, 2009). These have been observed globally but the characteristics and scale of the airpolluti<strong>on</strong> problem <strong>in</strong> <strong>Rwanda</strong> <strong>in</strong> general are not known; nor has the problem been researched andevaluated <strong>to</strong> the same extent as <strong>in</strong> <strong>in</strong>dustrialized countries.It is <strong>in</strong> this c<strong>on</strong>text that the <strong>Rwanda</strong> Envir<strong>on</strong>ment Management Authority (<strong>REMA</strong>) has agreed <strong>to</strong>commissi<strong>on</strong> a comprehensive <str<strong>on</strong>g>study</str<strong>on</strong>g> that analyses the current state of air polluti<strong>on</strong> <strong>in</strong> <strong>Rwanda</strong> <strong>with</strong>emphasis <strong>on</strong> au<strong>to</strong>motive air polluti<strong>on</strong> and <strong>Kigali</strong> City, its causes and drivers, the future trends of airpolluti<strong>on</strong>, the associated health and envir<strong>on</strong>mental risks and the acti<strong>on</strong>s <strong>to</strong> be taken.1.2. Rati<strong>on</strong>ale<strong>Air</strong> polluti<strong>on</strong> <strong>in</strong> <strong>Kigali</strong> may be aggravated as development occurs, and as the country becomes<strong>in</strong>dustrialized <strong>with</strong> the grow<strong>in</strong>g of the cities, <strong>in</strong>creas<strong>in</strong>g traffic, rapid ec<strong>on</strong>omic development and<strong>in</strong>dustrializati<strong>on</strong>, as well as higher levels of energy c<strong>on</strong>sumpti<strong>on</strong>. The high <strong>in</strong>flux of populati<strong>on</strong> <strong>to</strong>urban areas, <strong>in</strong>crease <strong>in</strong> c<strong>on</strong>sumpti<strong>on</strong> patterns and unplanned urban and <strong>in</strong>dustrial developmentwill lead <strong>to</strong> the problem of air polluti<strong>on</strong>. Today, air polluti<strong>on</strong> is widespread <strong>in</strong> <strong>Kigali</strong> where vehiclesare the major c<strong>on</strong>tribu<strong>to</strong>rs and <strong>in</strong> a few other areas <strong>with</strong> unknown c<strong>on</strong>centrati<strong>on</strong> of <strong>in</strong>dustries andthermal power plants. Vehicular emissi<strong>on</strong>s are of particular c<strong>on</strong>cern s<strong>in</strong>ce these are ground level
17vehicular emissi<strong>on</strong> and other activities <strong>in</strong> cities accord<strong>in</strong>g <strong>to</strong> the World Health Organisati<strong>on</strong>. Thissubmissi<strong>on</strong> provides the executi<strong>on</strong> modalities of the c<strong>on</strong>sultancy by researchers from the NURC<strong>on</strong>sultancy bureau1.4. Objectives and scope of workMore specifically the scop<strong>in</strong>g of the <str<strong>on</strong>g>study</str<strong>on</strong>g> is as follow:• To present the case of <strong>Rwanda</strong> <strong>with</strong> emphasis <strong>on</strong> <strong>Kigali</strong> regard<strong>in</strong>g air polluti<strong>on</strong> and itsc<strong>on</strong>sequences <strong>on</strong> human health <strong>with</strong> a focus <strong>on</strong> respira<strong>to</strong>ry illnesses; this will be d<strong>on</strong>ethrough a literature review. There are some studies available from the M<strong>in</strong>istry of Healthand other <strong>in</strong>stituti<strong>on</strong>s;• To c<strong>on</strong>duct an assessment of the human health risk for people liv<strong>in</strong>g <strong>in</strong> <strong>Kigali</strong>; this can betackled through literature review and statistical analysis of available data <strong>on</strong> health risk <strong>in</strong><strong>Kigali</strong>;• To undertake the identificati<strong>on</strong> of the ma<strong>in</strong> sources of air polluti<strong>on</strong>, their volume andanalyze the trend <strong>in</strong> the future <strong>with</strong> regard <strong>to</strong> the <strong>in</strong>crease of sources of polluti<strong>on</strong>;• To gather all data <strong>on</strong> measurements so far taken <strong>on</strong> air polluti<strong>on</strong> <strong>in</strong> the country and wherethere are gaps <strong>in</strong> data the c<strong>on</strong>sultant will c<strong>on</strong>duct measurements of polluti<strong>on</strong> <strong>to</strong> fillthe gaps;• To c<strong>on</strong>duct an assessment of the knowledge/<strong>in</strong>formati<strong>on</strong>/data gaps and proposeappropriate soluti<strong>on</strong>s;• To assess the exist<strong>in</strong>g standards/regulati<strong>on</strong>s and policy resp<strong>on</strong>se then proposeappropriate soluti<strong>on</strong>s;• To report <strong>on</strong> the forecast of air polluti<strong>on</strong> <strong>in</strong>dica<strong>to</strong>rs and its risk <strong>in</strong> the com<strong>in</strong>g decade; thiswill be ma<strong>in</strong>ly based <strong>on</strong> various studies so far undertaken;• To review the measures <strong>in</strong> place and those <strong>to</strong> be taken by local and central government ofthe city of <strong>Kigali</strong> <strong>to</strong> reverse the trends; this will be based <strong>on</strong> literature review and <strong>in</strong>terviews<strong>with</strong> all stakeholders.• To formulate recommendati<strong>on</strong>s and suggesti<strong>on</strong>s <strong>to</strong> help solve the problem; this will bed<strong>on</strong>e through literature review and from the own experience of the c<strong>on</strong>sultant about localplann<strong>in</strong>g and susta<strong>in</strong>able development. This will <strong>in</strong>clude a susta<strong>in</strong>able cooperati<strong>on</strong> or<strong>in</strong>stituti<strong>on</strong>al framework between the c<strong>on</strong>cerned programmes and <strong>in</strong>stituti<strong>on</strong>s.
18• To assess and br<strong>in</strong>g recommendati<strong>on</strong>s <strong>on</strong> standards/policy and regulati<strong>on</strong>s regard<strong>in</strong>g carsmoke as well.2. MethodologyTo achieve the above def<strong>in</strong>ed objectives, the follow<strong>in</strong>g activities have been undertaken <strong>in</strong> differentphases and the follow<strong>in</strong>g have been used: literature review, data collecti<strong>on</strong>, data process<strong>in</strong>g andanalysis and f<strong>in</strong>al report.2.1. Literature reviewThe review of literature helped <strong>to</strong> identify the exist<strong>in</strong>g standards, regulati<strong>on</strong>s and policy about airquality; understand the case of <strong>Rwanda</strong> <strong>with</strong> emphasis <strong>on</strong> <strong>Kigali</strong> regard<strong>in</strong>g air polluti<strong>on</strong> and itsc<strong>on</strong>sequences <strong>on</strong> human health <strong>with</strong> a focus <strong>on</strong> respira<strong>to</strong>ry illnesses. This activity also allowedbetter understand<strong>in</strong>g and assess<strong>in</strong>g the human health risk for people liv<strong>in</strong>g <strong>in</strong> <strong>Kigali</strong>.Various studies available from the M<strong>in</strong>istry of Health and other <strong>in</strong>stituti<strong>on</strong>s have been c<strong>on</strong>sulted <strong>in</strong>order <strong>to</strong> know the c<strong>on</strong>sequences of air polluti<strong>on</strong> <strong>on</strong> human health <strong>in</strong> <strong>Kigali</strong> City <strong>with</strong> a focus <strong>on</strong>respira<strong>to</strong>ry illnesses. We will review the exist<strong>in</strong>g reports and database available <strong>in</strong> the fieldprovided by different <strong>in</strong>stituti<strong>on</strong>s deal<strong>in</strong>g <strong>with</strong> air quality issues, as well as sources of air polluti<strong>on</strong><strong>with</strong> the ma<strong>in</strong> focus <strong>on</strong> vehicular emissi<strong>on</strong>. These <strong>in</strong>stituti<strong>on</strong>s <strong>in</strong>clude <strong>REMA</strong>, The M<strong>in</strong>istry ofEnvir<strong>on</strong>ment and Natural resources, the m<strong>in</strong>istry of <strong>in</strong>frastructure, the M<strong>in</strong>istry of Industry andCommerce, <strong>Rwanda</strong> Revenue Authority, etc.2.2. Data collecti<strong>on</strong>The data collecti<strong>on</strong> purpose was <strong>to</strong> identify the ma<strong>in</strong> sources of air polluti<strong>on</strong>, their volume; and <strong>to</strong>gather all data <strong>on</strong> measurements so far taken <strong>on</strong> air polluti<strong>on</strong> <strong>in</strong> <strong>Rwanda</strong>. Where there were gaps<strong>in</strong> data, this <str<strong>on</strong>g>study</str<strong>on</strong>g> also was supposed <strong>to</strong> c<strong>on</strong>duct measurements of polluti<strong>on</strong> <strong>to</strong> fill the gaps. Bothprimary and sec<strong>on</strong>dary data methods were used.2.2.1. Primary data collecti<strong>on</strong>Field work was carried out <strong>in</strong> selected sites <strong>in</strong> the <strong>Kigali</strong> city, <strong>to</strong> fill <strong>in</strong> the gaps <strong>in</strong> exist<strong>in</strong>gmeasurements. The sites have selected accord<strong>in</strong>g <strong>to</strong> identified site dur<strong>in</strong>g literature review andfield visit that represent a potential risk. This selecti<strong>on</strong> was guided by the geography of the <strong>Kigali</strong>City (altitude, <strong>to</strong>pography and transport activities), The exist<strong>in</strong>g gaps some sample sites have
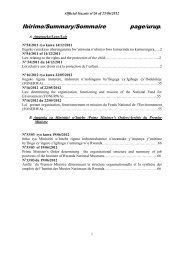
19completed, tak<strong>in</strong>g <strong>in</strong><strong>to</strong> account major pollutants such as CO2, CO, SO2, NOx, hydrocarb<strong>on</strong>s.Sample sites <strong>in</strong> <strong>Kigali</strong> city were supposed <strong>to</strong> be selected and air pollutant such as CO2, SO2, NOx,Hydrocarb<strong>on</strong>s, Particulate matter analyzed. These sites were identified accord<strong>in</strong>g the volume ofvehicular traffic, the proximity <strong>to</strong> the airport, <strong>in</strong>dustrial activities and other ma<strong>in</strong> sources of airpollutants such as landfill sites. The same sites were located us<strong>in</strong>g the Global Positi<strong>on</strong><strong>in</strong>g system.The ma<strong>in</strong> streets and road network <strong>in</strong> <strong>Kigali</strong> have digitized and displayed us<strong>in</strong>g ArcGIS9.3 softwareand al<strong>on</strong>g which the vehicular emissi<strong>on</strong>s c<strong>on</strong>centrati<strong>on</strong> were supposed <strong>to</strong> be measured andanalysed. Sampl<strong>in</strong>g sites will be located at the heavy traffic roadsides, bus s<strong>to</strong>ps (Nyabugogo,Remera, SONATUBE, City Centre, etc), car stati<strong>on</strong>s, <strong>in</strong>dustries, garages, and <strong>on</strong> the major trafficlight po<strong>in</strong>ts. All the <strong>in</strong>struments will be <strong>in</strong>stalled about 1 m above ground level. The follow<strong>in</strong>g map ofthe road network <strong>in</strong> <strong>Kigali</strong> City will be used for sampl<strong>in</strong>g.Figure 1: Road network and air polluti<strong>on</strong> sources <strong>in</strong> <strong>Kigali</strong> City.
20The sampl<strong>in</strong>g was c<strong>on</strong>ducted dur<strong>in</strong>g heavy traffic rush hours <strong>on</strong> sunny days (Between 8:00-9:00AM and 03:00-04:00 PM). The geographic coord<strong>in</strong>ates of these po<strong>in</strong>ts have been taken us<strong>in</strong>g theGlobal positi<strong>on</strong><strong>in</strong>g System 1 . As the sample sources of the air polluti<strong>on</strong> measurements do notcapture the full spatial variati<strong>on</strong> of air polluti<strong>on</strong> from traffic road the Geographical Informati<strong>on</strong>sSystems (GIS) 2 was used as ma<strong>in</strong> <strong>to</strong>ol <strong>to</strong> assess <strong>with</strong><strong>in</strong> the city the variati<strong>on</strong>s of exposure <strong>to</strong> trafficpolluti<strong>on</strong> sources. This was assessed by measur<strong>in</strong>g distance from residences <strong>to</strong> roads, or bymodell<strong>in</strong>g air polluti<strong>on</strong> c<strong>on</strong>centrati<strong>on</strong>s from nearby emissi<strong>on</strong> sources. This possibility of higherspatial resoluti<strong>on</strong> of exposure assessment was necessary for the ability <strong>to</strong> detect l<strong>on</strong>g-term effectsof traffic <strong>on</strong> chr<strong>on</strong>ic respira<strong>to</strong>ry disease us<strong>in</strong>g the residence/locati<strong>on</strong> <strong>in</strong>formati<strong>on</strong> from cl<strong>in</strong>icalrecords reported by health centres and hospitals <strong>with</strong><strong>in</strong> <strong>Kigali</strong> City. These medical records may<strong>in</strong>clude for example demographic characteristics, medical his<strong>to</strong>ry, and the results labora<strong>to</strong>ry testsperformed dur<strong>in</strong>g hospitalizati<strong>on</strong>. The medical records of previous hospitalizati<strong>on</strong>s or outpatientvisits have been also reviewed <strong>to</strong> ascerta<strong>in</strong> a prior his<strong>to</strong>ry of respira<strong>to</strong>ry diseases <strong>in</strong> the <str<strong>on</strong>g>study</str<strong>on</strong>g> area.To analyse the exposure of people <strong>to</strong> the vehicle air polluti<strong>on</strong> <strong>in</strong> <strong>Kigali</strong> City, ArcGIS9.3 softwarewas used <strong>to</strong> assign exposure <strong>to</strong> traffic-related air polluti<strong>on</strong> <strong>to</strong> each patient based <strong>on</strong> their geocodedresidence at the time of hospitalizati<strong>on</strong>. A precisi<strong>on</strong> at Umudugudu level was required for the <str<strong>on</strong>g>study</str<strong>on</strong>g>.We used three different measures as surrogates for exposure <strong>to</strong> traffic-related air polluti<strong>on</strong>: dailytraffic near the patient’s residence, distance <strong>to</strong> major roadways, and distance <strong>to</strong> a bus route. Wewill calculate the daily traffic <strong>with</strong><strong>in</strong> 100 m and 300 m of the patient’s residence. For each road, wecalculated its traffic c<strong>on</strong>tributi<strong>on</strong> as the product of the length of the road segment fall<strong>in</strong>g <strong>with</strong><strong>in</strong> thecircle and its annual average daily traffic (i.e., the average number of vehicles circulat<strong>in</strong>g <strong>on</strong> theroad each day). The traffic c<strong>on</strong>tributi<strong>on</strong>s from each road were added <strong>to</strong> the overall daily traffic<strong>with</strong><strong>in</strong> the circle area. We also calculated the distance from the patient’s residence or residentialsettlements <strong>to</strong> the nearest primary highway. The surveys <strong>in</strong>struments have been used <strong>to</strong> collect theprimary data are shown <strong>in</strong> the annexes.1 Global Positi<strong>on</strong><strong>in</strong>g System (GPS) is a satellite based navigati<strong>on</strong> system made up of the network of 24satellites placed <strong>in</strong><strong>to</strong> the orbit by the U.S. Department of Defense. It was orig<strong>in</strong>ally <strong>in</strong>tended for militaryapplicati<strong>on</strong>s, but <strong>in</strong> the 1980s, the U.S. government made this system available for civilian use.2 Geographic Informati<strong>on</strong> Systems (GIS) is computerized systems, hardware, software and proceduresdesigned <strong>to</strong> support the capture, management, manipulati<strong>on</strong>, analysis, model<strong>in</strong>g, and display the<strong>reference</strong>d data for solv<strong>in</strong>g complex plann<strong>in</strong>g and management problems.
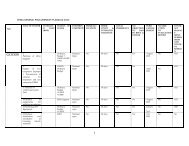
212.2.2. Sec<strong>on</strong>dary data collecti<strong>on</strong>Although this <str<strong>on</strong>g>study</str<strong>on</strong>g> <strong>in</strong>cluded field activities for cover<strong>in</strong>g the exist<strong>in</strong>g gaps <strong>in</strong> data, the f<strong>in</strong>d<strong>in</strong>gs andanalyses were build <strong>on</strong> previous reports <strong>on</strong> the prospects and challenges related <strong>to</strong> the air polluti<strong>on</strong><strong>in</strong> <strong>Rwanda</strong> <strong>with</strong> <strong>reference</strong> <strong>to</strong> <strong>Kigali</strong> city and vehicular emissi<strong>on</strong>s. The latter comprises deskreviews dat<strong>in</strong>g back <strong>to</strong> early date when the c<strong>on</strong>cept of air polluti<strong>on</strong> was <strong>in</strong>cepted <strong>in</strong> <strong>Rwanda</strong>. For<strong>in</strong>door air polluti<strong>on</strong>, the studies related <strong>to</strong> combusti<strong>on</strong> methods used at household level weredocumented.The assessment of effects of air polluti<strong>on</strong> of the human health risk for people liv<strong>in</strong>g <strong>in</strong> <strong>Kigali</strong>, thedata and <strong>in</strong>formati<strong>on</strong> <strong>on</strong> chr<strong>on</strong>ic respira<strong>to</strong>ry diseases were collected from epidemiological recordedby health centres and hospitals <strong>with</strong><strong>in</strong> <strong>Kigali</strong> City. The follow<strong>in</strong>g are the health facilities that havebeen visited <strong>to</strong> collect the required medical records for this <str<strong>on</strong>g>study</str<strong>on</strong>g>. Kabuye Health Center, KicukiroHealth Centre, Kibagabaga District Hospital, Muhima District Hospital, Kimir<strong>on</strong>ko Pris<strong>on</strong> Hospital,Kanombe Military Hospital, CHUK Reference Hospital, K<strong>in</strong>g Faysal Reference Hospital andPoliclic du Carrefour Health Centre.Informati<strong>on</strong> <strong>on</strong> registered vehicles fleet from 2007 <strong>to</strong> 2011 was acquired from other previousstudies like the <strong>on</strong>e <strong>on</strong> potential of susta<strong>in</strong>able liquid biofuel producti<strong>on</strong> <strong>in</strong> <strong>Rwanda</strong>, carried out byGTZ (2011). This helped <strong>to</strong> know the <strong>in</strong>crease number of vehicle per category <strong>in</strong> last five year suchas buses, cars, semi-trailer, jeeps, micro-bus, m<strong>in</strong>ibus, mo<strong>to</strong>rcycles, pick-up, special eng<strong>in</strong>e andtrailers. This type <strong>in</strong>formati<strong>on</strong> was collected from <strong>Rwanda</strong> Revenue Authority.The follow<strong>in</strong>g table summarizes the <strong>in</strong>stituti<strong>on</strong>s that have been visited and the type of data/<strong>in</strong>formati<strong>on</strong> collected from each <strong>in</strong>stituti<strong>on</strong>.Table 1: Data type and sourcesInstituti<strong>on</strong>sRequested DataMo<strong>to</strong>r Vehicle Inspecti<strong>on</strong> Centre • Eng<strong>in</strong>e gas emissi<strong>on</strong> <strong>in</strong>specti<strong>on</strong> and cars ma<strong>in</strong>tenance<strong>Rwanda</strong> Bureau of standards • <strong>Air</strong> quality emissi<strong>on</strong>s standards<strong>Rwanda</strong> Revenue Authority • Number and type of registered vehicles <strong>in</strong> the countryas of May 2011.
22<strong>Rwanda</strong> Envir<strong>on</strong>mentManagement Authority• <strong>Air</strong> polluti<strong>on</strong> c<strong>on</strong>trol policy framework<strong>Kigali</strong> City • Informati<strong>on</strong> related for example <strong>to</strong> public transportplann<strong>in</strong>g, highway road plann<strong>in</strong>g, road upgrad<strong>in</strong>g andma<strong>in</strong>tenance, traffic management, separati<strong>on</strong> of heavyduty cars.• Shapefile of road network (category of roads) <strong>in</strong> <strong>Kigali</strong>City from <strong>Kigali</strong> C<strong>on</strong>ceptual Master plan project• List of garages, number of roundabouts, locati<strong>on</strong> ofma<strong>in</strong> dump<strong>in</strong>g sites and waste disposals, Seweragesystems; list of Biogas projects and their locati<strong>on</strong>;locati<strong>on</strong> of quarry<strong>in</strong>g activities…etcMINICOM • List of <strong>in</strong>dustries, Gasol<strong>in</strong>e, diesel, and keroseneimports and c<strong>on</strong>sumpti<strong>on</strong>.MINISANTE • Locati<strong>on</strong> of health facilities <strong>in</strong> <strong>Kigali</strong> City; medicalrecords <strong>on</strong> respira<strong>to</strong>ry chr<strong>on</strong>ic diseases such asMININFRA • Meteorological and climate data <strong>on</strong> <strong>Kigali</strong> City<strong>in</strong>clud<strong>in</strong>g the nearest weather stati<strong>on</strong>s, the recordedmeteorological data over time <strong>in</strong>clud<strong>in</strong>g W<strong>in</strong>d directi<strong>on</strong>and speed; annual average temperature, dairytemperature, ra<strong>in</strong>fallCGIS-NUR • Digital Elevati<strong>on</strong> Model above <strong>Kigali</strong> CityNati<strong>on</strong>al Land Centre • Ma<strong>in</strong> lands cover such forest- Mburabuturo, m<strong>on</strong>t<strong>Kigali</strong>- Aerial pho<strong>to</strong>s from NLCNati<strong>on</strong>al Institute of Statistics of<strong>Rwanda</strong>• Households cook<strong>in</strong>g methods- Number of charcoalbags- used <strong>in</strong> <strong>Kigali</strong> City, Improved s<strong>to</strong>ves2.3. Data process<strong>in</strong>g and analysisThis phase c<strong>on</strong>sisted of the assessment of the knowledge, <strong>in</strong>formati<strong>on</strong>, data gaps <strong>in</strong> order <strong>to</strong>propose appropriate soluti<strong>on</strong>s. We adopted qualitative and quantitative methods for data analysis.Data from sec<strong>on</strong>dary data sources regard<strong>in</strong>g <strong>on</strong>-go<strong>in</strong>g air polluti<strong>on</strong> studies was descriptivelyanalyzed l<strong>in</strong>k<strong>in</strong>g them <strong>to</strong> the c<strong>on</strong>sultant experiences and knowledge. Textual data from surveys,<strong>in</strong>terviews, which c<strong>on</strong>stitute the major source of additi<strong>on</strong>al data, was synthesized <strong>to</strong> show the levelof polluti<strong>on</strong> vs. documentary sources; <strong>to</strong> establish patterns of the current <strong>in</strong>stituti<strong>on</strong>al and <strong>in</strong>dividual
23c<strong>on</strong>cepti<strong>on</strong> <strong>in</strong> air polluti<strong>on</strong>; and stakeholders’ attitudes, op<strong>in</strong>i<strong>on</strong>s, and general thoughts <strong>on</strong> the levelof <strong>in</strong>vestment <strong>in</strong> the air quality by the different partnerships etc. Geographic Informati<strong>on</strong> Systems(GIS) techniques have been be used <strong>to</strong> map and identify the sensitive sites, am<strong>on</strong>g others,altitude, climate, road map, <strong>in</strong>dustry map, populati<strong>on</strong> of the city.3. Insight <strong>on</strong> Urban <strong>Air</strong> Polluti<strong>on</strong> and Human Health Risks3.1. Def<strong>in</strong><strong>in</strong>g the key c<strong>on</strong>cepts<strong>Air</strong> quality protecti<strong>on</strong> is a key element <strong>in</strong> ensur<strong>in</strong>g susta<strong>in</strong>able livelihoods for both present andfuture generati<strong>on</strong>s. Before address<strong>in</strong>g the issues related <strong>to</strong> air quality and air polluti<strong>on</strong> result<strong>in</strong>gfrom the rapid urbanizati<strong>on</strong> <strong>in</strong> order <strong>to</strong> c<strong>on</strong>duct an assessment of the human health risk for peopleliv<strong>in</strong>g <strong>in</strong> <strong>Kigali</strong> City, it is very important <strong>to</strong> have a comm<strong>on</strong> understand<strong>in</strong>g and agreed <strong>on</strong> work<strong>in</strong>gdef<strong>in</strong>iti<strong>on</strong> of key c<strong>on</strong>cepts related <strong>to</strong> urbanizati<strong>on</strong> process and their implicati<strong>on</strong>s <strong>to</strong> air polluti<strong>on</strong> andhuman health risk <strong>in</strong> urban areas.3.1.1. Urbanizati<strong>on</strong> and urban envir<strong>on</strong>mentIn 2008, for the first time <strong>in</strong> his<strong>to</strong>ry, over half of the World’s populati<strong>on</strong> lived <strong>in</strong> urban areas and by2050 this will have risen <strong>to</strong> 70 per cent. Most of the growth <strong>in</strong> the world’s populati<strong>on</strong> over the next20 years will be <strong>in</strong> and around the urban centres <strong>in</strong> low- and middle-<strong>in</strong>come countries – which arema<strong>in</strong>ly c<strong>on</strong>centrated <strong>in</strong> develop<strong>in</strong>g countries (UN-Habitat, 2009). Al<strong>on</strong>g <strong>with</strong> this, a populati<strong>on</strong>density <strong>in</strong> urban areas is sharply boost<strong>in</strong>g urbanizati<strong>on</strong> and poses enormous pressures <strong>on</strong> urbanenvir<strong>on</strong>ment result<strong>in</strong>g <strong>in</strong> envir<strong>on</strong>mental problems <strong>in</strong>clud<strong>in</strong>g air polluti<strong>on</strong> (UNEP, 1997).Urbanizati<strong>on</strong> is a process of relative growth <strong>in</strong> a country’s urban populati<strong>on</strong> accompanied by aneven faster <strong>in</strong>crease <strong>in</strong> the ec<strong>on</strong>omic, political, and cultural importance of cities relative <strong>to</strong> ruralareas. In most countries it is a natural c<strong>on</strong>sequence and stimulus of ec<strong>on</strong>omic development based<strong>on</strong> <strong>in</strong>dustrializati<strong>on</strong> (Sobbot<strong>in</strong>a and Sheram 2000). However, air polluti<strong>on</strong> has been aggravated bydevelopments that typically occur as countries become <strong>in</strong>dustrialised: grow<strong>in</strong>g cities, <strong>in</strong>creas<strong>in</strong>gtraffic, rapid ec<strong>on</strong>omic development and <strong>in</strong>dustrializati<strong>on</strong>, and higher levels of energy c<strong>on</strong>sumpti<strong>on</strong>.Sub-Saharan Africa is <strong>on</strong>e of the least urbanized regi<strong>on</strong>s <strong>in</strong> the world, but the urban populati<strong>on</strong> <strong>in</strong>Africa is grow<strong>in</strong>g very rapidly (Mabogunje, 1995). With this growth comes polluti<strong>on</strong>. Povertystricken citizens <strong>in</strong> Africa, particularly <strong>in</strong> the urban populati<strong>on</strong>, are most negatively impacted by
24poor air. The causes of air polluti<strong>on</strong> are multiple. Because many households are us<strong>in</strong>g charcoal orwood for energy, the amount of carb<strong>on</strong> dioxide produced by African cities has been <strong>on</strong> the rise.The 1991 global greenhouse emissi<strong>on</strong>s of South Africa, Ex- Zaire, and Nigeria ranked them am<strong>on</strong>gthe <strong>to</strong>p fifty countries <strong>in</strong> terms of their c<strong>on</strong>tributi<strong>on</strong> (Mabogunje, 1995). The people that live <strong>in</strong> Africaare exposed <strong>to</strong> <strong>in</strong>door and outdoor air polluti<strong>on</strong> that can cause many different health problems. The<strong>in</strong>door polluti<strong>on</strong> partly comes from the <strong>in</strong>creased use of wood and charcoal <strong>in</strong> cook<strong>in</strong>g.Even the <strong>in</strong>dustrialized countries, <strong>with</strong> higher standards of liv<strong>in</strong>g and greater numbers of cars,produce far more air polluti<strong>on</strong> and greenhouse gases than develop<strong>in</strong>g countries; they can reduceenvir<strong>on</strong>mental hazards. A number of promis<strong>in</strong>g technologies are candidates for lower<strong>in</strong>g vehicleemissi<strong>on</strong>s, <strong>in</strong>clud<strong>in</strong>g particle traps, a system <strong>to</strong> reduce nitrogen oxide emissi<strong>on</strong>s, preheatedcatalytic c<strong>on</strong>verters and electr<strong>on</strong>ic vehicle c<strong>on</strong>trols. For further emissi<strong>on</strong> reducti<strong>on</strong>s, new eng<strong>in</strong>eand after treatment technologies may require fuels that are free of metals and have zero sulfurc<strong>on</strong>tent and a low c<strong>on</strong>tent of polycyclic aromatic hydrocarb<strong>on</strong>s (Krzyzanowski et al., 2005). Most ofdevelop<strong>in</strong>g countries do not have this new technology or capacity <strong>to</strong> do so. The c<strong>on</strong>sumpti<strong>on</strong> is farlower but the expensive energy-efficient or clean-up technologies are ec<strong>on</strong>omically impractical forthese countries. For these reas<strong>on</strong>s envir<strong>on</strong>mental problems occur more often <strong>in</strong> developedcountries.3.1.2. What is air polluti<strong>on</strong>?<strong>Air</strong> is made up of 78% nitrogen 21% oxygen, under 1% carb<strong>on</strong> dioxide, and trace amounts of othergases.The World Health Organizati<strong>on</strong> (WHO) def<strong>in</strong>es air polluti<strong>on</strong> as "substances put <strong>in</strong><strong>to</strong> the airby the activity of mank<strong>in</strong>d <strong>in</strong><strong>to</strong> c<strong>on</strong>centrati<strong>on</strong>s sufficient <strong>to</strong> cause harmful effects <strong>to</strong> health, property,crop yield or <strong>to</strong> <strong>in</strong>terfere <strong>with</strong> the enjoyment of property” (WHO, 1997a). <strong>Air</strong> polluti<strong>on</strong> means “thepresence or threatened discharge, from whatever source, of solid, semisolid, liquid or gaseousmatter or any comb<strong>in</strong>ati<strong>on</strong> thereof, <strong>in</strong> the ambient air <strong>in</strong> sufficient quantities and of suchcharacteristics and durati<strong>on</strong> which: Injures or threatens <strong>to</strong> <strong>in</strong>jure human, plant or animal life; ordamages or threatens <strong>to</strong> damage property; or unreas<strong>on</strong>ably <strong>in</strong>terferes <strong>with</strong> the comfortableenjoyment of life and property” (Elsom, 1992; UNEP, 2004). In local c<strong>on</strong>text, the Organic LawDeterm<strong>in</strong><strong>in</strong>g the Modalities of Protecti<strong>on</strong>, C<strong>on</strong>servati<strong>on</strong> and Promoti<strong>on</strong> of the Envir<strong>on</strong>ment <strong>in</strong><strong>Rwanda</strong> def<strong>in</strong>es the atmospheric polluti<strong>on</strong> as “a voluntary or accidental c<strong>on</strong>tam<strong>in</strong>ati<strong>on</strong> of theatmosphere and the surround<strong>in</strong>g air, gas, smoke, any particles or substances that may endanger
25biodiversity, human health and their security or disrupt agricultural activities, disrupt <strong>in</strong>stallati<strong>on</strong>s orthe nature of <strong>to</strong>urist sites and mounta<strong>in</strong>s”(Government of <strong>Rwanda</strong>, 2005).3.1.3. Sources of air polluti<strong>on</strong>The ma<strong>in</strong> sources of air polluti<strong>on</strong> which are man made relate <strong>to</strong> transportati<strong>on</strong>, <strong>in</strong>dustry,combusti<strong>on</strong> fuels, <strong>in</strong>dustrial processes and use of pesticides. More specifically the pollutants<strong>in</strong>clude suspended matter, sulfur dioxide, nitrogen dioxide, hydrocarb<strong>on</strong>s and oz<strong>on</strong>e due <strong>to</strong>populati<strong>on</strong> growth, urbanizati<strong>on</strong>, <strong>in</strong>dustrializati<strong>on</strong> and <strong>in</strong>creased use of mo<strong>to</strong>r vehicles. Similarly theWHO (1997b) analysis identified problems of limited capacity <strong>in</strong> terms of fund<strong>in</strong>g, equipment andhuman resources <strong>to</strong> measure, assess, c<strong>on</strong>trol and mitigate air polluti<strong>on</strong>; <strong>in</strong>adequate <strong>in</strong>formati<strong>on</strong> <strong>on</strong>air polluti<strong>on</strong> and its impacts; limited public awareness and limited enforcement of exist<strong>in</strong>g nati<strong>on</strong>al,regi<strong>on</strong>al and <strong>in</strong>ternati<strong>on</strong>al legislati<strong>on</strong>s.Figure 1: Ma<strong>in</strong> source of urban air polluti<strong>on</strong>Source:http://upload.wikimedia.org/wikipedia/comm<strong>on</strong>s/1/14/<strong>Air</strong>_Polluti<strong>on</strong> Causes%26Effects.svgThe figure above is the schematic draw<strong>in</strong>g of the causes and effects of air polluti<strong>on</strong> where: (1)greenhouse effect, (2) particulate c<strong>on</strong>tam<strong>in</strong>ati<strong>on</strong>, (3) <strong>in</strong>creased UV radiati<strong>on</strong>, (4) acid ra<strong>in</strong>, (5)<strong>in</strong>creased ground level oz<strong>on</strong>e c<strong>on</strong>centrati<strong>on</strong>, (6) <strong>in</strong>creased levels of nitrogen oxides.
26Polluti<strong>on</strong> from urban atmosphere is due <strong>to</strong> air pollutant emissi<strong>on</strong>s and transmissi<strong>on</strong>s. Emissi<strong>on</strong>s ofsulfur dioxide have as ma<strong>in</strong> cause the activities <strong>in</strong> the steel <strong>in</strong>dustry, the oil ref<strong>in</strong>eries, the mo<strong>to</strong>rvehicles, the thermo-electric power stati<strong>on</strong>s. Nitrogen oxide emissi<strong>on</strong>s are largely caused byelectricity and thermal <strong>in</strong>dustry, road traffic and manufactur<strong>in</strong>g <strong>in</strong>dustries (UNEP, 2004). Eng<strong>in</strong>eemissi<strong>on</strong>s from road traffic are an important source of polluti<strong>on</strong> around the world (Alpopi andColesca, 2010). There are three broad sources of air polluti<strong>on</strong> from human activities; stati<strong>on</strong>ary orpo<strong>in</strong>t, mobile, and <strong>in</strong>door air polluti<strong>on</strong>. Industries, power plants, etc are the causes of stati<strong>on</strong>ary airpolluti<strong>on</strong>, where as <strong>in</strong>door air polluti<strong>on</strong> refers <strong>to</strong> polluti<strong>on</strong>s from open fires for cook<strong>in</strong>g and heat<strong>in</strong>g.It is mostly a problem <strong>in</strong> develop<strong>in</strong>g countries, and its effect become <strong>in</strong>tense <strong>in</strong> rural areas. Mobileor vehicular air polluti<strong>on</strong> is particularly a serious problem <strong>in</strong> urban areas (Kathuria, 2001).Pollutants can be classified as either primary or sec<strong>on</strong>dary. Usually, primary pollutants aresubstances directly emitted from a process, such as ash from a volcanic erupti<strong>on</strong>, the carb<strong>on</strong>m<strong>on</strong>oxide gas from a mo<strong>to</strong>r vehicle exhaust or sulfur dioxide released from fac<strong>to</strong>ries. Sec<strong>on</strong>darypollutants are not emitted directly but they are produced by reacti<strong>on</strong>s between primary pollutants.Rather, they form <strong>in</strong> the air when primary pollutants react or <strong>in</strong>teract. An important example of asec<strong>on</strong>dary pollutant is ground level oz<strong>on</strong>e (UNEP, 2004). Oz<strong>on</strong>e gas is not usually emitted directly<strong>in</strong><strong>to</strong> the atmosphere, but at ground-level is created by a chemical reacti<strong>on</strong> between oxides ofnitrogen (NOx) and volatile organic compounds (VOC) <strong>in</strong> the presence of sunlight. Mo<strong>to</strong>r vehicleexhaust and <strong>in</strong>dustrial emissi<strong>on</strong>s, gasol<strong>in</strong>e vapours, and chemical solvents as well as naturalsources emit NOx and VOC that help form oz<strong>on</strong>e (Mi<strong>to</strong>, 2010). Some pollutants may be bothprimary and sec<strong>on</strong>dary: that is, they are both emitted directly and formed from other primarypollutants (Alpopi and Colesca, 2010). There are also natural sources such as w<strong>in</strong>d-blown dust andsmoke from fires. Some forms of air polluti<strong>on</strong> create global problems, such as upper atmosphereoz<strong>on</strong>e depleti<strong>on</strong> and global warm<strong>in</strong>g. These problems are very complex, and require <strong>in</strong>ternati<strong>on</strong>alcooperative efforts <strong>to</strong> f<strong>in</strong>d soluti<strong>on</strong>s. The table below summarizes the comm<strong>on</strong> air pollutants andtheir sources.Table 2: Comm<strong>on</strong> pollutants, sources and characteristicsPollutants Descripti<strong>on</strong> SourcesCarb<strong>on</strong> m<strong>on</strong>oxide (CO) Colorless, odorless gas • Vehicles <strong>in</strong>door sources, <strong>in</strong>clud<strong>in</strong>gkerosene, wood burn<strong>in</strong>g, natural gas,coal, or wood-burn<strong>in</strong>g s<strong>to</strong>ves and
27heatersLead (Pb) Metallic element • Vehicles burn<strong>in</strong>g leaded gasol<strong>in</strong>e• Metal ref<strong>in</strong>eriesNitrogen oxides (NOx )Gaseous compoundsmade up of nitrogen andoxygen• Vehicles• Power plants burn<strong>in</strong>g fossil fuels• Coal-burn<strong>in</strong>g s<strong>to</strong>vesOz<strong>on</strong>e (O3 ) Gaseous pollutant • Vehicle exhaust and certa<strong>in</strong> otherfumes• Formed from other air pollutants <strong>in</strong> thepresence of sunlightParticulate matterSulfur dioxide(SO2 )Very small particles ofsoot, dust, or other matter,<strong>in</strong>clud<strong>in</strong>g t<strong>in</strong>y droplets ofliquidsGaseous compoundmade up of sulfur andoxygen• Diesel eng<strong>in</strong>es• Power plants• Industries• W<strong>in</strong>dblown dust• Wood s<strong>to</strong>ves• Coal-burn<strong>in</strong>g power plants and<strong>in</strong>dustries• Coal-burn<strong>in</strong>g s<strong>to</strong>ves• Ref<strong>in</strong>eriesSource: (United States Envir<strong>on</strong>mental Protecti<strong>on</strong> Agency 2003; United Nati<strong>on</strong>s for Envir<strong>on</strong>ment Programme 2004; andWorld Health Organizati<strong>on</strong> 2006)Accord<strong>in</strong>g <strong>to</strong> the United States Envir<strong>on</strong>mental Protecti<strong>on</strong> Agency (US-EPA), emissi<strong>on</strong>s from an<strong>in</strong>dividual car are generally low, relative <strong>to</strong> the smokestack image many people associate <strong>with</strong> airpolluti<strong>on</strong>. But <strong>in</strong> numerous cities across the country, the pers<strong>on</strong>al au<strong>to</strong>mobile is the s<strong>in</strong>gle greatestpolluter, as emissi<strong>on</strong>s from milli<strong>on</strong>s of vehicles <strong>on</strong> the road add up. Driv<strong>in</strong>g a private car is probablya typical citizen’s most “pollut<strong>in</strong>g” daily activity.With regards <strong>to</strong> the sources of au<strong>to</strong>mobileemissi<strong>on</strong>s it is well known that the power <strong>to</strong> move a car comes from burn<strong>in</strong>g fuel <strong>in</strong> an eng<strong>in</strong>e.Polluti<strong>on</strong> from cars comes from by-products of this combusti<strong>on</strong> process (exhaust) and fromevaporati<strong>on</strong> of the fuel itself as shown <strong>in</strong> the figure below.Figure 2: Evaporative emissi<strong>on</strong>s from vehicles
28Source: (US-EPA, 1994)Dur<strong>in</strong>g the combusti<strong>on</strong> process, gasol<strong>in</strong>e and diesel fuels are mixtures of hydrocarb<strong>on</strong>s,compounds which c<strong>on</strong>ta<strong>in</strong> hydrogen and carb<strong>on</strong> a<strong>to</strong>ms. In a “perfect” eng<strong>in</strong>e, oxygen <strong>in</strong> the airwould c<strong>on</strong>vert all the hydrogen <strong>in</strong> the fuel <strong>to</strong> water and all the carb<strong>on</strong> <strong>in</strong> the fuel <strong>to</strong> carb<strong>on</strong> dioxide.Nitrogen <strong>in</strong> the air would rema<strong>in</strong> unaffected. In reality, the combusti<strong>on</strong> process cannot be “perfect,”and au<strong>to</strong>motive eng<strong>in</strong>es emit several types of pollutants:• “Perfect” Combusti<strong>on</strong>: Fuel (hydrocarb<strong>on</strong>s) + <strong>Air</strong> (oxygen and nitrogen) carb<strong>on</strong> dioxide +water + unaffected nitrogen.• Typical Eng<strong>in</strong>e Combusti<strong>on</strong>: Fuel + <strong>Air</strong> unburned hydrocarb<strong>on</strong>s + Nitrogen oxides+Carb<strong>on</strong> m<strong>on</strong>oxide + Carb<strong>on</strong> dioxide + water.The most exhaust pollutants are hydrocarb<strong>on</strong>s, nitrogen oxides (NOx), carb<strong>on</strong> m<strong>on</strong>oxide (CO),and carb<strong>on</strong> dioxide (CO2). Hydrocarb<strong>on</strong> emissi<strong>on</strong>s result when fuel molecules <strong>in</strong> the eng<strong>in</strong>e d<strong>on</strong>ot burn or burn <strong>on</strong>ly partially. Hydrocarb<strong>on</strong>s react <strong>in</strong> the presence of nitrogen oxides and sunlight<strong>to</strong> form ground-level oz<strong>on</strong>e, a major comp<strong>on</strong>ent of smog. Oz<strong>on</strong>e irritates the eyes, damages thelungs, and aggravates respira<strong>to</strong>ry problems. It is our most widespread and <strong>in</strong>tractable urban airpolluti<strong>on</strong> problem. A number of exhaust hydrocarb<strong>on</strong>s are also <strong>to</strong>xic, <strong>with</strong> the potential <strong>to</strong> causecancer.Under the high pressure and temperature c<strong>on</strong>diti<strong>on</strong>s <strong>in</strong> an eng<strong>in</strong>e, nitrogen and oxygen a<strong>to</strong>ms <strong>in</strong>the air react <strong>to</strong> form various nitrogen oxides, collectively known as nitrogen oxides (NOx).
29Nitrogen oxides, like hydrocarb<strong>on</strong>s, are precursors <strong>to</strong> the formati<strong>on</strong> of oz<strong>on</strong>e. They also c<strong>on</strong>tribute<strong>to</strong> the formati<strong>on</strong> of acid ra<strong>in</strong>. Carb<strong>on</strong> m<strong>on</strong>oxide (CO) is a product of <strong>in</strong>complete combusti<strong>on</strong> andoccurs when carb<strong>on</strong> <strong>in</strong> the fuel is partially oxidized rather than fully oxidized <strong>to</strong> carb<strong>on</strong> dioxide(CO). Carb<strong>on</strong> m<strong>on</strong>oxide reduces the flow of oxygen <strong>in</strong> the bloodstream and is particularlydangerous <strong>to</strong> pers<strong>on</strong>s <strong>with</strong> heart disease. In recent years, the carb<strong>on</strong> dioxide (CO2) as a polluti<strong>on</strong>c<strong>on</strong>cern has started <strong>to</strong> be viewed as a product of “perfect” combusti<strong>on</strong>. Even if carb<strong>on</strong> dioxide doesnot directly impair human health, it is however a “greenhouse gas” that traps the earth’s heat andc<strong>on</strong>tributes <strong>to</strong> the potential for global warm<strong>in</strong>g (UNEP, 2004; US-EPA, 1994).Apart from the exhaust pollutants, other hydrocarb<strong>on</strong> pollutants (as evaporative emissi<strong>on</strong>s) alsoescape <strong>in</strong><strong>to</strong> the air through fuel evaporati<strong>on</strong>. With <strong>to</strong>day’s efficient exhaust emissi<strong>on</strong> c<strong>on</strong>trols and<strong>to</strong>day’s gasol<strong>in</strong>e formulati<strong>on</strong>s, evaporative losses can account for a majority of the <strong>to</strong>talhydrocarb<strong>on</strong> polluti<strong>on</strong> from current model cars <strong>on</strong> hot days when oz<strong>on</strong>e levels are highest. Based<strong>on</strong> an overview of au<strong>to</strong>mobile emissi<strong>on</strong>s of the United States Envir<strong>on</strong>mental Protecti<strong>on</strong> agency(US-EPA), the evaporative emissi<strong>on</strong>s occur several ways:• Diurnal: Gasol<strong>in</strong>e evaporati<strong>on</strong> <strong>in</strong>creases as the temperature rises dur<strong>in</strong>g the day, heat<strong>in</strong>gthe fuel tank and vent<strong>in</strong>g gasol<strong>in</strong>e vapors.• Runn<strong>in</strong>g losses: The hot eng<strong>in</strong>e and exhaust system can vaporize gasol<strong>in</strong>e when the car isrunn<strong>in</strong>g.• Hot soak: The eng<strong>in</strong>e rema<strong>in</strong>s hot for a period of time after the car is turned off, andgasol<strong>in</strong>e evaporati<strong>on</strong> c<strong>on</strong>t<strong>in</strong>ues when the car is parked.• Refuel<strong>in</strong>g: Gasol<strong>in</strong>e vapors are always present <strong>in</strong> fuel tanks. These vapors are forced outwhen the tank is filled <strong>with</strong> liquid fuel (US-EPA, 1994 pp.2-3).Each country, regi<strong>on</strong> and area has different envir<strong>on</strong>mental problems attributed by their degree ofdevelopment, culture, geography and characteristic. It was argued that there were certa<strong>in</strong>envir<strong>on</strong>mental problems associated <strong>with</strong> the degree of cities’ ec<strong>on</strong>omic development namely low,medium and high <strong>in</strong>come levels and they were called grey and green agenda, respectively. Forurban air polluti<strong>on</strong> problems, each agenda can be described.
30Figure 3: Cause of <strong>Air</strong> Polluti<strong>on</strong>, Pollutants, Associated Problems and ScaleAgenda Causes Pollutants AssociatedproblemsScaleBrownIncreas<strong>in</strong>g number of vehicleHeavy usage of diesel powered vehicleHeavy usage of obsolete vehiclesHeavy usage of mo<strong>to</strong>r cycles (2 stroke)Unpaved and/or poorly ma<strong>in</strong>ta<strong>in</strong>ed streetOpen burn<strong>in</strong>gInadequate <strong>in</strong>frastructureLow quality of fuelLittle emissi<strong>on</strong> c<strong>on</strong>trol & technology <strong>in</strong><strong>in</strong>dustryPresence of <strong>in</strong>dustries (e.g. ceramic,brick works, agrochemical fac<strong>to</strong>ry)Particulate matters (PM10,PM2.5)Lead (Pb)Sulphur dioxide (SO2)Oxides of nitrogen (NOx)Oz<strong>on</strong>e (O3)Hydrocarb<strong>on</strong>s (HCs)Carb<strong>on</strong>e m<strong>on</strong>oïde (CO)Hydrogen fluoride (HF)Heavy metals (e.g. Pb,Hg, Cod etc.)Human healthproblem (acute)Ecosystem healthproblem (acute)LocalGrayIncreas<strong>in</strong>g number of vehicleUse of mo<strong>to</strong>r cycles (2 stroke)Use of obsolete vehiclesUse of diesel powered vehiclesInadequate <strong>in</strong>frastructureImproved but still low quality of fuelSome emissi<strong>on</strong> c<strong>on</strong>trol & technology <strong>in</strong><strong>in</strong>dustryParticulate matters (PM10,PM2.5)Sulphur dioxide (SO2)Oxides of nitrogen (NOx)Oz<strong>on</strong>e (O3)Hydro cabre (HFCs)Carb<strong>on</strong>e m<strong>on</strong>oïde (CO)Human healthproblem (chr<strong>on</strong>ic)Ecosystem healthproblem (chr<strong>on</strong>ic)Greenhouse gasemissi<strong>on</strong> (global)Acid ra<strong>in</strong> (global)Regi<strong>on</strong>alGreenLarge number of vehicle populati<strong>on</strong>Limited dry depositi<strong>on</strong> of pollutantsWaste <strong>in</strong>c<strong>in</strong>erati<strong>on</strong>F<strong>in</strong>e particulate matter(PM2.5)Oxides of nitrogen (NOx)Oz<strong>on</strong>e (O3)Hidno carb<strong>on</strong>a (k.o.)Human healthproblem (chr<strong>on</strong>ic)Greenhouse gasemissi<strong>on</strong>Stra<strong>to</strong>spheric oz<strong>on</strong>edepleti<strong>on</strong>GlobalSource: (Ishii, 2004)Endocr<strong>in</strong>e disrupti<strong>on</strong>substances (EDS)Acid ra<strong>in</strong>L<strong>on</strong>g-rangetransport
31In current high <strong>in</strong>come cities, level of traditi<strong>on</strong>al pollutants closely related <strong>to</strong> brown and greyagenda (Table 1) are currently less pr<strong>on</strong>ounced due <strong>to</strong> enforcement of laws and regulati<strong>on</strong>s(OECD, 1995). Yet it is also known that comm<strong>on</strong>ly these cities suffer from new aris<strong>in</strong>g problemssuch as f<strong>in</strong>e and ultra f<strong>in</strong>e particulate matter (PM0.1-PM2.5), pho<strong>to</strong>chemical oz<strong>on</strong>e and greenhousegases as they were described as a green agenda.Figure 4: Urban Ec<strong>on</strong>omic Transiti<strong>on</strong> and Associated Envir<strong>on</strong>mental Agendas for Developed CountriesIntroducti<strong>on</strong> of Legalenforcements & c<strong>on</strong>trols?Brown agendaGrey agendaGreen agendaLowMediumHighIncome levelSource: OECD, 1995In low and medium <strong>in</strong>come cities, situati<strong>on</strong>s were slightly different from those affluent cities <strong>in</strong> thepast. His<strong>to</strong>rically <strong>in</strong> those high <strong>in</strong>come cities, there was a situati<strong>on</strong> that a brown, grey and greenagenda came <strong>in</strong> sequence over relatively l<strong>on</strong>ger time scale and, policy and <strong>in</strong>itiatives such asstr<strong>on</strong>g legal enforcements and effectively overcame aris<strong>in</strong>g problems (Bai and Imura, 2000).The impact of air polluti<strong>on</strong> <strong>on</strong> health depends <strong>on</strong> how much polluti<strong>on</strong> people actually experiencedur<strong>in</strong>g their daily lives, which is called their exposure. Exposures can be great even whenemissi<strong>on</strong>s do not affect the outdoor envir<strong>on</strong>ment significantly, if the source of emissi<strong>on</strong>s is close <strong>to</strong>the populati<strong>on</strong>. It has been estimated that nearly half the world’s populati<strong>on</strong> still uses solid fuels(biomass and coal) for household cook<strong>in</strong>g and space heat<strong>in</strong>g, mostly <strong>in</strong> develop<strong>in</strong>g countries. Inthe proper c<strong>on</strong>diti<strong>on</strong>s, biomass (wood and agricultural residues) can be burned quite cleanly,produc<strong>in</strong>g mostly carb<strong>on</strong> dioxide and water. Such c<strong>on</strong>diti<strong>on</strong>s are difficult <strong>to</strong> achieve <strong>in</strong> small-scale<strong>in</strong>expensive s<strong>to</strong>ves, however, and the actual emissi<strong>on</strong>s of health damag<strong>in</strong>g pollutants are quitelarge per unit fuel, although the <strong>to</strong>tal emissi<strong>on</strong>s are not large <strong>in</strong> the c<strong>on</strong>text of overall fuel use.
32<strong>Air</strong> polluti<strong>on</strong> has l<strong>on</strong>g been a problem <strong>in</strong> the <strong>in</strong>dustrial nati<strong>on</strong>s of the world <strong>in</strong> particularly fordeveloped countries. It has now become an <strong>in</strong>creas<strong>in</strong>g source of envir<strong>on</strong>mental degradati<strong>on</strong> <strong>in</strong> thedevelop<strong>in</strong>g nati<strong>on</strong>s of the world. An air polluti<strong>on</strong> cost refers <strong>to</strong> mo<strong>to</strong>r vehicle air pollutantdamages, <strong>in</strong>clud<strong>in</strong>g human health, ecological and esthetic degradati<strong>on</strong>. Tailpipe emissi<strong>on</strong>s arepollutants released directly from vehicle exhaust pipes. Lifecycle emissi<strong>on</strong>s <strong>in</strong>clude both tailpipeemissi<strong>on</strong>s and <strong>in</strong>direct emissi<strong>on</strong>s from fuel extracti<strong>on</strong> and ref<strong>in</strong><strong>in</strong>g, vehicle manufactur<strong>in</strong>g, andc<strong>on</strong>structi<strong>on</strong> of facilities for transportati<strong>on</strong>. Different fac<strong>to</strong>rs <strong>in</strong>fluence air polluti<strong>on</strong> <strong>in</strong>clude differentgases produced dur<strong>in</strong>g transport, householder cook<strong>in</strong>g, gases com<strong>in</strong>g from <strong>in</strong>dustrials, such asSO2, NO2, NO, NOx, …. Etc. The <strong>to</strong>pography and the meteorological c<strong>on</strong>diti<strong>on</strong>s of an area arealso c<strong>on</strong>sidered as dispersi<strong>on</strong> fac<strong>to</strong>rs gas emissi<strong>on</strong> from the air polluti<strong>on</strong> sources and thereforeresp<strong>on</strong>sible of differences <strong>in</strong> air polluti<strong>on</strong> c<strong>on</strong>centrati<strong>on</strong> from <strong>on</strong>e area <strong>to</strong> another.4. Study design4.1. Guid<strong>in</strong>g research questi<strong>on</strong>sData collecti<strong>on</strong> methodology will be questi<strong>on</strong>-guided as follows: (i) what are the respira<strong>to</strong>ry andother diseases related <strong>to</strong> air polluti<strong>on</strong> <strong>in</strong> <strong>Rwanda</strong> and <strong>in</strong> <strong>Kigali</strong> <strong>in</strong> particular and appropriatemeasures undertaken if any? (ii) How and under what c<strong>on</strong>diti<strong>on</strong>s can air polluti<strong>on</strong> <strong>in</strong> <strong>Rwanda</strong> bebetter fostered so as <strong>to</strong> realize adaptive capacity for resp<strong>on</strong>d<strong>in</strong>g <strong>to</strong> envir<strong>on</strong>mental changes? (iii)What are the ma<strong>in</strong> sources of air polluti<strong>on</strong> and the fac<strong>to</strong>rs that may <strong>in</strong> the future <strong>in</strong>fluence the airpolluti<strong>on</strong> trend <strong>in</strong> <strong>Rwanda</strong>, <strong>in</strong>crease or decrease the pollutants? (iv) What are the exist<strong>in</strong>g gaps <strong>in</strong>the exist<strong>in</strong>g data? (vi) What are the strategies undertaken <strong>to</strong> Reduce <strong>Air</strong> Polluti<strong>on</strong> from Transport?What are the respira<strong>to</strong>ry and other diseases related <strong>to</strong> air polluti<strong>on</strong> <strong>in</strong> <strong>Rwanda</strong> and <strong>in</strong> <strong>Kigali</strong> <strong>in</strong>particular and appropriate measures undertaken if any?4.2. Pressure-State-Resp<strong>on</strong>se Based ApproachThe above def<strong>in</strong>ed research questi<strong>on</strong>s have been addressed by review<strong>in</strong>g different documents <strong>in</strong>the M<strong>in</strong>istry of Health, Hospital records, Nati<strong>on</strong>al Institute of Statistics and other <strong>in</strong>stituti<strong>on</strong>s <strong>with</strong>vested <strong>in</strong>terest <strong>in</strong> air polluti<strong>on</strong> related diseases–such as previous research work, reports <strong>on</strong> theexist<strong>in</strong>g diseases, purposely <strong>to</strong> establish the l<strong>in</strong>k of the type of disease <strong>with</strong> air, <strong>in</strong>clud<strong>in</strong>g measuresundertaken, geographic locati<strong>on</strong> of the patients, and Distributi<strong>on</strong> of populati<strong>on</strong> or populati<strong>on</strong>density. In additi<strong>on</strong>, this review will boost knowledge base of air pollutant, activity of the patient(work) and frequency of the diseases. Documented <strong>in</strong>formati<strong>on</strong> was supplemented <strong>with</strong> data
33generated through <strong>in</strong>terviews <strong>with</strong> local community <strong>in</strong> selected area of the <strong>Kigali</strong> city, relevant<strong>in</strong>stituti<strong>on</strong> and <strong>in</strong>dustries. The <strong>in</strong>terviews will be open-ended and loosely structured <strong>to</strong> allow forflexibility and adaptati<strong>on</strong> depend<strong>in</strong>g <strong>on</strong> the <strong>in</strong>terviewee(s) <strong>in</strong> questi<strong>on</strong>. Interviews will particularlyhelp researchers <strong>to</strong> understand the level of n<strong>on</strong> reported diseases cases, understand<strong>in</strong>g of airpolluti<strong>on</strong> problems. They will simultaneously probe the necessity <strong>to</strong> take <strong>in</strong><strong>to</strong> c<strong>on</strong>siderati<strong>on</strong> somepractical soluti<strong>on</strong>s <strong>to</strong> improve the situati<strong>on</strong>.To answer<strong>in</strong>g the questi<strong>on</strong> of how and under what c<strong>on</strong>diti<strong>on</strong>s can air polluti<strong>on</strong> be better fostered <strong>in</strong><strong>Rwanda</strong> so as <strong>to</strong> realize adaptive capacity for resp<strong>on</strong>d<strong>in</strong>g <strong>to</strong> envir<strong>on</strong>mental changes, the air qualityissues have been explored from relevant literature? The ma<strong>in</strong> objective was <strong>to</strong> establish theoreticalstandpo<strong>in</strong>ts <strong>with</strong> <strong>reference</strong> <strong>to</strong> how air polluti<strong>on</strong> has been viewed, debated and ref<strong>in</strong>ed and, itssensitivity <strong>to</strong> the human health. Literature sources have been complemented by face-<strong>to</strong>-face<strong>in</strong>terviews and reflective case studies, each cover<strong>in</strong>g a range of professi<strong>on</strong>als and practiti<strong>on</strong>ers <strong>in</strong>the air quality or envir<strong>on</strong>ment guidel<strong>in</strong>e/standards, engag<strong>in</strong>g them <strong>in</strong> debates <strong>on</strong> <strong>in</strong>stituti<strong>on</strong>al and<strong>on</strong> their own field experiences. Reflective case studies were used <strong>to</strong> elucidate stakeholderpercepti<strong>on</strong>s of challenges, opportunities, key issues and outcomes of the <str<strong>on</strong>g>study</str<strong>on</strong>g>. The wholepurpose was <strong>to</strong> gather enough data and knowledge <strong>on</strong> the exist<strong>in</strong>g gaps <strong>in</strong> air qualitymeasurement, assess the exist<strong>in</strong>g standards/regulati<strong>on</strong>s and policy resp<strong>on</strong>se <strong>in</strong> order <strong>to</strong> proposeappropriate soluti<strong>on</strong>s. More specifically, the follow<strong>in</strong>g data have been collected for the <str<strong>on</strong>g>study</str<strong>on</strong>g> areasus<strong>in</strong>g the Pressure, State and Resp<strong>on</strong>se (P-S-R) based framework. The P-S-R framework hasbeen particularly useful <strong>in</strong> represent<strong>in</strong>g the way <strong>in</strong> which polluti<strong>on</strong> affects the urban envir<strong>on</strong>ment,for example by look<strong>in</strong>g at the various “pressures” exerted <strong>on</strong> the urban envir<strong>on</strong>ment which affect its“state” (urban air quality) and c<strong>on</strong>sequently call for a “resp<strong>on</strong>se” <strong>to</strong> deal <strong>with</strong> the situati<strong>on</strong> airpolluti<strong>on</strong> <strong>in</strong> urban areas (v<strong>on</strong> Schirnd<strong>in</strong>, 2002).4.2.1. Pressures of urban air polluti<strong>on</strong>As pressures of urban air polluti<strong>on</strong>, the related data and <strong>in</strong>formati<strong>on</strong> that were <strong>to</strong> be collectedc<strong>on</strong>cerned <strong>with</strong>: <strong>in</strong>crease <strong>in</strong> urban populati<strong>on</strong>; <strong>in</strong>crease <strong>in</strong> <strong>in</strong>dustrial activities; <strong>in</strong>crease <strong>in</strong> number ofvehicles; <strong>in</strong>crease <strong>in</strong> power generati<strong>on</strong> and <strong>in</strong> door polluti<strong>on</strong> at households. As the problem of airpolluti<strong>on</strong> <strong>in</strong> urban area may also be aggravated by <strong>in</strong>adequate power supply for <strong>in</strong>dustrial,commercial and residential activities, additi<strong>on</strong>al <strong>in</strong>formati<strong>on</strong> <strong>on</strong> the quality and types of bio-
34combustible used was colleted. This <strong>in</strong>formati<strong>on</strong> helped <strong>to</strong> know the power generati<strong>on</strong> units thatare emitt<strong>in</strong>g high level of NOX and SOX. In additi<strong>on</strong>, n<strong>on</strong> po<strong>in</strong>t sources that c<strong>on</strong>tribute <strong>to</strong> the <strong>to</strong>talemissi<strong>on</strong> such as waste burn<strong>in</strong>g, c<strong>on</strong>structi<strong>on</strong> activities, quarry<strong>in</strong>g po<strong>in</strong>t, roadside airborne dustydue <strong>to</strong> the vehicles movement have been <strong>in</strong>vestigated <strong>in</strong> this <str<strong>on</strong>g>study</str<strong>on</strong>g>. As <strong>to</strong>pographical andmeteorological c<strong>on</strong>diti<strong>on</strong>s can str<strong>on</strong>gly <strong>in</strong>fluence the spatial climatic modificati<strong>on</strong>s and the spatialdistributi<strong>on</strong> of air quality and air polluti<strong>on</strong>, the digital elevati<strong>on</strong> model of <strong>Kigali</strong> City was mappedus<strong>in</strong>g the exit<strong>in</strong>g c<strong>on</strong><strong>to</strong>ur l<strong>in</strong>es at a scale of 1: 50000. Climate data such as temperature,precipitati<strong>on</strong>s, w<strong>in</strong>d directi<strong>on</strong> and speed that have recorded by the nearest stati<strong>on</strong>s of <strong>Kigali</strong> Cityhave been collected from the meteorological services under the M<strong>in</strong>istry of Infrastructure(MINIFRA) and analyzed.To analyse the impact of the <strong>in</strong>creas<strong>in</strong>g number of the vehicles <strong>on</strong> air polluti<strong>on</strong> <strong>with</strong><strong>in</strong> <strong>Kigali</strong>, thetransport-related <strong>in</strong>dica<strong>to</strong>rs that can be used <strong>in</strong> the c<strong>on</strong>text of pressure-state-resp<strong>on</strong>se (P-S-R)framework. Pressures lead<strong>in</strong>g <strong>to</strong> air polluti<strong>on</strong> was the number of car or car use levels; vehicleownership per capita, proporti<strong>on</strong> of populati<strong>on</strong> regularly us<strong>in</strong>g public transport; average road trafficvolumes, densities (cars, trucks, buses); greenhouse gas emissi<strong>on</strong> levels by vehicle category;emissi<strong>on</strong> levels from transport vehicles (carb<strong>on</strong> m<strong>on</strong>oxide, nitrogen oxides, oz<strong>on</strong>e, hydrocarb<strong>on</strong>s,particulates, lead, by vehicle category); chlorofluorocarb<strong>on</strong> emissi<strong>on</strong> levels from vehicle airc<strong>on</strong>diti<strong>on</strong>ers and the proporti<strong>on</strong> of vehicles fail<strong>in</strong>g ma<strong>in</strong>tenance/emissi<strong>on</strong>s tests.4.2.2. State, exposure and effects of air polluti<strong>on</strong>State of urban air polluti<strong>on</strong> was analyzed us<strong>in</strong>g <strong>in</strong>dica<strong>to</strong>rs such as annual exceedance of airpolluti<strong>on</strong> standards; air polluti<strong>on</strong> levels (carb<strong>on</strong> m<strong>on</strong>oxide, volatile organic compounds,hydrocarb<strong>on</strong>s, nitrogen oxides, oz<strong>on</strong>e, lead, dust, particulates); traffic density (vehicles per km);rates of traffic flow and prevalence of odors. Exposures <strong>in</strong>formati<strong>on</strong> tried <strong>to</strong> estimate the numberof people that may be exposed <strong>to</strong> air polluti<strong>on</strong> <strong>in</strong> <strong>Kigali</strong> City us<strong>in</strong>g <strong>in</strong>dica<strong>to</strong>rs such proporti<strong>on</strong> ofpopulati<strong>on</strong> liv<strong>in</strong>g <strong>in</strong> proximity of dense traffic; proporti<strong>on</strong> of populati<strong>on</strong> exposed <strong>to</strong> elevatedc<strong>on</strong>centrati<strong>on</strong> levels of traffic-derived air polluti<strong>on</strong>; proporti<strong>on</strong> of populati<strong>on</strong> exposed <strong>to</strong> air quality <strong>in</strong>excess of standards. Human health effects were assessed based <strong>on</strong> mortality and morbiditylevels <strong>in</strong> respect of: acute and chr<strong>on</strong>ic respira<strong>to</strong>ry illness such as asthma, reduced lung functi<strong>on</strong>;lung cancer; cardiovascular disease and stress-related disorders.
35In relati<strong>on</strong> <strong>to</strong> the <strong>in</strong>crease <strong>in</strong> number of vehicles, slow growth of road <strong>in</strong>frastructure and highgrowth of transport performance, this <str<strong>on</strong>g>study</str<strong>on</strong>g> also assessed the acti<strong>on</strong> and strategies that havebeen take <strong>to</strong> m<strong>on</strong>i<strong>to</strong>r/reduce the air polluti<strong>on</strong>. Various acti<strong>on</strong>s can be taken <strong>to</strong> decrease the risks oftransport <strong>to</strong> human health <strong>in</strong>clude for example the producti<strong>on</strong> of safer, cleaner cars (for examplecars <strong>with</strong> gas exhaust clean<strong>in</strong>g devices, electric- or solar-powered cars), improved vehicle<strong>in</strong>specti<strong>on</strong> and ma<strong>in</strong>tenance programmes, changes <strong>in</strong> fuel characteristics and quality, exclusi<strong>on</strong> ofprivate cars from city centre, development of cycl<strong>in</strong>g paths and pedestrian areas, improvement ofpublic transport (for example, railways, tramways and buses can be made less pollut<strong>in</strong>g, less noisyand safer), as well as the <strong>in</strong>troducti<strong>on</strong> of new public transport systems. Improved <strong>to</strong>wn plann<strong>in</strong>gmeasures can also reduce demand for transport, for example, by sit<strong>in</strong>g hous<strong>in</strong>g closer <strong>to</strong> workareas. Park<strong>in</strong>g areas <strong>in</strong> the city can also be limited.5. Urbanizati<strong>on</strong> and air polluti<strong>on</strong> <strong>in</strong> <strong>Rwanda</strong>5.1. Introducti<strong>on</strong><strong>Air</strong> polluti<strong>on</strong> is an <strong>in</strong>ternati<strong>on</strong>al problem, which has many effects and facts <strong>to</strong> the life of the worldpopulati<strong>on</strong>. African countries, <strong>in</strong>clud<strong>in</strong>g <strong>Rwanda</strong> also are also c<strong>on</strong>cerned <strong>with</strong> air polluti<strong>on</strong> problem.It is known that <strong>Rwanda</strong> is a landlocked republic <strong>in</strong> Equa<strong>to</strong>rial Africa. The capital <strong>Kigali</strong> can bementi<strong>on</strong>ed as a typical African city due <strong>to</strong> its ris<strong>in</strong>g populati<strong>on</strong> and the ris<strong>in</strong>g rate of mo<strong>to</strong>rizati<strong>on</strong>.Different pollutants produced e.g. by a high-usage rate of mopeds or open fireplaces burn<strong>in</strong>gwoods for cook<strong>in</strong>g and household chores could be detected. Clima<strong>to</strong>logical parameters as well asair pollutants were measured <strong>with</strong><strong>in</strong> the urban area. The follow<strong>in</strong>g table and figure presents the <strong>to</strong>talnumber of gases emitted <strong>in</strong> <strong>Rwanda</strong> dur<strong>in</strong>g the period of 2005.Table 3: Different Gases emissi<strong>on</strong> <strong>in</strong> <strong>Rwanda</strong> <strong>in</strong> 2005GasesCarb<strong>on</strong> dioxide (CO2) 530.88Méthane (CH4), 71.31Nitrous Oxide (N2O), 10Nitrogen Oxides (NOx) 14Carb<strong>on</strong> m<strong>on</strong>oxide (CO), 2327COVNM 42Sulfur Oxides (SOx). 18Emissi<strong>on</strong>s <strong>in</strong> Gg
36Source:In the above figure, it is clear that thequantity of gases that was emitted <strong>in</strong>the atmosphere <strong>in</strong> 2005 wasdom<strong>in</strong>ated by carb<strong>on</strong> m<strong>on</strong>oxide (77%)followed by carb<strong>on</strong> dioxide (18%) andmethane <strong>with</strong> (2%). But, when youFigure 5: Evoluti<strong>on</strong> of CO and SO2 emissi<strong>on</strong> <strong>in</strong> <strong>Kigali</strong> City <strong>in</strong>n 2009c<strong>on</strong>sider the evoluti<strong>on</strong> of CO and SO2emissi<strong>on</strong> dur<strong>in</strong>g the period of year2009 at the stati<strong>on</strong> IO104-1-204 at<strong>Kigali</strong> city, it was found that the carb<strong>on</strong>dioxide SO2 is the most pollutant gas <strong>in</strong>urban areas of <strong>Rwanda</strong> such <strong>Kigali</strong> City.Source:5.2. Fac<strong>to</strong>rs (sources) of <strong>Air</strong> Polluti<strong>on</strong>The ma<strong>in</strong> categories of air polluti<strong>on</strong> sources <strong>in</strong> many countries of the world are vehicularemissi<strong>on</strong>s, <strong>in</strong>dustrial emissi<strong>on</strong>s, fuel use for domestic purposes such as cook<strong>in</strong>g, and a potentiallylarge miscellaneous category, which <strong>in</strong>cludes burn<strong>in</strong>g of household wastes and emissi<strong>on</strong>s from
Populati<strong>on</strong>37small bus<strong>in</strong>esses and cremati<strong>on</strong> grounds. While particulates from natural sources are notc<strong>on</strong>venti<strong>on</strong>al pollutants, their c<strong>on</strong>tributi<strong>on</strong>s are typically taken <strong>in</strong><strong>to</strong> account <strong>in</strong> <strong>in</strong>ven<strong>to</strong>ries of <strong>to</strong>talsuspended particulates s<strong>in</strong>ce natural sources can be both a major c<strong>on</strong>tribu<strong>to</strong>r <strong>to</strong> polluti<strong>on</strong> and asource of uncerta<strong>in</strong>ty. However, natural dust particles are coarse and do not c<strong>on</strong>tribute significantly<strong>to</strong> particulate matter fracti<strong>on</strong>s that actually get deposited <strong>in</strong> human lungs. The follow<strong>in</strong>g are ma<strong>in</strong>causes of air polluti<strong>on</strong>: Vehicles, Industries and Power plant, Domestic fuel combusti<strong>on</strong>,Householder woods combusti<strong>on</strong> Miscellaneous causes5.3. Impact of rapid urbanizati<strong>on</strong>Urbanisati<strong>on</strong> <strong>in</strong> <strong>Rwanda</strong> currently stands at 18% and is <strong>in</strong>creas<strong>in</strong>g at a rate of 4% per annum. By2020 is expected that over 50% of the populati<strong>on</strong> will be liv<strong>in</strong>g <strong>in</strong> urban centres. <strong>Kigali</strong>, by far andaway the largest city, represent<strong>in</strong>g 44% of the urban populati<strong>on</strong>, illustrates the challenges faced bycities and the built envir<strong>on</strong>ment <strong>in</strong> <strong>Rwanda</strong>. <strong>Kigali</strong> has grown, fuelled by the return of refugees andthis has led <strong>to</strong> large unplanned and underserved neighborhoods. Sec<strong>on</strong>dary centres are unable <strong>to</strong>attract returnees, as they are unable <strong>to</strong> provide solid bases for employment or ec<strong>on</strong>omic services.Unplanned developments are estimated at 8,500 <strong>to</strong> 10,000 units annually <strong>in</strong> <strong>Kigali</strong>, represent<strong>in</strong>g90% of build<strong>in</strong>gs <strong>in</strong> the city (Byamukama et al., 2011).Accord<strong>in</strong>g <strong>to</strong> the 2002 <strong>Rwanda</strong> Nati<strong>on</strong>al Census, between 1991 and 2002, <strong>Kigali</strong> had an averagegrowth rate of 9%. The city’s populati<strong>on</strong> <strong>in</strong>creased from 350,000 <strong>in</strong> 1996 <strong>to</strong> 603,000 <strong>in</strong>habitants <strong>in</strong>2002 as shown <strong>in</strong> the figure 1 (Durand-Lasserve, 2005; MINECOFIN, 2002; MININFRA, 2004;MININFRA, 2008). This <strong>in</strong>crease results from theEvoluti<strong>on</strong> of populati<strong>on</strong> of <strong>Kigali</strong> Citycomb<strong>in</strong>ed effect of natural growth, rural-urban100000090000080000070000060000050000040000030000020000010000001907 1962 1970 1978 1991 1996 2002 2006YearYearPopulati<strong>on</strong>migrati<strong>on</strong>s, and the return of refugees <strong>to</strong> thecountry from the neighbor<strong>in</strong>g countries (Pérousede M<strong>on</strong>tclos, 2002). <strong>Kigali</strong>, as be<strong>in</strong>g the capital of<strong>Rwanda</strong>, is also experienc<strong>in</strong>g a c<strong>on</strong>siderablegrowth and urban planners anticipate that <strong>with</strong><strong>in</strong>the next 10 years, the populati<strong>on</strong> will double(Aib<strong>in</strong>u, 2001; Sano, 2007).Figure 6: Evoluti<strong>on</strong> of populati<strong>on</strong> of <strong>Kigali</strong> City
38<strong>Kigali</strong> is built <strong>on</strong> a hilly landscapes sprawl<strong>in</strong>g across ridges which are separated by swamp valleysand wetlands. The ma<strong>in</strong> bus<strong>in</strong>ess and residential settlements are located <strong>on</strong> <strong>to</strong>p of the ridges,which are enclosed by the steep slopes and sometimes <strong>on</strong> the bot<strong>to</strong>m valleys (Bizimana andSchill<strong>in</strong>g, 2010; Urwibutso, 2008). While this urbanizati<strong>on</strong> is regarded as a driv<strong>in</strong>g force forec<strong>on</strong>omic development, it should however be planned, c<strong>on</strong>trolled and well directed (MININFRA,2008). This rapid <strong>in</strong>crease <strong>in</strong> urban populati<strong>on</strong> has resulted <strong>in</strong> unplanned urban development,<strong>in</strong>crease <strong>in</strong> c<strong>on</strong>sumpti<strong>on</strong> patterns and higher structure, thereby lead<strong>in</strong>g <strong>to</strong> the air polluti<strong>on</strong>problems. This situati<strong>on</strong> is exacerbated by high vehicle density <strong>in</strong> urban centers, older vehiclespredom<strong>in</strong>ant <strong>in</strong> vehicle time; <strong>in</strong>adequate <strong>in</strong>specti<strong>on</strong> and ma<strong>in</strong>tenance of facilities; adulterati<strong>on</strong> offuel and fuel products; improper traffic management system and road c<strong>on</strong>diti<strong>on</strong>s, high levels ofpolluti<strong>on</strong> at traffic <strong>in</strong>tersecti<strong>on</strong>s; absence of effective mass rapid transport system and <strong>in</strong>tra-cityrailway networks and the high populati<strong>on</strong> exodus <strong>to</strong> the urban center (SURBANA, 2010). While theurban populati<strong>on</strong> is expected <strong>to</strong> reach 30% of the nati<strong>on</strong>al populati<strong>on</strong> by 2020 <strong>in</strong> <strong>Rwanda</strong>; howeverthe urban development should not c<strong>on</strong>tribute <strong>to</strong>wards polluti<strong>on</strong> of surround<strong>in</strong>g sub-urban and ruralareas (MINECOFIN, 2000).5.4. Increase <strong>in</strong> <strong>in</strong>dustrial activitiesAs it is typical <strong>in</strong> develop<strong>in</strong>g countries, most of the <strong>in</strong>dustries are located <strong>in</strong> urban areas and about63 per cent of <strong>in</strong>dustries are located <strong>in</strong> and around <strong>Kigali</strong>. Am<strong>on</strong>g the challenges fac<strong>in</strong>g the<strong>in</strong>dustrial sec<strong>to</strong>r, the <strong>in</strong>adequate polluti<strong>on</strong> c<strong>on</strong>trol is the biggest <strong>on</strong>e. <strong>Kigali</strong> provides a largeproporti<strong>on</strong> of the city’s <strong>in</strong>dustrial employment but c<strong>on</strong>sequently a larger porti<strong>on</strong> of the urbanenvir<strong>on</strong>mental problems. A significant number of fac<strong>to</strong>ries which form the <strong>in</strong>dustrial base <strong>in</strong> <strong>Kigali</strong>are located <strong>in</strong> a low-ly<strong>in</strong>g area called the Gik<strong>on</strong>do- Nyabugogo wetland. The fac<strong>to</strong>ries, as well asthe densely populated homesteads located <strong>on</strong> the adjacent hill slopes, have no proper liquid-wastedisposal systems, and c<strong>on</strong>sequently pollute soils, groundwater and the surface water andatmosphere. Many of the fac<strong>to</strong>ries use out-dated technologies that are associated <strong>with</strong> energydemands and waste generati<strong>on</strong> <strong>to</strong> levels that have adverse impact <strong>on</strong> the envir<strong>on</strong>ment, and renderthe operati<strong>on</strong>s expensive and unsusta<strong>in</strong>able (<strong>REMA</strong>, 2009).For this <str<strong>on</strong>g>study</str<strong>on</strong>g>, list and names of <strong>in</strong>dustries as highly air pollut<strong>in</strong>g source <strong>in</strong> urban areas will beacquired from the M<strong>in</strong>istry of Commerce and Tourism (MINICOM). These <strong>in</strong>dustries will be
39categorized for example as <strong>in</strong>tegrated ir<strong>on</strong> and steel, thermal power plants, copper/z<strong>in</strong>c/ alum<strong>in</strong>iumsmelters, cement, oil ref<strong>in</strong>eries, petrochemicals, pesticides and fertiliser units...etc. The level ofpolluti<strong>on</strong> will be assed terms of type and quantity of emitted pollutants and hav<strong>in</strong>g polluti<strong>on</strong> c<strong>on</strong>trolfacilities <strong>to</strong> comply <strong>with</strong> the standards. The geographic coord<strong>in</strong>ates of each <strong>in</strong>dustry will be takenus<strong>in</strong>g the GPS 3 device <strong>in</strong> order <strong>to</strong> show their locati<strong>on</strong> and spatial distributi<strong>on</strong> <strong>with</strong><strong>in</strong> <strong>Kigali</strong> City.5.5. Increase <strong>in</strong> number of vehiclesAlmost all cities have changed <strong>to</strong> mo<strong>to</strong>rized road vehicles, which has <strong>in</strong>creased the use of fossilfuels and <strong>in</strong>creased greenhouse-gas emissi<strong>on</strong>s. This explosive growth <strong>in</strong> the number of roadvehicles is a big problem <strong>in</strong> many cities. Many city centers have major difficulties try<strong>in</strong>g <strong>to</strong> cope <strong>with</strong>the chaotic au<strong>to</strong>mobile traffic. The traffic jams are extremely bad <strong>in</strong> many cities and transport traffic<strong>in</strong> the city area at least dur<strong>in</strong>g the rush-hours is really slow. The polluti<strong>on</strong> is high due <strong>to</strong> c<strong>on</strong>stanttraffic and causes respira<strong>to</strong>ry diseases <strong>to</strong> city habitants (UNCHS, 1996)The need for <strong>in</strong>creased transport of people, materials, goods and products <strong>to</strong>gether <strong>with</strong> ris<strong>in</strong>g<strong>in</strong>come levels and the desire for pers<strong>on</strong>al mobility have also led <strong>to</strong> a rapid <strong>in</strong>crease <strong>in</strong> mo<strong>to</strong>r vehicleownership <strong>in</strong> <strong>Kigali</strong> City. C<strong>on</strong>comitantly <strong>with</strong> this <strong>in</strong>crease <strong>in</strong> the number of mo<strong>to</strong>r vehicles, thecombusti<strong>on</strong> of fossil fuels has <strong>in</strong>creased substantially, as has the release of gaseous pollutants andparticulates. From literature, it was estimated that mo<strong>to</strong>r vehicles account for more air polluti<strong>on</strong>than any other s<strong>in</strong>gle human activity. For example, more than half of the global emissi<strong>on</strong>s ofcarb<strong>on</strong> m<strong>on</strong>oxide, hydrocarb<strong>on</strong>s and nitrogen oxides from fossil fuel combusti<strong>on</strong> derive fromau<strong>to</strong>mobiles, both gasol<strong>in</strong>e- and diesel-powered, and the proporti<strong>on</strong>s may be significantly higher <strong>in</strong>city centres. Transport-associated emissi<strong>on</strong>s affect the state of the envir<strong>on</strong>ment by <strong>in</strong>creas<strong>in</strong>g airpolluti<strong>on</strong> levels, particularly carb<strong>on</strong> m<strong>on</strong>oxide, volatile organic compounds, hydrocarb<strong>on</strong>s, nitrogenoxides, oz<strong>on</strong>e and lead, as well as dust and particles. Diseases and ill-health effects associated<strong>with</strong> transport <strong>in</strong>clude chr<strong>on</strong>ic respira<strong>to</strong>ry illness, asthma, reduced lung functi<strong>on</strong>, cancer and heartdisease, which might be caused or exacerbated by air polluti<strong>on</strong>. Benzene and polyaromatichydrocarb<strong>on</strong>s from car exhausts and leaked oil and lubricants are recognized carc<strong>in</strong>ogens, as areasbes<strong>to</strong>s fibres (v<strong>on</strong> Schirnd<strong>in</strong>, 2002) .3 Global Positi<strong>on</strong><strong>in</strong>g System
41F<strong>in</strong>e particulates( PM10; PM2.5)CFCS and HCFCLeadSource:Inhaleable particles.A class of durablechemicals.Element used <strong>in</strong> olderfuel additives.Tailpipes, brakel<strong>in</strong><strong>in</strong>g, road dust, etc.<strong>Air</strong> c<strong>on</strong>diti<strong>on</strong>ers and<strong>in</strong>dustrial activities.Fuel additives andbatteries.Human health, aesthetics.Oz<strong>on</strong>e depleti<strong>on</strong>,climate changeHuman health,ecological damagesLocal andRegi<strong>on</strong>alIn <strong>Rwanda</strong>, the number of cars and mo<strong>to</strong>rs are <strong>in</strong>creas<strong>in</strong>g c<strong>on</strong>siderably. The follow<strong>in</strong>g table showsdifferent figures of registered vehicles by category dur<strong>in</strong>g the period from: 2005-2009. The polluti<strong>on</strong>emissi<strong>on</strong>s of different gases also <strong>in</strong>crease accord<strong>in</strong>g <strong>to</strong> the numbers of mo<strong>to</strong>rs vehicles.Transportati<strong>on</strong> is a major c<strong>on</strong>tribu<strong>to</strong>r of many air pollutants. These shares are even higher <strong>in</strong>certa<strong>in</strong> circumstances, such as <strong>in</strong> cities, al<strong>on</strong>g major roads and <strong>in</strong> tunnels.Table 5: Number of registered vehicles by categoryCategory BeforeCum. atCum. at2005 2005 2006 2007 2008 2008 2009 2009Bus 70 15 16 46 91 238 27 265GlobalCar 8,526 1,796 889 1,805 1,922 14,938 1,372 16,310Half- trailer 66 13 12 12 23 126 38 164Jeep 4,381 1,793 676 1,032 1,327 9,209 1,236 10,445Microbus 63 7 2 13 15 100 26 126M<strong>in</strong>ibus 2,687 724 279 212 657 4,559 193 4,752Mo<strong>to</strong>rcycle 7,243 4,913 3,571 5,374 7,818 28,919 4,714 33,633Pick up 5,747 1,497 859 1,290 1,225 10,618 818 11,436Special eng<strong>in</strong>e 59 26 14 83 62 244 86 330Trailer 334 56 68 120 49 627 43 670Truck 1,374 276 171 301 198 2,320 186 2,506Unknown 0 0 1 1 1 3 2 5Total 30,550 11,116 6,558 10,289 13,388 71,901 8,741 80,642Local
42A simple representati<strong>on</strong> of the trend show<strong>in</strong>g the <strong>in</strong>creas<strong>in</strong>g of number of vehicles per categories.Figure: Number of registered vehicles per year
Figure: Cumulative number of vehicles categories43
445.6. From vehicular growth <strong>to</strong> <strong>in</strong>crease of air polluti<strong>on</strong>Translat<strong>in</strong>g numbers of vehicles <strong>to</strong> gross emissi<strong>on</strong>s of pollutants requires the development ofrepresentative values, called emissi<strong>on</strong> fac<strong>to</strong>rs that for each vehicle category relate the quantity of apollutant released <strong>in</strong><strong>to</strong> the atmosphere <strong>to</strong> the level of activity associated <strong>with</strong> each vehicle type. AnEemissi<strong>on</strong> fac<strong>to</strong>r F can be def<strong>in</strong>ed as F where E is the amount of pollutant released (<strong>in</strong>Agrams) and A is the level of activity, typically measured <strong>in</strong> kilometers driven. The emissi<strong>on</strong> fac<strong>to</strong>r,F, depends <strong>on</strong> a number of variables, such as the <strong>in</strong>tr<strong>in</strong>sic nature of the technology; the power ofthe vehicle; and vehicle operat<strong>in</strong>g c<strong>on</strong>diti<strong>on</strong>s, <strong>in</strong>clud<strong>in</strong>g eng<strong>in</strong>e temperature, vehicle speed, ambienttemperature, deteriorati<strong>on</strong> from age and usage, quality of ma<strong>in</strong>tenance, and the quality of the fuel.For all these reas<strong>on</strong>s, emissi<strong>on</strong> fac<strong>to</strong>rs <strong>with</strong><strong>in</strong> vehicle categories are subject <strong>to</strong> a good deal ofvariability. Emissi<strong>on</strong> fac<strong>to</strong>rs are typically developed for each vehicle type, and an assessment ofthe variability must be performed <strong>to</strong> derive a range of values for emissi<strong>on</strong>s under differen<strong>to</strong>perat<strong>in</strong>g c<strong>on</strong>diti<strong>on</strong>s. Typically, emissi<strong>on</strong> fac<strong>to</strong>rs are reported for a set of ideal c<strong>on</strong>diti<strong>on</strong>s.(Examples: for a particular speed, operat<strong>in</strong>g temperature, and vehicular age) and <strong>with</strong> correcti<strong>on</strong>fac<strong>to</strong>rs that can be used <strong>to</strong> extrapolate <strong>to</strong> other operat<strong>in</strong>g c<strong>on</strong>diti<strong>on</strong>s).There are several reas<strong>on</strong>s <strong>to</strong> expect large emissi<strong>on</strong>s for vehicles such <strong>in</strong>clud<strong>in</strong>g ma<strong>in</strong>tenance ofvehicles, average traffic speeds. From experience, it has been observed that slower speeds (
45Figure 7: Vehicles emissi<strong>on</strong> by speedFigure 8: Transport <strong>Air</strong> polluti<strong>on</strong> shares <strong>in</strong> 2004Source:Another key issue <strong>in</strong> the derivati<strong>on</strong> of emissi<strong>on</strong> fac<strong>to</strong>rs is the quality of fuel used. In manydeveloped countries of the world, the quality of fuel, especially adulterati<strong>on</strong> of gasol<strong>in</strong>e by
46kerosene, is a particularly important, if understudied, issue. This problem is almost universalam<strong>on</strong>g mo<strong>to</strong>rized three-wheeled vehicles (au<strong>to</strong>-rickshaws), which for the most part are not ownedby their opera<strong>to</strong>rs. Kerosene is heavily subsidized because it is seen as an important fuel forhousehold cook<strong>in</strong>g for lower-<strong>in</strong>come groups. S<strong>in</strong>ce the price of gasol<strong>in</strong>e per liter exceeds that ofkerosene by a fac<strong>to</strong>r of five, au<strong>to</strong>-rickshaw opera<strong>to</strong>rs typically adulterate their gasol<strong>in</strong>e fuel <strong>with</strong> asmuch as 30% kerosene.Emissi<strong>on</strong>s of major pollutants depend <strong>on</strong> emissi<strong>on</strong> fac<strong>to</strong>rs and levels of usage of different vehicles.Annual emissi<strong>on</strong>s from a category of vehicle can be calculated, as shown <strong>in</strong> the above formula, bymultiply<strong>in</strong>g the emissi<strong>on</strong> fac<strong>to</strong>r provided by the annual usage (<strong>in</strong> kilometers) for that category. <strong>Air</strong>polluti<strong>on</strong> is <strong>in</strong>creas<strong>in</strong>g when the number of vehicles is <strong>in</strong>creas<strong>in</strong>g. The follow<strong>in</strong>g table shows theestimated emissi<strong>on</strong> values of different gases dur<strong>in</strong>g the period of 2009-2011<strong>in</strong> ppmTable 6 : <strong>Air</strong> polluti<strong>on</strong> emissi<strong>on</strong> <strong>in</strong> ppmEmissi<strong>on</strong> CO CO 2 NO NO 2 NO x O 3 SO 2From 5491.65985 - 3535.841058 7601.142476 10827.57025 419053.4661 4776.7029June20092010 12133.69927 - 379.6039 0 290.6327 624917.8182 6005.228967January-February2011Source:1469.3932 - 0 0 0 70580.66068 283.26692875.7. <strong>Air</strong> polluti<strong>on</strong>: a grow<strong>in</strong>g problem <strong>in</strong> <strong>Kigali</strong><strong>Air</strong> polluti<strong>on</strong> is a grow<strong>in</strong>g problem <strong>in</strong> urban areas <strong>in</strong> <strong>Rwanda</strong>. The major source of air polluti<strong>on</strong> arefor example the transport sec<strong>to</strong>r <strong>with</strong> 52% of imported petroleum product and used vehicles,manufactur<strong>in</strong>g <strong>in</strong>dustries such cement, and steel mils, agriculture and lives<strong>to</strong>ck activities <strong>in</strong>clud<strong>in</strong>gpesticides, mach<strong>in</strong>ery and manure; and m<strong>in</strong><strong>in</strong>g activities which are c<strong>on</strong>tribut<strong>in</strong>g <strong>to</strong> the emissi<strong>on</strong> ofdusty. Due <strong>to</strong> the lack of adequate data and <strong>in</strong>formati<strong>on</strong> <strong>to</strong> <strong>in</strong>form decisi<strong>on</strong> maker, the magnitude ofair polluti<strong>on</strong> <strong>in</strong> <strong>Rwanda</strong> may currently not be seen as serious problem. However, if proactive and<strong>in</strong>tegrated approach is not taken immediately <strong>in</strong> address<strong>in</strong>g the air polluti<strong>on</strong> problem, the problem
47is already serious from the fewer studies d<strong>on</strong>e. Moreover, the air polluti<strong>on</strong> is not easy <strong>to</strong> detect <strong>in</strong><strong>Rwanda</strong> because the country d<strong>on</strong>'t have so far the suitable equipments (Barigye, 2009).For <strong>in</strong>stance, the urban air polluti<strong>on</strong> is grow<strong>in</strong>g as ec<strong>on</strong>omic development drive of <strong>Rwanda</strong><strong>in</strong>creases combusti<strong>on</strong> of the fossil fuel for <strong>in</strong>dustrial processes and transportati<strong>on</strong>. <strong>Kigali</strong> City, thecapital of <strong>Rwanda</strong>, is built <strong>in</strong> hilly country sprawl<strong>in</strong>g across about 4 ridges and the valleys <strong>in</strong>between. The <strong>to</strong>ps of the ridges have an average elevati<strong>on</strong> of 1,600 meters while the valleys arearound 1,300 meters. The city is almost r<strong>in</strong>ged by higher hills, the highest of which is Mount <strong>Kigali</strong>,<strong>with</strong> an elevati<strong>on</strong> of 1,850 meters above sea level. Because of the high altitude, <strong>Kigali</strong> has apleasant tropical highland climate. Temperatures range from 20°C <strong>to</strong> 21.6°C year round. There arefour seas<strong>on</strong>s: L<strong>on</strong>g ra<strong>in</strong>s from mid-March <strong>to</strong> mid-May, short ra<strong>in</strong>s from mid-September <strong>to</strong> mid-December; a l<strong>on</strong>g dry period from mid-May <strong>to</strong> mid-September; and a short dry seas<strong>on</strong> from mid-December <strong>to</strong> mid-March. Average annual precipitati<strong>on</strong> is 900 mm.The <strong>in</strong>crease of populati<strong>on</strong> <strong>in</strong> <strong>Kigali</strong> City was accompanied by an <strong>in</strong>crease of the number ofvehicles, which could adversely affect the quality of air <strong>in</strong> the city. Other fac<strong>to</strong>rs that may c<strong>on</strong>tribute<strong>to</strong> worsen the air quality <strong>in</strong>clude polluti<strong>on</strong> from <strong>in</strong>dustries, domestic cook<strong>in</strong>g, soil blown dust andwaste combusti<strong>on</strong> (Ingabire, 2009). Dur<strong>in</strong>g the dry seas<strong>on</strong>, the c<strong>on</strong>centrati<strong>on</strong> of ground-level oz<strong>on</strong>eis already bey<strong>on</strong>d the major envir<strong>on</strong>mental standards, and the problem of air polluti<strong>on</strong> is already atpresent (Mi<strong>to</strong>, 2010). Therefore, comprehensive measures must be taken <strong>to</strong> tackle <strong>with</strong> this issue.For example, <strong>in</strong>stallati<strong>on</strong> of an <strong>in</strong>specti<strong>on</strong> system <strong>on</strong> mo<strong>to</strong>r vehicle exhaust, establishment ofregulati<strong>on</strong>s <strong>on</strong> car emissi<strong>on</strong> and air polluti<strong>on</strong> envir<strong>on</strong>mental standards, tax <strong>in</strong>centive <strong>in</strong>troducti<strong>on</strong> forimportati<strong>on</strong> of envir<strong>on</strong>mentally friendly cars, re<strong>in</strong>forcement of air polluti<strong>on</strong> m<strong>on</strong>i<strong>to</strong>r<strong>in</strong>g system wouldbe essential.5.7.1. Combusti<strong>on</strong> sourcesBy combusti<strong>on</strong> sources is meant operati<strong>on</strong>s where primarily fossil fuels, coal, natural gas, petrol,diesel and furnace oil are burnt <strong>to</strong> obta<strong>in</strong> energy. This <strong>in</strong>cludes power plants, <strong>in</strong>dustrial boilers, andau<strong>to</strong>mobiles. Thermal power plants are major sources of SPM, SO2 and NOx. Depend<strong>in</strong>g <strong>on</strong> thetype of used fuel, the emissi<strong>on</strong> of <strong>on</strong>e or more of these pollutants may be of envir<strong>on</strong>mentalsignificance.
48Nitrogen Oxides formed <strong>in</strong> combusti<strong>on</strong> processes are usually due <strong>to</strong> either thermal fixati<strong>on</strong> ofatmospheric nitrogen <strong>in</strong> combusti<strong>on</strong> air or <strong>to</strong> the c<strong>on</strong>versi<strong>on</strong> of chemically bound nitrogen <strong>in</strong> thefuel. Thermal fixati<strong>on</strong> occurs when combusti<strong>on</strong> temperature is above 1600°C. For natural gas anddistillate oil nearly all NO results from thermal fixati<strong>on</strong>. For residue oil and coal, the c<strong>on</strong>tributi<strong>on</strong> <strong>to</strong>NO emissi<strong>on</strong> from fuel bound nitrogen may be significant. The c<strong>on</strong>centrati<strong>on</strong> of NOx formed<strong>in</strong>creases <strong>with</strong> <strong>in</strong>crease <strong>in</strong> excess oxygen ma<strong>in</strong>ta<strong>in</strong>ed <strong>in</strong> the combusti<strong>on</strong> process and <strong>with</strong> the<strong>in</strong>crease <strong>in</strong> temperature of the furnace.<strong>Rwanda</strong> has <strong>on</strong>e of the lowest emissi<strong>on</strong>s per capita <strong>in</strong> the world, estimated at 0.65 t<strong>on</strong>nesCO2/pers<strong>on</strong> (<strong>in</strong>clud<strong>in</strong>g land use change), compared <strong>to</strong> a global average of 4.63 t<strong>on</strong>nes CO2/pers<strong>on</strong>.In January 2010 the GoR submitted its Sec<strong>on</strong>d Nati<strong>on</strong>al Communicati<strong>on</strong> (SNC) <strong>to</strong> the UNFCCC<strong>with</strong> a GHG emissi<strong>on</strong>s <strong>in</strong>ven<strong>to</strong>ry for the <strong>reference</strong> year, 2005 (Table 1.1). The majority of GHGemissi<strong>on</strong>s were CO2 (87%) at 531 Gg, dom<strong>in</strong>ated by transport (52%) and <strong>in</strong>dustrial processes(28.5%). Total CO2 sequestrati<strong>on</strong> was 9,000 Gg and land use change (c<strong>on</strong>versi<strong>on</strong> of forests andgrasslands) was -545 Gg mak<strong>in</strong>g <strong>Rwanda</strong> a net carb<strong>on</strong> s<strong>in</strong>k. CO2 emissi<strong>on</strong>s from biomass andbunkers (aviati<strong>on</strong>) were 7,228 Gg and 17 Gg respectively but are memo items <strong>on</strong>ly. The aggregateemissi<strong>on</strong>s or <strong>to</strong>tal CO2 equivalent, used for measur<strong>in</strong>g global warm<strong>in</strong>g potential, amounted <strong>to</strong>5,010.4 Gg <strong>in</strong> 2005, dom<strong>in</strong>ated by agriculture (78%) and energy (18%). Nitrous oxide (N2O) andmethane (CH4) are the most potent greenhouse gases c<strong>on</strong>tribut<strong>in</strong>g 62% and 26% of aggregatedemissi<strong>on</strong>s. Four key sources c<strong>on</strong>tribute 91% of aggregate emissi<strong>on</strong>s: N2O from agricultural soils(57%); CH4 from enteric fermentati<strong>on</strong> <strong>in</strong> domestic lives<strong>to</strong>ck (19%); CH4 from residential energy fromfuel; combusti<strong>on</strong> (8%); CO2 from road vehicles (5%) (Byamukama et al., 2011).Table 7: Greenhouse Gas emissi<strong>on</strong>s <strong>in</strong> <strong>Rwanda</strong>Greenhouse Gas SourcesCO2CH4N2ONOxNOxNMVOCsSOxCO2 eqGgGgGgGgGgGgGgGgTotal Nati<strong>on</strong>al Emissi<strong>on</strong>s 531 71 10 14 2,327 42 18 5,010Energy (fuel combusti<strong>on</strong>) 380 20 0 14 361 42 18 891,3Energy Industries45 - 0 0 0 0 0 -(petroleum)
49Manufactur<strong>in</strong>g <strong>in</strong>dustries28 - 0 0 0 0 1 -and c<strong>on</strong>structi<strong>on</strong>Transport 274 - 0 7 17 3 0 -Other (residential - biomass) 34 20 0 7 344 38 17 -Industrial processes (cement151 - 0 0 0 0 150,5and lime producti<strong>on</strong>)Agriculture - 49 10 0 9 0 0 3909,9Land-use change and0 0 0 0 1957 0 0 10,9forestry (LULUCF)Waste (disposal and handl<strong>in</strong>g) 3 - 0 0 0 0 47,25Source: Byamukama (2011)5.7.2. Transport and au<strong>to</strong>mobileTransport plays a fundamental role <strong>in</strong> the lives of societies and <strong>in</strong>dividuals: how people <strong>in</strong>teract,work, play, organize producti<strong>on</strong>, develop cities, and get access <strong>to</strong> services, amenities and goods is<strong>in</strong>extricably l<strong>in</strong>ked <strong>with</strong> the development of mobility and the choices people make about it. Insocieties that rely heavily and <strong>in</strong>creas<strong>in</strong>gly <strong>on</strong> private mo<strong>to</strong>rized transport, vehicles are expected <strong>to</strong>become safer, more luxurious and powerful, and <strong>to</strong> be driven more frequently. These expectati<strong>on</strong>s,however, often do not take account of the ensu<strong>in</strong>g c<strong>on</strong>sequences: <strong>in</strong>creased fuel c<strong>on</strong>sumpti<strong>on</strong>,greater emissi<strong>on</strong>s of air pollutants and greater exposure of people <strong>to</strong> hazardous polluti<strong>on</strong> thatcauses serious health problems (Krzyzanowski et al., 2005).
Milli<strong>on</strong> litres imported50<strong>Rwanda</strong> has an extremely small number of road transport vehicles, <strong>with</strong> <strong>on</strong>ly 75,000 registered<strong>to</strong>tal vehicles (vehicles recorded s<strong>in</strong>ce 2001 <strong>to</strong> 2009), of which over 30,000 were mo<strong>to</strong>rcycles. Thiswas equivalent <strong>to</strong> around 8 vehicles per thousand people (note other sources have slightly differentvehicle numbers) (Watkiss et al., 2009). <strong>Rwanda</strong>’s transport sec<strong>to</strong>r is entirely dependent <strong>on</strong>imported fuel and c<strong>on</strong>sumes approximately 75% of all the country's imported petroleum products.Gasol<strong>in</strong>e and diesel predom<strong>in</strong>ate, and 167 milli<strong>on</strong> liters were c<strong>on</strong>sumed <strong>in</strong> 2008. Demand isforecast <strong>to</strong> grow at around 10% per annum until 2020. Imports of petroleum products c<strong>on</strong>stitutearound 25% of the <strong>to</strong>tal import value of the nati<strong>on</strong>al ec<strong>on</strong>omy. Diesel c<strong>on</strong>sumpti<strong>on</strong> is about 38%higher than gasol<strong>in</strong>e. Around 52% of diesel imports are dedicated <strong>to</strong> the transport sec<strong>to</strong>r, <strong>with</strong> therest used for electricity generati<strong>on</strong> (GTZ, 2011).Table 8: Petroleum product import <strong>in</strong> <strong>Rwanda</strong> between 2004 and 200712010080PremiumDieselKerosene60402002004 2005 2006 2007Source: (Watkiss et al., 2009)<strong>Rwanda</strong> Visi<strong>on</strong> 2020 estimates that petroleum product c<strong>on</strong>sumpti<strong>on</strong> will <strong>in</strong>crease by > 10% perannum. It will therefore be an <strong>in</strong>creas<strong>in</strong>g source of CO2 (Government of <strong>Rwanda</strong>, 2008). Theseestimates have been used by Watkiss et al.,(2009) <strong>to</strong> project petroleum product emissi<strong>on</strong>s <strong>in</strong><strong>Rwanda</strong> as shown below.
G g C O2 eq51Figure 9: CO2 from c<strong>on</strong>sumpti<strong>on</strong> petroleum products <strong>in</strong> <strong>Rwanda</strong> (estimate <strong>on</strong>ly)250020001500LP GF urnace oil and HF OK eroseneJ et fuelDieselGasol<strong>in</strong>e100050002003 2004 2005 2006 2007 2008 2009 2010 2011 2012 2013 2014 2015 2016 2017 2018 2019 2020Source: (Watkiss et al., 2009)As shown <strong>in</strong> the above figure, the ma<strong>in</strong> driver for the growth of CO2 is <strong>in</strong>creased petrol and diesel.Low carb<strong>on</strong> opti<strong>on</strong>s would therefore have benefits <strong>in</strong> reduc<strong>in</strong>g the potential future problem of airquality especially <strong>in</strong> <strong>Kigali</strong> City. There is also wider transport issues associated <strong>with</strong> str<strong>on</strong>g<strong>in</strong>creases <strong>in</strong> transport demand, notably urban c<strong>on</strong>gesti<strong>on</strong>. Accord<strong>in</strong>g <strong>to</strong> Watkiss et al., (2009),there is so far no low carb<strong>on</strong> plan for the transport sec<strong>to</strong>r currently for <strong>Rwanda</strong>. The <strong>in</strong>creas<strong>in</strong>gnumber of mo<strong>to</strong>r vehicles <strong>in</strong> <strong>Rwanda</strong> and particularly <strong>in</strong> <strong>Kigali</strong> may be <strong>on</strong>e source of <strong>to</strong>xic airpolluti<strong>on</strong>. Children are more vulnerable <strong>to</strong> the impacts of <strong>to</strong>xic air polluti<strong>on</strong> because their bodies arestill develop<strong>in</strong>g. Traffic polluti<strong>on</strong> may also a cause of ris<strong>in</strong>g asthma rates.
Number of Vehicles52Figure 10: Evoluti<strong>on</strong> of vehicles imported <strong>in</strong> <strong>Rwanda</strong> between 2001 and 2010Evoluti<strong>on</strong> of Vehicles Imported <strong>in</strong> <strong>Rwanda</strong> from 2001 <strong>to</strong> 201060005000400030002000100002001 2002 2003 2004 2005 2006 2007 2008 2009 2010Number of Vehicles 2267 3540 2149 2632 2793 2555 4474 5249 3741 3098Source: <strong>Rwanda</strong> Revenue Authority, 2010However, the recently published energy policy has objectives regard<strong>in</strong>g the lower carb<strong>on</strong> <strong>in</strong> thefuture, as follow: (i) promote energy c<strong>on</strong>servati<strong>on</strong> and efficiency through encourag<strong>in</strong>g properma<strong>in</strong>tenance of vehicles and good driv<strong>in</strong>g practices; (ii) programmes have <strong>to</strong> be <strong>in</strong>troduced <strong>to</strong>ensure proper ma<strong>in</strong>tenance of vehicles and fuel-efficient driv<strong>in</strong>g practices should become the norm<strong>in</strong> <strong>Rwanda</strong>; (iii) encourage the development of affordable and well run mass transport systems sothat the proliferati<strong>on</strong> of <strong>in</strong>dividual goods and passenger vehicles is reduced; (iv) reduce polluti<strong>on</strong> byencourag<strong>in</strong>g the use of envir<strong>on</strong>mentally friendly fossil fuels such as unleaded petrol and lowsulphur diesel; and (vi) encourage research <strong>in</strong><strong>to</strong> alternative fuels for transport purposes, such asethanol, methanol and biodiesel(MININFRA, 2009b)There are close <strong>in</strong>teracti<strong>on</strong>s between almost all forms of energy use and the natural and humanenvir<strong>on</strong>ment. The Nati<strong>on</strong>al Energy Policy and Nati<strong>on</strong>al Energy Strategy statements <strong>in</strong> this regardare as follow: (i) <strong>Rwanda</strong> am committed <strong>to</strong> mitigat<strong>in</strong>g the adverse impacts of traditi<strong>on</strong>al energysupply cha<strong>in</strong>s and <strong>to</strong> develop<strong>in</strong>g and dissem<strong>in</strong>at<strong>in</strong>g envir<strong>on</strong>mentally friendly energy technologies.(ii) Comprehensive envir<strong>on</strong>mental standards are <strong>to</strong> be set and strictly enforced for all levels of thepetroleum sec<strong>to</strong>r. (iii) Wherever possible, development of envir<strong>on</strong>mentally sound energy is <strong>to</strong> besupported through access<strong>in</strong>g <strong>in</strong>ternati<strong>on</strong>ally marketable carb<strong>on</strong> credits through the Clean
53Development Mechanism (CDM) or through the voluntary carb<strong>on</strong> emissi<strong>on</strong>s market. Applicati<strong>on</strong>sshould be made <strong>to</strong> obta<strong>in</strong> Certified Emissi<strong>on</strong>s Reducti<strong>on</strong>s (CERs) which require that projectpromoters can dem<strong>on</strong>strate “additi<strong>on</strong>ality”, so that the planned reducti<strong>on</strong>s would not occur <strong>with</strong>outthe additi<strong>on</strong>al <strong>in</strong>centive provided by emissi<strong>on</strong> reducti<strong>on</strong>s credits. In other cases, Verified Emissi<strong>on</strong>sReducti<strong>on</strong>s (VERs) should be pursued, us<strong>in</strong>g <strong>in</strong>ternati<strong>on</strong>ally recognized standards such as theGold Standard <strong>on</strong> the Voluntary Carb<strong>on</strong> Standard <strong>to</strong> enhance their value <strong>in</strong> voluntary carb<strong>on</strong>market. The proceeds from VERs will be <strong>in</strong>vested by government <strong>in</strong> further renewable andsusta<strong>in</strong>able energy projects.F<strong>in</strong>ally, through the Capacity Build<strong>in</strong>g and Transacti<strong>on</strong>s Support project, Government of <strong>Rwanda</strong> isdevelop<strong>in</strong>g the capability <strong>to</strong> evaluate proposals for carb<strong>on</strong> credit projects and ensure that <strong>Rwanda</strong>maximizes the benefits that can be derived from the CDM programme and voluntary carb<strong>on</strong> market(MININFRA, 2009b p.16) .Transport represents the fastest growth source of emissi<strong>on</strong>s, and is a key issue <strong>in</strong> <strong>Rwanda</strong>because of grow<strong>in</strong>g urbanisati<strong>on</strong>. However, it is the hardest of all sec<strong>to</strong>rs <strong>to</strong> advance low carb<strong>on</strong>opti<strong>on</strong>s and usually the least cost-effective (i.e. the highest marg<strong>in</strong>al cost per t<strong>on</strong>ne CO2 abated).Avoid<strong>in</strong>g the future growth from this sec<strong>to</strong>r seems <strong>to</strong> be challeng<strong>in</strong>g. Policies <strong>to</strong> address transportalso have high political barriers, because policies are often unpopular, and may have somec<strong>on</strong>sequences (for the poor). Opti<strong>on</strong>s can be broadly categorized as follows: vehicle efficiencyimprovement e.g. newer vehicles; advanced technologies; demand side measures e.g. behaviouralchange; Fuel switch<strong>in</strong>g e.g. biofuels; and modal shift e.g. private <strong>to</strong> public transport systems(Watkiss et al., 2009).Even if transport accounts for the majority of petroleum products and then <strong>in</strong> combusti<strong>on</strong> emissi<strong>on</strong>s<strong>in</strong> <strong>Rwanda</strong> (MININFRA, 2004), the urbanized populati<strong>on</strong> is however is still at low level(approximately 16%), and therefore the localized c<strong>on</strong>centrati<strong>on</strong>s of transport emissi<strong>on</strong>s at countrylevel may not yet c<strong>on</strong>tribute significantly <strong>to</strong> health externalities compared <strong>with</strong> <strong>in</strong>door air polluti<strong>on</strong>from biomass burn<strong>in</strong>g.
545.7.3. Industrial sourcesIndustries emit a wide variety of process-specific pollutants gaseous organic and <strong>in</strong>organiccompounds, complex vapors that undergo phase transformati<strong>on</strong> after emissi<strong>on</strong> <strong>in</strong><strong>to</strong> theatmosphere, <strong>with</strong> process-specific compositi<strong>on</strong> such as heavy metals. As <strong>in</strong>dustries are c<strong>on</strong>sum<strong>in</strong>glots of fossil fuels, the c<strong>on</strong>sumpti<strong>on</strong> of these fuels elim<strong>in</strong>ates <strong>in</strong> the atmosphere pollutantsubstances c<strong>on</strong>ta<strong>in</strong><strong>in</strong>g carb<strong>on</strong>, sulphur and nitrogen. The two sources of air polluti<strong>on</strong> that can bediscussed here comprise for example the cement manufacture and sulphuric acid manufacture.From the cement manufactur<strong>in</strong>g po<strong>in</strong>ts, raw materials <strong>in</strong>clude lime, silica, alum<strong>in</strong>um and ir<strong>on</strong>. Limeis obta<strong>in</strong>ed from calcium carb<strong>on</strong>ate. Other raw materials are <strong>in</strong>troduced as sand, clay, shale, ir<strong>on</strong>and blast furnace slag. The process c<strong>on</strong>sists of m<strong>in</strong><strong>in</strong>g, crush<strong>in</strong>g, gr<strong>in</strong>d<strong>in</strong>g, and calc<strong>in</strong><strong>in</strong>g <strong>in</strong> a l<strong>on</strong>gcyl<strong>in</strong>drically shaped oven. <strong>Air</strong> pollutants can orig<strong>in</strong>ate at several operati<strong>on</strong>s of cement fac<strong>to</strong>ries aslisted below.Table 9: <strong>Air</strong> pollutant sources <strong>in</strong> cement fac<strong>to</strong>ryPollutantsRaw material crush<strong>in</strong>g and gr<strong>in</strong>d<strong>in</strong>gOven operati<strong>on</strong> and cool<strong>in</strong>gProduct gr<strong>in</strong>d<strong>in</strong>g and packag<strong>in</strong>gEmissi<strong>on</strong>sParticulatesParticulates, CO, SO 2 ,NOx, HCParticulatesSource: UNEP, 2004The c<strong>on</strong>trol of emissi<strong>on</strong> of particulate matter is ec<strong>on</strong>omically viable as the cost of collected dust(raw material and product) pays for c<strong>on</strong>trol measures. From the sulphuric acid manufacture po<strong>in</strong>ts,Sulphuric acid is produced from sulphur, which is burnt <strong>to</strong> obta<strong>in</strong> SO2. Sulphur dioxide is c<strong>on</strong>verted<strong>to</strong> trioxide <strong>in</strong> presence of vanadium pentaoxide catalyst. The sulphur trioxide is absorbed <strong>in</strong>recycl<strong>in</strong>g c<strong>on</strong>centrated sulfuric acid. Unreacted SO2 escapes <strong>with</strong> the flue gas. New large plantsnow a days use double c<strong>on</strong>versi<strong>on</strong> double absorpti<strong>on</strong> process realiz<strong>in</strong>g above 99 percent efficiency(UNEP, 2004).The current ec<strong>on</strong>omy of <strong>Rwanda</strong> is dom<strong>in</strong>ated by agriculture and services while the <strong>in</strong>dustry is stilla relatively small part. In the medium <strong>to</strong> l<strong>on</strong>g term, the service sec<strong>to</strong>r is the target for <strong>Rwanda</strong>’sec<strong>on</strong>omy. At present, manufactur<strong>in</strong>g dom<strong>in</strong>ates <strong>in</strong>dustrial output. The share of m<strong>in</strong><strong>in</strong>g and
55quarry<strong>in</strong>g <strong>in</strong> GDP is low (though important for exports). The largest <strong>in</strong>crease <strong>with</strong><strong>in</strong> <strong>in</strong>dustry hasbeen <strong>in</strong> c<strong>on</strong>structi<strong>on</strong>, which has grown from 36% <strong>to</strong> 46% of <strong>in</strong>dustrial output. This is partlygovernment <strong>in</strong>frastructure expenditure, and partly a private sec<strong>to</strong>r boom <strong>in</strong> residential c<strong>on</strong>structi<strong>on</strong>.The energy used <strong>in</strong> <strong>in</strong>dustry is captured <strong>in</strong> the early energy emissi<strong>on</strong>s. Due <strong>to</strong> his<strong>to</strong>ric poweroutages, an estimated 75% of <strong>Rwanda</strong>n firms have access <strong>to</strong> private genera<strong>to</strong>rs. An average of45% of these <strong>Rwanda</strong>n firms’ electricity comes from their genera<strong>to</strong>rs. The fertiliser plant us<strong>in</strong>g LakeKivu methane for urea producti<strong>on</strong> would also <strong>in</strong>crease <strong>in</strong>dustrial emissi<strong>on</strong>s, as would the potentialgas <strong>to</strong> liquid plant (Watkiss et al., 2009).The presence of a large number of small scale <strong>in</strong>dustrial plants makes polluti<strong>on</strong> c<strong>on</strong>trol moredifficult because small-scale operati<strong>on</strong>s are more f<strong>in</strong>ancially strapped and less technologicallycapable than large scale <strong>on</strong>es, and their numbers make the already lax m<strong>on</strong>i<strong>to</strong>r<strong>in</strong>g andenforcement of polluti<strong>on</strong> c<strong>on</strong>trol laws even more difficult. Criteri<strong>on</strong> pollutants (SOx, NOx, CO, CH4)that are released as a part of <strong>in</strong>dustrial combusti<strong>on</strong> may be quantified <strong>to</strong> the first order <strong>on</strong> the basisof overall estimates of fuel used and average emissi<strong>on</strong> fac<strong>to</strong>rs for various <strong>in</strong>dustrial activities.Determ<strong>in</strong>ati<strong>on</strong> of the levels of specific <strong>to</strong>xic substances released <strong>in</strong><strong>to</strong> the envir<strong>on</strong>ment, <strong>on</strong> the otherhand, requires plant-specific data for each <strong>to</strong>xic compound. C<strong>on</strong>structi<strong>on</strong> of <strong>in</strong>ven<strong>to</strong>ries for specificchemicals is a resource-<strong>in</strong>tensive and difficult activity ow<strong>in</strong>g <strong>to</strong> its process-specific nature.Particular emissi<strong>on</strong> from <strong>in</strong>dustrial combusti<strong>on</strong> of fossil fuels can be characterized.As policy resp<strong>on</strong>se <strong>to</strong> reduce air polluti<strong>on</strong> from <strong>in</strong>dustrial sources and fac<strong>to</strong>ries, the <strong>Rwanda</strong>Bureau of Standards (RBS) is <strong>to</strong> develop Nati<strong>on</strong>al <strong>Air</strong> Quality Standards that all <strong>in</strong>dustries shouldmeet. A list draft standards has recently been published by RBS <strong>in</strong>clud<strong>in</strong>g the <strong>Air</strong> Quality –Emissi<strong>on</strong>s <strong>to</strong> the <strong>Air</strong> by Cement Fac<strong>to</strong>ries Guidel<strong>in</strong>es and the <strong>Air</strong> Quality Tolerance Limits ofEmissi<strong>on</strong> Discharged <strong>to</strong> the <strong>Air</strong> by Fac<strong>to</strong>ries. The limits refer <strong>to</strong> the level of dust emissi<strong>on</strong> <strong>in</strong> thema<strong>in</strong> stack <strong>on</strong>ly of a given system <strong>in</strong> the Cement Fac<strong>to</strong>ries. Typically, these systems are rawgr<strong>in</strong>d<strong>in</strong>g, coal (or solid fuel) gr<strong>in</strong>d<strong>in</strong>g, cl<strong>in</strong>ker cooler, kiln (ma<strong>in</strong> stack), and cement gr<strong>in</strong>d<strong>in</strong>g. Undernormal operat<strong>in</strong>g c<strong>on</strong>diti<strong>on</strong>s where the design is appropriate and the equipment is properlyma<strong>in</strong>ta<strong>in</strong>ed and operated, the follow<strong>in</strong>g level of dust emissi<strong>on</strong> can be achieved (EAC, 2010a).
56Table 10: Level of dust emissi<strong>on</strong>Device Abbreviati<strong>on</strong> Emissi<strong>on</strong>(mg/Nm 3 )Multicl<strong>on</strong>e MLTC 2000Fabric filter – sheet type/mech. Rapp<strong>in</strong>g FF-sm 150Electrostatic precipita<strong>to</strong>r – lower efficiency EP-le 500Fabric filter – sleeve type/jet pulse clean<strong>in</strong>g FF-jp 50Electrostatic precipita<strong>to</strong>r – high efficiency Ep-he 50Source: East African Community 2010For example, if a plant has two cement gr<strong>in</strong>d<strong>in</strong>g systems, <strong>on</strong>e equipped <strong>with</strong> a FF-jp and the other<strong>with</strong> a FF-sm, the first system would have <strong>to</strong> comply <strong>with</strong> a dust emissi<strong>on</strong> limit of 50 mg/Nm 3 andthe sec<strong>on</strong>d, a limit of 150 mg/Nm 3 . For the latter, a grace period of up <strong>to</strong> <strong>on</strong>e year would be given<strong>to</strong> achieve the lower optimal limit.The proposed limits for Oxides of nitrogen (NOx) assume that: N<strong>on</strong>e uses fuel <strong>with</strong> high nitrogenc<strong>on</strong>tent, have or make use of modern abatement techniques such as flame cool<strong>in</strong>g, low-NOxburner, staged combusti<strong>on</strong> and selective n<strong>on</strong>-catalytic reducti<strong>on</strong> (SNCR). The immediate emissi<strong>on</strong>limit can be achieved by elim<strong>in</strong>at<strong>in</strong>g improper operat<strong>in</strong>g c<strong>on</strong>diti<strong>on</strong>s such as n<strong>on</strong>-uniform raw mealquality or feed, high excess air, over burn<strong>in</strong>g, damaged burner pipe, improper cooler sett<strong>in</strong>gs, etc.The sec<strong>on</strong>d level may require some <strong>in</strong>vestments such as modern fuel feed and fir<strong>in</strong>g system, newburner pipe, cl<strong>in</strong>ker cooler improvements, au<strong>to</strong>mati<strong>on</strong>, etc. Emissi<strong>on</strong> limits based <strong>on</strong> the use ofBest Available Technologies (BATs) as menti<strong>on</strong>ed above are not be<strong>in</strong>g c<strong>on</strong>sidered at this time.The proposed limits for sulfur dioxide (SO2) assume that: N<strong>on</strong>e uses raw material <strong>with</strong> highsulphur c<strong>on</strong>tent; n<strong>on</strong>e have or make use of modern abatement techniques such as absorbentadditi<strong>on</strong>, wet or dry scrubber, etc. As for NOx the first immediate limit is based <strong>on</strong> achiev<strong>in</strong>g properoperat<strong>in</strong>g c<strong>on</strong>diti<strong>on</strong>s. The lower limit is based primarily <strong>on</strong> the <strong>in</strong>stallati<strong>on</strong> of a high impulse/lowswirl burner. Emissi<strong>on</strong> limits based <strong>on</strong> the use of Best Available Technologies (BATs) asmenti<strong>on</strong>ed above are not be<strong>in</strong>g c<strong>on</strong>sidered at this time (EAC, 2010a).
575.7.4. Indoor air polluti<strong>on</strong>Fuel combusti<strong>on</strong> from domestic sources is a major cause of polluti<strong>on</strong> <strong>in</strong> many countries of theworld. Although health risks from these sources appear <strong>to</strong> be greatest <strong>in</strong> rural areas, there aresignificant emissi<strong>on</strong>s <strong>in</strong> cities as well. In additi<strong>on</strong> <strong>to</strong> ambient air polluti<strong>on</strong> associated <strong>with</strong> <strong>in</strong>dustryand transport, <strong>in</strong>door air polluti<strong>on</strong> (IAP) is becom<strong>in</strong>g an important problem <strong>in</strong> develop<strong>in</strong>g cities. IAPrefers <strong>to</strong> polluti<strong>on</strong>s from open fires for cook<strong>in</strong>g and heat<strong>in</strong>g. Smoke emissi<strong>on</strong>s from burn<strong>in</strong>g wood,coal, cattle dung, and other biomass fuels are a significant source of <strong>in</strong>door Particulate Matter (PM)<strong>in</strong> many cities, although these sources can also c<strong>on</strong>tribute <strong>to</strong> outdoor PM. The combusti<strong>on</strong> ofbiomass and coal is usually <strong>in</strong>complete and often occurs <strong>in</strong> simple s<strong>to</strong>ves, which are either smallpits or open clay boxes. The result<strong>in</strong>g emissi<strong>on</strong>s c<strong>on</strong>ta<strong>in</strong> large quantities of Particulate Matter,carb<strong>on</strong> m<strong>on</strong>oxide, and unburned hydrocarb<strong>on</strong>s. Emissi<strong>on</strong>s from biomass combusti<strong>on</strong> also c<strong>on</strong>ta<strong>in</strong>a large number of polyaromatic hydrocarb<strong>on</strong>s, such as benzoapyrene, that are mutagenic andcarc<strong>in</strong>ogenic. In additi<strong>on</strong> <strong>to</strong> these organic substances, coal and kerosene smoke also c<strong>on</strong>ta<strong>in</strong>s SOxand trace metals.Besides biomass, coal, kerosene, and liquefied petroleum gas (LPG) are the ma<strong>in</strong> fuels fordomestic uses such as cook<strong>in</strong>g and heat<strong>in</strong>g. From a health viewpo<strong>in</strong>t, however, it is the use ofsolid-biomass-based fuels that are burned <strong>in</strong>efficiently and vented <strong>in</strong> close proximity <strong>to</strong> people thatis the cause for greater c<strong>on</strong>cern. Household fuel usage is the key determ<strong>in</strong>ant of domestic airpolluti<strong>on</strong>, <strong>with</strong> fuels such as dung and wood that are lower <strong>on</strong> the “energy ladder” be<strong>in</strong>gsignificantly more pollut<strong>in</strong>g than modern clean-burn<strong>in</strong>g fuels such as LPG and electricity.Intermediate fuels such as kerosene are less pollut<strong>in</strong>g and more efficient than biomass-basedfuels. PM10 and other emissi<strong>on</strong>s from biomass fuels can be two or more orders of magnitudehigher than those for modern fuels for the same level of end-use energy provided. The use of moreefficient smokeless s<strong>to</strong>ves and better ventilati<strong>on</strong> mechanisms can reduce the levels of emissi<strong>on</strong>sand exposure. However, although improved s<strong>to</strong>ves help mitigate polluti<strong>on</strong> exposures, they do notelim<strong>in</strong>ate them. In the l<strong>on</strong>g term, <strong>on</strong>ly clean fuels can help elim<strong>in</strong>ate exposure.Indoor air polluti<strong>on</strong>, which is mostly ignored by the people affected by and government as well, hasa serious effect <strong>on</strong> the health of children as well as residents <strong>in</strong> the house. Accord<strong>in</strong>g <strong>to</strong> the WorldHealth Organizati<strong>on</strong> (WHO), worldwide IAP is resp<strong>on</strong>sible for about 1.6 milli<strong>on</strong> deaths a year,
58particularly of young children and women. Accord<strong>in</strong>g <strong>to</strong> a <str<strong>on</strong>g>study</str<strong>on</strong>g> undertaken by the universities ofHarvard and Berkeley, smoke from wood fires for cook<strong>in</strong>g will result <strong>in</strong> 10 milli<strong>on</strong> premature deaths<strong>in</strong> Africa by 2030. What is more, the poor are predom<strong>in</strong>antly affected, as they are more reliant <strong>on</strong>biomass energy sources. A <str<strong>on</strong>g>study</str<strong>on</strong>g> <strong>in</strong> South Africa <strong>on</strong> poor household fuel impacts <strong>in</strong>dicated thatexternalities ma<strong>in</strong>ly from fires, burns and air polluti<strong>on</strong> <strong>in</strong>creased the ec<strong>on</strong>omic cost of paraff<strong>in</strong>(kerosene) by over 78% and wood by a significant amount (Borchers, 1997; Borchers andAnnecke, 2006; Thorne, 1997). Address<strong>in</strong>g this situati<strong>on</strong> is therefore the key <strong>to</strong> the MDGs.The major cause of IAP is burn<strong>in</strong>g of solid biomass fuels (wood, animal dung and agriculturalresidues) <strong>in</strong> open or traditi<strong>on</strong>al cook s<strong>to</strong>ves built <strong>in</strong> poorly ventilated kitchens. Polluti<strong>on</strong> fromdifferent types of cook<strong>in</strong>g s<strong>to</strong>ves us<strong>in</strong>g coal, fuelwood, and other biomass fuels c<strong>on</strong>tributes <strong>to</strong> someextent, <strong>to</strong> the overall polluti<strong>on</strong> load <strong>in</strong> urban areas. Those most vulnerable <strong>to</strong> the effects of airpolluti<strong>on</strong> (the young, the old and the sick) spend most of their time <strong>in</strong>doors, where they may besignificantly exposed. Indeed, the highest exposures <strong>to</strong> air polluti<strong>on</strong> occur <strong>in</strong> the <strong>in</strong>doorenvir<strong>on</strong>ment <strong>in</strong> develop<strong>in</strong>g countries, ma<strong>in</strong>ly from biomass and coal combusti<strong>on</strong> for cook<strong>in</strong>g andheat<strong>in</strong>g. Other pollutants may orig<strong>in</strong>ate from cigarette smoke, c<strong>on</strong>structi<strong>on</strong> materials and methods,materials for furniture and fitt<strong>in</strong>gs, pa<strong>in</strong>ts and solvents. The <strong>in</strong>door envir<strong>on</strong>ment can also beaffected by pollutants <strong>in</strong> the ambient envir<strong>on</strong>ment, and vice versa (v<strong>on</strong> Schirnd<strong>in</strong>, 2002).More than two billi<strong>on</strong> of the world’s poorest people still rely <strong>on</strong> biomass and coal-burn<strong>in</strong>g forhousehold energy needs. Use of these fuels <strong>in</strong>doors leads <strong>to</strong> levels of <strong>in</strong>door air polluti<strong>on</strong> manytimes higher than <strong>in</strong>ternati<strong>on</strong>al ambient air quality standards allow for, expos<strong>in</strong>g poor women andchildren <strong>on</strong> a daily basis <strong>to</strong> a major envir<strong>on</strong>mental air polluti<strong>on</strong> and public health hazard.(Nuwar<strong>in</strong>da, 2007; WHO, 2002a; WHO, 2003). A <str<strong>on</strong>g>study</str<strong>on</strong>g> <strong>in</strong> the Netherlands revealed that highlevels of SO2 are associated <strong>with</strong> most of Chr<strong>on</strong>ic Obstructive Pulm<strong>on</strong>ary Disease (COPD) a n<strong>on</strong>specificterm<strong>in</strong>ology comm<strong>on</strong>ly used <strong>to</strong> describe the spectrum of various diseases caus<strong>in</strong>glimitati<strong>on</strong> of respira<strong>to</strong>ry airflow for example asthma, chr<strong>on</strong>ic br<strong>on</strong>chitis, and emphysema. The same<str<strong>on</strong>g>study</str<strong>on</strong>g> revealed that a significant associati<strong>on</strong> was found between f<strong>in</strong>e particles measurements andvisits <strong>to</strong> hospital emergency departments (Stephen et al., 2007). The most serious health risks arefrom burns and smoke <strong>in</strong>halati<strong>on</strong>-<strong>with</strong> the severity of such risks dependent <strong>on</strong> the length and levelof exposure. In poorly ventilated dwell<strong>in</strong>gs, especially when biomass fuels are used <strong>to</strong> heat rooms
59<strong>in</strong> which people sleep, carb<strong>on</strong> m<strong>on</strong>oxide pois<strong>on</strong><strong>in</strong>g is a serious hazard. Exposure <strong>to</strong> carc<strong>in</strong>ogens <strong>in</strong>emissi<strong>on</strong>s from biomass fuel combusti<strong>on</strong> has been c<strong>on</strong>firmed <strong>in</strong> studies <strong>in</strong> which exposed subjectswere pers<strong>on</strong>al m<strong>on</strong>i<strong>to</strong>r<strong>in</strong>g equipment and women who spend two <strong>to</strong> four hours a day at the s<strong>to</strong>veand have high exposure levels of <strong>to</strong>tal suspended particulates. This must be presumed <strong>to</strong> causesome risk of respira<strong>to</strong>ry cancer (WHO, 1992).More than 80 percent of <strong>Rwanda</strong>’s populati<strong>on</strong> (approximately 20 milli<strong>on</strong> people), pr<strong>in</strong>cipallycompris<strong>in</strong>g the rural poor are exposed <strong>to</strong> dangerous levels of IAP and many people suffer fromproblems related <strong>to</strong> IAP we can estimate that 2.7 percent of the nati<strong>on</strong>al burden of disease <strong>in</strong><strong>Rwanda</strong> is attributed <strong>to</strong> solid fuel use and this can causes 7500 deaths per year In urban areas of<strong>Rwanda</strong>, where large part of the populati<strong>on</strong> is us<strong>in</strong>g fuel wood, charcoals, and kerosene forcook<strong>in</strong>g purposes <strong>in</strong> their daily life, it is unreas<strong>on</strong>able <strong>to</strong> ignore the air polluti<strong>on</strong> that results fromthese burn<strong>in</strong>gs. The rapid urbanizati<strong>on</strong> of <strong>Kigali</strong> City was accompanied by a tremendous <strong>in</strong>crease<strong>in</strong> the flow of fuel wood and charcoal. The fuelwood <strong>in</strong>flow has <strong>in</strong>creased by 87% from the annualsupply of 8,776,080 kg <strong>in</strong> Oc<strong>to</strong>ber 1999 <strong>to</strong> 15,321,600 kg <strong>in</strong> September 2004. At the same time,the charcoal flows <strong>in</strong><strong>to</strong> <strong>Kigali</strong> have <strong>in</strong>creased by 95% from the annual supply of 2,031,934 kg <strong>in</strong>Oc<strong>to</strong>ber 1999 <strong>to</strong> 3,960,600kg <strong>in</strong> Oc<strong>to</strong>ber 2004 (Chris<strong>to</strong>phersen, 1999). Throughout <strong>Rwanda</strong>, thema<strong>in</strong> sources of light<strong>in</strong>g energy are oil (64 %), wood (17.5 %) and kerosene (10 %). For the urbanhouseholds firewood (52 %) and charcoal (39.5 %) are by far the ma<strong>in</strong> sources of energy used,other sources be<strong>in</strong>g gas and kerosene. Even <strong>in</strong> <strong>Kigali</strong> city, <strong>on</strong>ly 37 % of the households useelectricity (MINECOFIN, 2002).Currently, over 85% of <strong>Rwanda</strong>ns depend <strong>on</strong> wood for domestic energy because alternativesources of energy are unreliable and unaffordable for the majority of <strong>Rwanda</strong>ns, lead<strong>in</strong>g <strong>to</strong>extensive deforestati<strong>on</strong> (Care Internati<strong>on</strong>al <strong>Rwanda</strong>, 2010). In urban area of <strong>Rwanda</strong>, almost morethan 60 % of the people use fuel wood, charcoals and kerosene for cook<strong>in</strong>g as well as for otherdaily activities (Henn<strong>in</strong>ger, 2009; MINECOFIN, 2002). Thus the c<strong>on</strong>tributi<strong>on</strong> of this process <strong>to</strong> theenvir<strong>on</strong>ment polluti<strong>on</strong> should not be treated as <strong>in</strong>significant. Nevertheless, c<strong>on</strong>troll<strong>in</strong>g the airpolluti<strong>on</strong> result<strong>in</strong>g from these sources is also a problem <strong>in</strong> c<strong>on</strong>necti<strong>on</strong> <strong>with</strong> their effect <strong>on</strong> the liv<strong>in</strong>gc<strong>on</strong>diti<strong>on</strong> of the people. For <strong>in</strong>stance, tax<strong>in</strong>g or charg<strong>in</strong>g these commodities is <strong>on</strong>e method ofc<strong>on</strong>troll<strong>in</strong>g the air polluti<strong>on</strong> by discourag<strong>in</strong>g the c<strong>on</strong>sumpti<strong>on</strong> of these commodities. But, s<strong>in</strong>ce the
60c<strong>on</strong>sumpti<strong>on</strong> of these commodities may be more c<strong>on</strong>centrated <strong>on</strong> poor households than the rich<strong>on</strong>es the effect of tax<strong>in</strong>g or charg<strong>in</strong>g the commodities should be analyzed first.As the <strong>Air</strong> polluti<strong>on</strong> <strong>in</strong> residential areas is a problem <strong>in</strong> <strong>Kigali</strong> City, the c<strong>on</strong>necti<strong>on</strong> of low <strong>in</strong>comehouseholds <strong>to</strong> the nati<strong>on</strong>al electricity grid under the Electricity Access Roll out Programme (EARP)is perceived as <strong>on</strong>e of the strategic measures taken by the government <strong>to</strong> solve the issue. A <str<strong>on</strong>g>study</str<strong>on</strong>g><strong>in</strong> South Africa <strong>in</strong> the Township of Leandra revealed that the electrificati<strong>on</strong> resulted <strong>in</strong> a significantreducti<strong>on</strong> <strong>in</strong> PM10 c<strong>on</strong>centrati<strong>on</strong>s particularly dur<strong>in</strong>g the morn<strong>in</strong>g and even<strong>in</strong>g peaks. There wasalso somewhat of a reducti<strong>on</strong> <strong>in</strong> SO2 c<strong>on</strong>centrati<strong>on</strong>s, although a n<strong>on</strong>-local, probably <strong>in</strong>dustrialsource, also c<strong>on</strong>tributes <strong>to</strong> SO2 levels for households that are located near pollutant <strong>in</strong>dustries.PM10 and SO2 <strong>in</strong>creased steadily aga<strong>in</strong> after the electrificati<strong>on</strong>, as the <strong>to</strong>wnship expanded and thedomestic use of coal <strong>in</strong>creased (Mugabo, 2011).Not <strong>on</strong>ly the heavy dependence and <strong>in</strong>efficient utilizati<strong>on</strong> of biomass resources for energy haveresulted <strong>in</strong> high depleti<strong>on</strong> of the forest resources, but also the use of traditi<strong>on</strong>al cook<strong>in</strong>g technology,<strong>on</strong>e source of <strong>in</strong>efficient biomass resource use, has been l<strong>in</strong>ked <strong>to</strong> <strong>in</strong>door air polluti<strong>on</strong> and poorhealth (Damte and Koch, 2011). In resp<strong>on</strong>se, the Government of <strong>Rwanda</strong> and other <strong>in</strong>stituti<strong>on</strong>shave pushed for the adopti<strong>on</strong> of new cook<strong>in</strong>g technologies. For <strong>in</strong>stance, CARE Internati<strong>on</strong>al<strong>Rwanda</strong> is <strong>in</strong>volved <strong>in</strong> cook s<strong>to</strong>ves dissem<strong>in</strong>ati<strong>on</strong> <strong>in</strong> <strong>Rwanda</strong> <strong>on</strong> design and test<strong>in</strong>g of improvedcook s<strong>to</strong>ves.Figure 11: Fuel use, CO2 and PM emissi<strong>on</strong> for TCS and ICS
61The tra<strong>in</strong><strong>in</strong>g c<strong>on</strong>ducted Aprovecho Research Center <strong>in</strong> 18 C<strong>on</strong>trolled Cook<strong>in</strong>g Test <strong>with</strong> CARE staff<strong>in</strong> Huye District <strong>in</strong> 2010 revealed that fuel c<strong>on</strong>sumpti<strong>on</strong> CO and CO2 producti<strong>on</strong> pass a 99%c<strong>on</strong>fidence level t-test and PM producti<strong>on</strong> passes at 97%. No significant difference is foundbetween cook<strong>in</strong>g time. The improved s<strong>to</strong>ve showed a 62% reducti<strong>on</strong> <strong>in</strong> fuel use; 49% reducti<strong>on</strong> <strong>in</strong>carb<strong>on</strong> m<strong>on</strong>oxide CO produced and 42% reducti<strong>on</strong> <strong>in</strong> PM emissi<strong>on</strong>s (Serrar et al., 2010).Another <str<strong>on</strong>g>study</str<strong>on</strong>g> tried <strong>to</strong> measure the PM2.5 and CO us<strong>in</strong>g the traditi<strong>on</strong>al cook<strong>in</strong>g s<strong>to</strong>ves and theimproved cook<strong>in</strong>g s<strong>to</strong>ves <strong>in</strong> rural areas of <strong>Rwanda</strong> has revealed the follow<strong>in</strong>g summarized results:The average 24-hr mean PM 2.5 c<strong>on</strong>centrati<strong>on</strong> was measured <strong>to</strong> be 2.127 mg/m 3 <strong>in</strong> before phase (<strong>with</strong> TCS)and that <strong>in</strong> the after phase (<strong>with</strong> ICS) was 0.728 mg/m 3 . The average 24-hr mean CO c<strong>on</strong>centrati<strong>on</strong> wasmeasured <strong>to</strong> be 22.174 ppm <strong>with</strong> the TCS and 8.349 ppm <strong>with</strong> the ICS. The average percent change of theIAP c<strong>on</strong>centrati<strong>on</strong> between the TCS and ICS were therefore 65.73% for PM 2.5 and 62.34% for CO. The datashows that the polluti<strong>on</strong> levels <strong>in</strong> houses that use TCS are very high and the ICS that is promoted <strong>in</strong><strong>Rwanda</strong> is quite successful <strong>in</strong> reduc<strong>in</strong>g IAP. However the fact that the polluti<strong>on</strong> levels are stillhigher than WHO guidel<strong>in</strong>e values even after <strong>in</strong>stallati<strong>on</strong> of ICS shows that there is a need formore improvement <strong>in</strong> areas such as ventilati<strong>on</strong> and kitchen management.By Kitchens, the highest and lowest 24-hr average mean PM2.5 and CO c<strong>on</strong>centrati<strong>on</strong>s weremeasured <strong>in</strong> K1 and K2 respectively <strong>in</strong> both ‘before’ and ‘after’ measurements. In K1, themeasured mean c<strong>on</strong>centrati<strong>on</strong>s of PM2.5 were 3.374mg/m 3 <strong>with</strong> TCS and 1.429mg/m 3 <strong>with</strong> the ICSand for CO these were 38.557ppm <strong>with</strong> TCS and 17.172ppm <strong>with</strong> ICS. In K2, the mean PM2.5 andCO were respectively 0.889mg/m 3 and 8.660ppm <strong>with</strong> the TCS; and 0.728mg/m 3 and 3.337ppm<strong>with</strong> the ICS. The large difference <strong>in</strong> polluti<strong>on</strong> levels <strong>in</strong> the two kitchens both before and after the<strong>in</strong>stallati<strong>on</strong> of the ICS shows that other fac<strong>to</strong>rs, besides the s<strong>to</strong>ve design, such as ventilati<strong>on</strong> andcook<strong>in</strong>g habits are also very important <strong>in</strong> determ<strong>in</strong><strong>in</strong>g IAP levels. The details of the PM2.5 and COc<strong>on</strong>centrati<strong>on</strong> levels observed are summarized <strong>in</strong> the table below:Table 11: Summary of the PM 2.5 and CO values for TCS and ICSBefore After P-Average%Nvalue* reducti<strong>on</strong>Mean SD Max M<strong>in</strong> Mean SD Max M<strong>in</strong>Average of all
62PM2.5 36 2.127 1.797 7.129 0.212 0.728 0.652 2.900 0.093 0.000 65.73CO 36 22.174 19.672 102.560 4.250 8.349 7.245 27.620 0.200 0.000 62.34K1PM2.5 8 3.374 1.653 5.651 1.514 1.429 0.810 2.900 0.422 0.008 57.64CO 8 38.657 13.683 55.880 19.990 17.217 7.701 27.620 5.550 0.012 55.57K2PM2.5 14 2.653 1.951 7.129 0.562 0.749 0.513 1.856 0.143 0.001 71.74CO 14 26.269 23.167 102.564 4.25 8.320 5.533 22.180 2.500 0.002 68.32K3PM2.5 14 0.889 0.718 2.751 0.212 0.308 0.187 0.772 0.093 0.002 65.35CO 14 8.660 4.737 23.210 4.440 3.337 1.952 8.120 0.200 0.002 61.46• While c<strong>on</strong>sider<strong>in</strong>g the results from all three kitchens, the m<strong>in</strong>imum and maximum of the mean24-hr PM2.5 c<strong>on</strong>centrati<strong>on</strong>s observed <strong>with</strong> the TCS were respectively 0.212mg/m 3 and7.129mg/m 3 . Similarly, <strong>with</strong> the ICS these were 0.093mg/m 3 and 2.90mg/m 3 (please refer <strong>to</strong>the table above).• Similar <strong>to</strong> PM2.5, the m<strong>in</strong>imum and maximum mean 24-hr CO c<strong>on</strong>centrati<strong>on</strong>s observedc<strong>on</strong>sider<strong>in</strong>g all kitchens <strong>with</strong> TCS were 4.25ppm and 102.56ppm respectively; and <strong>with</strong> the ICSwere 0.20ppm and 27.62ppm respectively (please refer <strong>to</strong> the table above).As the overall c<strong>on</strong>clusi<strong>on</strong>, the <str<strong>on</strong>g>study</str<strong>on</strong>g> has found very high levels of <strong>in</strong>door air polluti<strong>on</strong> from burn<strong>in</strong>gof biomass fuels, particularly <strong>in</strong> houses <strong>with</strong> poor ventilati<strong>on</strong>. However, the <str<strong>on</strong>g>study</str<strong>on</strong>g> has also shownthat the simple, low-cost and locally built mud brick ICS can reduce the polluti<strong>on</strong> levels as <strong>in</strong>dicatedby c<strong>on</strong>centrati<strong>on</strong> of PM2.5 and CO by more than 60 percent. The ICS also results <strong>in</strong> significanthealth benefits as well as other benefits such as reduced firewood c<strong>on</strong>sumpti<strong>on</strong>, cleaner kitchens,and reduced time for cook<strong>in</strong>g (http://www.s<strong>to</strong>vesforrwanda.com ). Overall the ICS users aresatisfied <strong>with</strong> their new s<strong>to</strong>ves and feel that reduced smoke, improved health and reduced firewoodc<strong>on</strong>sumpti<strong>on</strong> are the ma<strong>in</strong> benefits of the s<strong>to</strong>ves. However, there is a need for more awarenessprogrammes for scal<strong>in</strong>g up ICS throughout the country. The f<strong>in</strong>d<strong>in</strong>gs of this <str<strong>on</strong>g>study</str<strong>on</strong>g> can be used as a<strong>to</strong>ol for motivat<strong>in</strong>g people <strong>to</strong> <strong>in</strong>stall ICS. The <str<strong>on</strong>g>study</str<strong>on</strong>g> also shows that proper operati<strong>on</strong> andma<strong>in</strong>tenance of the ICS is essential for fully achiev<strong>in</strong>g its desired results and other aspects such asimproved ventilati<strong>on</strong> and kitchen management are also equally important.
635.7.5. Progress so far made <strong>in</strong> <strong>Rwanda</strong>Progress <strong>in</strong> air polluti<strong>on</strong> c<strong>on</strong>trol and reducti<strong>on</strong> has been made <strong>in</strong> <strong>Rwanda</strong> <strong>in</strong>clud<strong>in</strong>g theImplementati<strong>on</strong> of relevant Multilateral Envir<strong>on</strong>mental Agreements (MEAs). As menti<strong>on</strong>ed before,<strong>Rwanda</strong> is also part of <strong>to</strong> several MEAs that are of relevance <strong>to</strong> mitigati<strong>on</strong> of air polluti<strong>on</strong>. These<strong>in</strong>clude: The Vienna C<strong>on</strong>venti<strong>on</strong> <strong>on</strong> the Protecti<strong>on</strong> of the Oz<strong>on</strong>e Layer and its M<strong>on</strong>treal Pro<strong>to</strong>col <strong>on</strong>Substances that Deplete the Oz<strong>on</strong>e Layer; The United Nati<strong>on</strong>s Framework C<strong>on</strong>venti<strong>on</strong> <strong>on</strong> ClimateChange and its related Pro<strong>to</strong>cols Basel C<strong>on</strong>venti<strong>on</strong> <strong>on</strong> the C<strong>on</strong>trol of Transboundary Movements ofHazardous Waste and their Disposal; and The S<strong>to</strong>ckholm C<strong>on</strong>venti<strong>on</strong> <strong>on</strong> Persistent OrganicPollutants Enforcement…etc.<strong>Rwanda</strong> Bureau of Standards (RBS) primary mandate is <strong>to</strong> develop Nati<strong>on</strong>al Standards <strong>to</strong> meet<strong>in</strong>dustry, governmental, and other cus<strong>to</strong>mer needs <strong>in</strong> a bid <strong>to</strong> promote competitiveness of<strong>Rwanda</strong>n products and services, <strong>to</strong> protect health and envir<strong>on</strong>ment. It is <strong>in</strong> this regard thatfollow<strong>in</strong>g a list of Draft Standards <strong>in</strong> progress published <strong>in</strong> the issue Number 8, RBS is pleased <strong>to</strong><strong>in</strong>form the readers about recently approved envir<strong>on</strong>ment standards related <strong>to</strong> the air quality. Theseare: RS 542:2011; EAS 750:2010 referr<strong>in</strong>g <strong>to</strong> the guidel<strong>in</strong>e for the air quality <strong>in</strong> terms of emissi<strong>on</strong>s<strong>to</strong> the air by cement fac<strong>to</strong>ries; RS 543:2011 EAS 751: 2010 related <strong>to</strong> the air quality specificati<strong>on</strong>;and the RS 544:2011 EAS 752:201 <strong>Air</strong> Quality related <strong>to</strong> the <strong>to</strong>lerance limits of emissi<strong>on</strong>discharged <strong>to</strong> the air by fac<strong>to</strong>ries.5.7.6. Identified gaps and challengesFrom this research, it was found that the regula<strong>to</strong>ry regime <strong>on</strong> air polluti<strong>on</strong> c<strong>on</strong>trol and reducti<strong>on</strong>still has <strong>to</strong> be improved <strong>in</strong> <strong>Rwanda</strong>. The envir<strong>on</strong>ment management acts exist <strong>in</strong> <strong>Rwanda</strong> butrelevant regulati<strong>on</strong>s and their enforcement are yet <strong>to</strong> be formulated and f<strong>in</strong>alized. Limited<strong>in</strong>stituti<strong>on</strong>al capacity and technical <strong>in</strong>frastructure such as f<strong>in</strong>d<strong>in</strong>g, equipment and human resourcehave been identified <strong>in</strong> this <str<strong>on</strong>g>study</str<strong>on</strong>g>. Very limited <strong>in</strong>formati<strong>on</strong> and is another challenge as there is nosystematic quantitative assessment of the magnitude of the air quality due <strong>to</strong> <strong>in</strong>adequate capacityand resources. The level of public awareness <strong>on</strong> the air polluti<strong>on</strong> problems and associated adverseeffect <strong>to</strong> human health and envir<strong>on</strong>ment is still low. The rapid growth of rural and urban populati<strong>on</strong>coupled <strong>with</strong> poor urban plann<strong>in</strong>g which allows for <strong>in</strong>appropriate allocati<strong>on</strong> of ec<strong>on</strong>omic activities<strong>with</strong><strong>in</strong> <strong>Kigali</strong> City is also lead<strong>in</strong>g <strong>to</strong> air polluti<strong>on</strong>. Inadequate <strong>in</strong>stituti<strong>on</strong>al coord<strong>in</strong>ati<strong>on</strong> and
64collaborati<strong>on</strong> between government <strong>in</strong>stituti<strong>on</strong>s can lead <strong>to</strong> the lack of comm<strong>on</strong> strategies.Inadequate <strong>in</strong>volvement of major stakeholders (e.g. local community, NGOs, the private sec<strong>to</strong>r,<strong>in</strong>dustries) <strong>in</strong> address<strong>in</strong>g the envir<strong>on</strong>mental problems has been noticed. Inadequate <strong>in</strong>tegrati<strong>on</strong> ofenvir<strong>on</strong>mental c<strong>on</strong>siderati<strong>on</strong>s <strong>in</strong> the plann<strong>in</strong>g and development programs was also noticed <strong>in</strong> thisresearch.6. Propagati<strong>on</strong> fac<strong>to</strong>rs of air polluti<strong>on</strong> <strong>in</strong> <strong>Kigali</strong> City6.1. Influence of <strong>to</strong>pographySome cities have characteristic w<strong>in</strong>d systems as a result of local <strong>to</strong>pography. An example of sucheffects is the ris<strong>in</strong>g air over a warm mounta<strong>in</strong> side dur<strong>in</strong>g daytime often lead<strong>in</strong>g <strong>to</strong> local formati<strong>on</strong> ofclouds and release of precipitati<strong>on</strong>. Dur<strong>in</strong>g night, the system turns around and the cool<strong>in</strong>g of themounta<strong>in</strong> valley leads <strong>to</strong> stable c<strong>on</strong>diti<strong>on</strong>s that may cause local air polluti<strong>on</strong> problem. The impact ofkatabatic w<strong>in</strong>ds due <strong>to</strong> the <strong>to</strong>pographical c<strong>on</strong>diti<strong>on</strong>s may affect cities. Usually the impact <strong>on</strong> airpollutant c<strong>on</strong>centrati<strong>on</strong>s is moderate, but they may lead for <strong>to</strong> high levels of local dust. Anotherexample is the warm and dry Foehn w<strong>in</strong>d formed <strong>on</strong> the back-side of a mounta<strong>in</strong> cha<strong>in</strong>. When thew<strong>in</strong>d is forced over the mounta<strong>in</strong>, the air is cooled and releases moisture. The air subsequentlybecomes warmer when it is mov<strong>in</strong>g down-hill aga<strong>in</strong>. This system may then form an <strong>in</strong>versi<strong>on</strong> andthen reduce dispersi<strong>on</strong> of local air pollutants (Hertel and Goodsite, 2009). These temperature<strong>in</strong>versi<strong>on</strong>s c<strong>on</strong>tributed <strong>to</strong> the accumulati<strong>on</strong> of aerosol and gaseous pollutants such as sulfur dioxideand particulates.C<strong>on</strong>sider<strong>in</strong>g <strong>Rwanda</strong> shows a dist<strong>in</strong>ctive relief and <strong>to</strong>pography, <strong>Kigali</strong> is also situated <strong>in</strong> the centralhighlands. The ma<strong>in</strong> bus<strong>in</strong>ess and residential districts are <strong>on</strong> <strong>to</strong>p of the ridges, which are enclosedby small valleys called “marais” where most of <strong>in</strong>dustries are operat<strong>in</strong>g. The lack of space forcesmore and more people <strong>to</strong> settle al<strong>on</strong>g the slopes and <strong>on</strong> the bot<strong>to</strong>m valley of the hills. Though theexistence of air polluti<strong>on</strong> depends <strong>on</strong> spatial distributi<strong>on</strong> and of course <strong>on</strong> <strong>in</strong>tensity of the sources.But polluti<strong>on</strong> is not necessarily bound <strong>with</strong><strong>in</strong> the area of str<strong>on</strong>gest emissi<strong>on</strong> (Henn<strong>in</strong>ger, 2009).Topographical c<strong>on</strong>diti<strong>on</strong>s <strong>in</strong> <strong>Kigali</strong> City could therefore have a very str<strong>on</strong>g <strong>in</strong>fluence <strong>on</strong> spatialclimatic modificati<strong>on</strong>s and the spatial distributi<strong>on</strong> of air quality as above highlighted by (Hertel andGoodsite, 2009).
Figure 12: Topography, land use and landscape <strong>in</strong> <strong>Kigali</strong> City65
666.2. Influences of meteorologyAn air polluti<strong>on</strong> problem <strong>in</strong>volves three parts: the source, the movement of the pollutant and therecipient. All meteorological phenomena are a result of <strong>in</strong>teracti<strong>on</strong> of the elemental properties ofthe atmosphere, heat, pressure, w<strong>in</strong>d and moisture. The c<strong>on</strong>centrati<strong>on</strong> of the pollutants <strong>in</strong> theatmosphere is governed by the emissi<strong>on</strong> sources and micrometeorology of the regi<strong>on</strong>, and for airquality management, knowledge of both these parameters is vital. The importantmicrometeorogical parameters relevant <strong>to</strong> air polluti<strong>on</strong> studies are w<strong>in</strong>d speed, w<strong>in</strong>d directi<strong>on</strong>, andatmospheric stability (Niyogi and Patil, 1994) . C<strong>on</strong>sequently, any <str<strong>on</strong>g>study</str<strong>on</strong>g> of air polluti<strong>on</strong> should<strong>in</strong>clude the weather patterns (meteorology) of the local area because the fate of air pollutants is<strong>in</strong>fluenced by the movements and characteristics of the air mass <strong>in</strong><strong>to</strong> which they are emitted. If theair is calm and pollutants cannot disperse, then the c<strong>on</strong>centrati<strong>on</strong> of these pollutants will build up.C<strong>on</strong>versely, if a str<strong>on</strong>g, turbulent w<strong>in</strong>d is blow<strong>in</strong>g any polluti<strong>on</strong> generated will be rapidly dispersed<strong>in</strong><strong>to</strong> the atmosphere and will result <strong>in</strong> lower c<strong>on</strong>centrati<strong>on</strong>s near the polluti<strong>on</strong> sources. Themeasurements of w<strong>in</strong>d speed and directi<strong>on</strong>, temperature, humidity, ra<strong>in</strong>fall and solar radiati<strong>on</strong> areimportant parameters used <strong>in</strong> the <str<strong>on</strong>g>study</str<strong>on</strong>g> of air quality m<strong>on</strong>i<strong>to</strong>r<strong>in</strong>g results and <strong>to</strong> further understandthe chemical reacti<strong>on</strong>s that occur <strong>in</strong> the atmosphere. Meteorological m<strong>on</strong>i<strong>to</strong>r<strong>in</strong>g is then used <strong>to</strong>predict air polluti<strong>on</strong> events such as <strong>in</strong>versi<strong>on</strong>s, high pollutant c<strong>on</strong>centrati<strong>on</strong> days and <strong>to</strong> simulateand predict air quality us<strong>in</strong>g computer models (The State of Queensland, 2011).6.2.1. Temperature and ra<strong>in</strong>fallsThe meteorological c<strong>on</strong>diti<strong>on</strong>s like air temperature heavily affects the polluti<strong>on</strong> levels as theygovern the dispersi<strong>on</strong> c<strong>on</strong>diti<strong>on</strong>s as well as the transport <strong>in</strong> and out of the urban area. This featureis termed the urban heat island effect because the city has a smaller albedo and therefore absorbsmore energy compared <strong>with</strong> the surround<strong>in</strong>g rural areas. There is <strong>in</strong> additi<strong>on</strong> a high c<strong>on</strong>sumpti<strong>on</strong> ofenergy <strong>in</strong>side the city, as a result of domestic heat<strong>in</strong>g and <strong>in</strong>tense road traffic, which aga<strong>in</strong>c<strong>on</strong>tributes <strong>to</strong> release of heat. The build<strong>in</strong>gs and other urban c<strong>on</strong>structi<strong>on</strong>s form a shield for thew<strong>in</strong>d, and this shield<strong>in</strong>g leads <strong>to</strong> less cool<strong>in</strong>g of the surfaces <strong>in</strong>side the city. S<strong>in</strong>ce the build<strong>in</strong>gs actas heat reservoirs, the city has furthermore a less pr<strong>on</strong>ounced diurnal temperature variati<strong>on</strong>compared <strong>with</strong> the rural areas (Hertel and Goodsite, 2009). The ambient temperature <strong>in</strong> urbanatmosphere of larger cities is generally a couple of degrees Celsius higher than that found <strong>in</strong>
67surround<strong>in</strong>g rural areas. Temperature and sunlight (solar radiati<strong>on</strong>) play an important role <strong>in</strong> thechemical reacti<strong>on</strong>s that occur <strong>in</strong> the atmosphere <strong>to</strong> form pho<strong>to</strong>chemical smog from other pollutants.Ra<strong>in</strong> has a "scaveng<strong>in</strong>g" effect when it washes particulate matter out of the atmosphere anddissolves gaseous pollutants. A reduced particle c<strong>on</strong>centrati<strong>on</strong> after ra<strong>in</strong> improves visibility. Ra<strong>in</strong>acts as a solvent for gaseous pollutants, such as sulfur dioxide, form<strong>in</strong>g acid ra<strong>in</strong> result<strong>in</strong>g <strong>in</strong>potential damage <strong>to</strong> materials or vegetati<strong>on</strong> where it falls. Certa<strong>in</strong> geographic areas or particulartimes of the year, <strong>with</strong> frequent high ra<strong>in</strong>fall are likely <strong>to</strong> have improved air quality (The State ofQueensland, 2011).Climate model scenarios based <strong>on</strong> s<strong>in</strong>ge stati<strong>on</strong> of <strong>Kigali</strong> <strong>Air</strong>port <strong>in</strong> <strong>Rwanda</strong> show the future<strong>in</strong>creases <strong>in</strong> mean annual temperature of up <strong>to</strong> 3.25°C for the regi<strong>on</strong> by the end of the century.Changes <strong>in</strong> ra<strong>in</strong>fall are more uncerta<strong>in</strong>, though most of the models show that ra<strong>in</strong>fall will <strong>in</strong>crease.Limited regi<strong>on</strong>al climate modell<strong>in</strong>g has been carried out that captures <strong>Rwanda</strong>’s unique regi<strong>on</strong>alsett<strong>in</strong>g and clima<strong>to</strong>logy.Figure 13: Variati<strong>on</strong> of annual average temperature and ra<strong>in</strong>fall at <strong>Kigali</strong>Source: Service Meteo du <strong>Rwanda</strong>The temperature trends for the urban area of <strong>Kigali</strong> was also analyzed by (Henn<strong>in</strong>ger, 2009),us<strong>in</strong>g the data from three meteorological stati<strong>on</strong>s ma<strong>in</strong>ta<strong>in</strong>ed by the “Service Meteo du <strong>Rwanda</strong>”.To have a comm<strong>on</strong> measur<strong>in</strong>g period of all three meteorological stati<strong>on</strong>s the 1971 and 2008 were
68observed. Fig. 3 <strong>in</strong>dicates an <strong>in</strong>creas<strong>in</strong>g annual mean temperature of 2.6 K for a period of nearly40 years. Ma<strong>in</strong>ly, for the last 10 years a warm<strong>in</strong>g <strong>in</strong> <strong>Kigali</strong> is evident. In the first <strong>in</strong>stance, thisdevelopment could be attributed <strong>to</strong> global warm<strong>in</strong>g, because more or less ris<strong>in</strong>g temperaturescould be recognized all over <strong>Rwanda</strong> dur<strong>in</strong>g the last decades. But it could also be related <strong>to</strong> the<strong>on</strong>go<strong>in</strong>g urbanizati<strong>on</strong>, because the temperature trend of <strong>Kigali</strong> is much higher and faster than <strong>in</strong>other parts of the country. All three stati<strong>on</strong>s display a mean urban temperature modificati<strong>on</strong> ofabout 2 K <strong>in</strong> relati<strong>on</strong> <strong>to</strong> the rural stati<strong>on</strong>s outside of <strong>Kigali</strong> (Henn<strong>in</strong>ger, 2009).Figure 14: Temperature trend for the measur<strong>in</strong>g period 1971– 2008; city of <strong>Kigali</strong>, <strong>Rwanda</strong>.Source: (Henn<strong>in</strong>ger, 2009)The same <str<strong>on</strong>g>study</str<strong>on</strong>g> presented the measurement results <strong>on</strong> suspended particulate matter <strong>in</strong> <strong>Kigali</strong> City<strong>in</strong> relati<strong>on</strong> recommended values of the WHO for PM10 short time exposure (50 μg m -3 ) (WHO,2006). From measurement results of PM10 detected car traverses, first sight the morn<strong>in</strong>g trips<strong>in</strong>dicated a lower c<strong>on</strong>centrati<strong>on</strong> than <strong>in</strong> the even<strong>in</strong>g hours; whereas no <strong>on</strong>e could really talk aboutlow c<strong>on</strong>centrati<strong>on</strong>. For the morn<strong>in</strong>g measurements suspended particulate matter c<strong>on</strong>centrati<strong>on</strong>ranges between 175 μg m -3 and 900 μg m -3 (Fig. 18; lower, blue l<strong>in</strong>es). The course of themeasur<strong>in</strong>g route is replicably very good. Highest values were reached between route secti<strong>on</strong>s 10and 16, where the route climbs up the hill, goes straight through the center of the city and leaves it
69<strong>on</strong> the other side of the ridge. The same behavior is visible for the even<strong>in</strong>g hours (Fig. 18; upper,red l<strong>in</strong>es). For <strong>in</strong>stant, the c<strong>on</strong>centrati<strong>on</strong> <strong>in</strong>creases from 1,400 μg m -3 up <strong>to</strong> 2,400 μg m -3 . Althoughhighest levels were measured <strong>in</strong> areas <strong>with</strong> paved roads <strong>in</strong> bus<strong>in</strong>ess and commercial areas <strong>with</strong>the highest traffic rates this result is not reassur<strong>in</strong>gly, because all measured residential districts <strong>in</strong><strong>Kigali</strong> exceeded the recommendati<strong>on</strong>s of the WHO, <strong>to</strong>o. This suggests that the <strong>in</strong>habitants of <strong>Kigali</strong>are exposed <strong>to</strong> enormous levels of PM10 dur<strong>in</strong>g most of their time outdoors. So PM10 levels are<strong>in</strong>creas<strong>in</strong>g <strong>in</strong> areas <strong>with</strong> high rates of traffic due <strong>to</strong> the exhaust of the vehicles and the stirr<strong>in</strong>g up ofdust from the ground, but also <strong>in</strong> fact of burn<strong>in</strong>g wood for cook<strong>in</strong>g etc. <strong>with</strong><strong>in</strong> the residentialdistricts. As a matter of fact for the measurements <strong>in</strong> February daily mean PM10 levels from sunrisetill sunset reached 1,013 μg m -3 .Figure 15: Results of PM 10 measur<strong>in</strong>g route <strong>in</strong> <strong>Kigali</strong> City <strong>in</strong> February 2008*For morn<strong>in</strong>g (lower, blue l<strong>in</strong>es) and for even<strong>in</strong>g measur<strong>in</strong>g trips (upper, red l<strong>in</strong>es).Source: (Henn<strong>in</strong>ger, 2009)Hazardous measur<strong>in</strong>g trips have been detected for some nighttime measurements <strong>in</strong> February2008. Because of high temperatures, high solar radiati<strong>on</strong> and a n<strong>on</strong>-typical miss<strong>in</strong>g cloud cover,the <strong>Kigali</strong> City urban surface could heat up extremely, which produced a cold-air flow from the ridgeand the slopes down <strong>to</strong> the “Marais”. From these night measurements, it was found that the PM10
70c<strong>on</strong>centrati<strong>on</strong> reached the highest levels of the day <strong>in</strong> nighttime hours. But the cold-air flow takesaway the suspended particulate matter, which tends <strong>to</strong> accumulate <strong>with</strong><strong>in</strong> the “Marais” <strong>on</strong> thebot<strong>to</strong>m of the hills, the places where most residential neighborhoods could be found andagricultural fields were used. Of course this is not the rule, but it is also no snap-shot, becausethese phenomena showed up <strong>in</strong> four of ten measur<strong>in</strong>g trips <strong>in</strong> 2008 and two <strong>in</strong> 2009.Figure 16: Measurements of PM 10 for nighttimes <strong>with</strong> cold-air dynamic from the ridge <strong>to</strong> the “Marais”.Source: (Henn<strong>in</strong>ger, 2009).Many scientists believe that the steady growth <strong>in</strong> the amount of carb<strong>on</strong> dioxide and other gasesbe<strong>in</strong>g released <strong>in</strong><strong>to</strong> the air due <strong>to</strong> the global warm<strong>in</strong>g is the major cause of global climate change.Increas<strong>in</strong>g earth temperatures could lead <strong>to</strong> an <strong>in</strong>crease <strong>in</strong> the severity of droughts, heat wavesand ext<strong>in</strong>cti<strong>on</strong> of animal and plant species and damage <strong>to</strong> coastl<strong>in</strong>es from ris<strong>in</strong>g ocean levels. Atthe end, car emissi<strong>on</strong>s and the result<strong>in</strong>g the global warm<strong>in</strong>g also carries all sorts of additi<strong>on</strong>alhealth risks. Insect-borne diseases are already spread<strong>in</strong>g due <strong>to</strong> warmer temperatures.6.2.2. W<strong>in</strong>d speed and directi<strong>on</strong>Meteorological data, such as w<strong>in</strong>d speed and directi<strong>on</strong>, and pho<strong>to</strong>chemical reacti<strong>on</strong>s betweenpollutants are comb<strong>in</strong>ed <strong>with</strong> data from a pollutant emissi<strong>on</strong>s <strong>in</strong>ven<strong>to</strong>ry for a regi<strong>on</strong> <strong>to</strong> model theprocesses that occur <strong>in</strong> the atmosphere. The f<strong>in</strong>d<strong>in</strong>gs of the model can be used <strong>to</strong> support
71strategies <strong>to</strong> manage the emissi<strong>on</strong>s from polluti<strong>on</strong> sources if the causes of polluti<strong>on</strong> are known andthe c<strong>on</strong>sequences of exceed<strong>in</strong>g the threshold c<strong>on</strong>centrati<strong>on</strong> are detrimental.If high pollutant c<strong>on</strong>centrati<strong>on</strong>s are measured at a m<strong>on</strong>i<strong>to</strong>r<strong>in</strong>g stati<strong>on</strong> the w<strong>in</strong>d data recorded at thestati<strong>on</strong> can be used <strong>to</strong> determ<strong>in</strong>e the general directi<strong>on</strong> and area of the emissi<strong>on</strong>s. When the likelysource or sources have been identified they can then be managed <strong>to</strong> reduce the impacts <strong>on</strong> airquality. W<strong>in</strong>d speed is measured us<strong>in</strong>g an <strong>in</strong>strument called an anemometer. In this picture a "cupwheel" anemometer is turned by the w<strong>in</strong>d which <strong>in</strong> turn generates an electrical current that is ameasure of the speed of the w<strong>in</strong>d.The measurement of meteorological parameters is important <strong>to</strong> ga<strong>in</strong> anunderstand<strong>in</strong>g of the impacts of a regi<strong>on</strong>'s meteorology <strong>on</strong> air pollutantc<strong>on</strong>centrati<strong>on</strong>s, the predicti<strong>on</strong> of <strong>in</strong>versi<strong>on</strong>s, and for the <str<strong>on</strong>g>study</str<strong>on</strong>g> ofw<strong>in</strong>dfield and dispersi<strong>on</strong> modell<strong>in</strong>g. In a <str<strong>on</strong>g>study</str<strong>on</strong>g> <strong>on</strong> effect ofmeteorological c<strong>on</strong>diti<strong>on</strong>s <strong>on</strong> urban air polluti<strong>on</strong> of Surat City, it wasfound that as w<strong>in</strong>d speed and temperature are high the dispersi<strong>on</strong> ishigh, because of which the difference <strong>in</strong> air pollutants c<strong>on</strong>centrati<strong>on</strong> between source stati<strong>on</strong> anddiluti<strong>on</strong> stati<strong>on</strong> is also very high and vice versa. Am<strong>on</strong>g the meteorological parameters, w<strong>in</strong>d speedis found <strong>to</strong> affect the dispersi<strong>on</strong> of pollutants the most. The air Quality parameters such as NOx,SO2, SPM are found <strong>to</strong> be <strong>with</strong><strong>in</strong> limit (Verma and Desai, 2008). The carb<strong>on</strong> m<strong>on</strong>oxide emittedfrom road traffic is well dispersed dur<strong>in</strong>g summer by str<strong>on</strong>g w<strong>in</strong>ds, result<strong>in</strong>g <strong>in</strong> lowerc<strong>on</strong>centrati<strong>on</strong>s. However, dur<strong>in</strong>g w<strong>in</strong>ter, the carb<strong>on</strong> m<strong>on</strong>oxide c<strong>on</strong>centrati<strong>on</strong>s peak as the air iscalmer and does not disperse the pollutant as quickly, result<strong>in</strong>g <strong>in</strong> higher c<strong>on</strong>centrati<strong>on</strong>s. Anexample of the impacts of calm and w<strong>in</strong>dy c<strong>on</strong>diti<strong>on</strong>s <strong>on</strong> carb<strong>on</strong> m<strong>on</strong>oxide levels adjacent <strong>to</strong> amajor road <strong>in</strong> Brisbane over a <strong>on</strong>e-year period is shown <strong>in</strong> the graph below.
72Figure 17: Impacts of calm and w<strong>in</strong>dy c<strong>on</strong>diti<strong>on</strong>s <strong>on</strong> carb<strong>on</strong> m<strong>on</strong>oxide levels adjacent <strong>to</strong> a major roadSource: The State of Queensland (2011).W<strong>in</strong>d directi<strong>on</strong>s affect polluti<strong>on</strong> c<strong>on</strong>centrati<strong>on</strong>s, s<strong>in</strong>ce pollutants are primarily dispersed downw<strong>in</strong>dfrom sources. To account for w<strong>in</strong>d directi<strong>on</strong> impacts <strong>on</strong> polluti<strong>on</strong>, the overall understat<strong>in</strong>g of airpolluti<strong>on</strong> c<strong>on</strong>centrati<strong>on</strong>s, traffic flows and w<strong>in</strong>d directi<strong>on</strong> could be helpful <strong>to</strong> <strong>in</strong>vestigate vehicleemissi<strong>on</strong>s impacts <strong>on</strong> air polluti<strong>on</strong> c<strong>on</strong>centrati<strong>on</strong>s <strong>in</strong> different areas of <strong>Kigali</strong> City. So, the w<strong>in</strong>ddirecti<strong>on</strong> and speed for <strong>Kigali</strong> City analyzed <strong>in</strong> this <str<strong>on</strong>g>study</str<strong>on</strong>g> us<strong>in</strong>g the data from three meteorologicalstati<strong>on</strong>s ma<strong>in</strong>ta<strong>in</strong>ed by the “Service Meteo du <strong>Rwanda</strong>” for the years between 1974 and 2010.From our results, it was found that the general annual trends of w<strong>in</strong>d Directi<strong>on</strong> <strong>in</strong> <strong>Kigali</strong> City us<strong>in</strong>gthe s<strong>in</strong>gle stati<strong>on</strong> of Kanombe Internati<strong>on</strong>al <strong>Air</strong>port is from North and North-East <strong>to</strong> the South asshown <strong>in</strong> the figures below.
73Figure 18: Annual trends of w<strong>in</strong>d directi<strong>on</strong> and speed <strong>in</strong> <strong>Kigali</strong> City between 1974 and 2010W<strong>in</strong>ds <strong>in</strong> January at Kanombe <strong>Air</strong>port from 1974 <strong>to</strong> 1993W<strong>in</strong>ds <strong>in</strong> February at Kanombe <strong>Air</strong>port from 1974 <strong>to</strong> 1993NWNNE10.08.06.04.02.00.0ESE1 - 2 m/s3 - 5 m/s6 - 7 m/sNWNNE12.010.08.06.04.02.00.0ESE1 - 2 m/s3 - 5 m/s6 - 7 m/s8 - 10 m/s8 - 10 m/sWS> 10 m/sWS> 10 m/sSWSWNWNW<strong>in</strong>ds <strong>in</strong> March at Kanombe <strong>Air</strong>port from 1974 <strong>to</strong> 1993NE14.012.010.08.06.04.02.00.0ESE1 - 2 m/s3 - 5 m/s6 - 7 m/sNWNW<strong>in</strong>ds <strong>in</strong> April at Kanombe <strong>Air</strong>port from 1974 <strong>to</strong> 1993NE14.012.010.08.06.04.02.00.0ESE1 - 2 m/s3 - 5 m/s6 - 7 m/s8 - 10 m/s8 - 10 m/sWS> 10 m/sWS> 10 m/sSWSWNWW<strong>in</strong>ds <strong>in</strong> May at Kanombe <strong>Air</strong>port from 1974 <strong>to</strong> 1993NE20.0N15.0E1 - 2 m/s10.03 - 5 m/s5.00.0SE6 - 7 m/sNWNW<strong>in</strong>ds <strong>in</strong> June at Kanombe <strong>Air</strong>port from 1974 <strong>to</strong> 1993NE20.015.010.05.00.0ESE1 - 2 m/s3 - 5 m/s6 - 7 m/s8 - 10 m/s8 - 10 m/sWS> 10 m/sWS> 10 m/sSWSW
74NW<strong>in</strong>ds <strong>in</strong> July at Kanombe <strong>Air</strong>port from 1974 <strong>to</strong> 1993NE20.015.0E1 - 2 m/sW<strong>in</strong>ds <strong>in</strong> August at Kanombe <strong>Air</strong>port from 1974 <strong>to</strong> 1993NE20.0N15.0E1 - 2 m/s10.03 - 5 m/s10.03 - 5 m/s5.05.0NW0.0SE6 - 7 m/sNW0.0SE6 - 7 m/s8 - 10 m/s8 - 10 m/sWS> 10 m/sWS> 10 m/sSWSWW<strong>in</strong>ds <strong>in</strong> September at Kanombe <strong>Air</strong>port from 1974 <strong>to</strong> 1993NE12.0W<strong>in</strong>ds <strong>in</strong> Oc<strong>to</strong>ber at Kanombe <strong>Air</strong>port from 1974 <strong>to</strong> 1993NE10.0N10.08.0E1 - 2 m/sN8.06.0E1 - 2 m/s6.04.03 - 5 m/s4.03 - 5 m/s2.02.0NW0.0SE6 - 7 m/sNW0.0SE6 - 7 m/s8 - 10 m/s8 - 10 m/sWS> 10 m/sWS> 10 m/sSWSWW<strong>in</strong>ds <strong>in</strong> November at Kanombe <strong>Air</strong>port from 1974 <strong>to</strong> 199310.0NEW<strong>in</strong>ds <strong>in</strong> December at Kanombe <strong>Air</strong>port from 1974 <strong>to</strong> 1993NE10.09.0N8.07.0E1 - 2 m/sN8.0E1 - 2 m/s6.06.05.04.03 - 5 m/s4.03 - 5 m/s3.02.02.01.0NW0.0SE6 - 7 m/sNW0.0SE6 - 7 m/s8 - 10 m/s8 - 10 m/sWS> 10 m/sWS> 10 m/sSWSW
75With <strong>Kigali</strong> City, it was observed that aerosol c<strong>on</strong>centrati<strong>on</strong>s are <strong>in</strong>fluenced significantly by w<strong>in</strong>dspeed and precipitati<strong>on</strong>, but no major effect of temperature and humidity was observed. As thegeneral annual trend of w<strong>in</strong>d directi<strong>on</strong> is from North and North-East <strong>to</strong> the South, the southern par<strong>to</strong>f <strong>Kigali</strong> would expect <strong>to</strong> have highest c<strong>on</strong>centrati<strong>on</strong> air polluti<strong>on</strong> than other are <strong>in</strong> the entire city. Innew m<strong>on</strong>i<strong>to</strong>r<strong>in</strong>g stati<strong>on</strong>s for air polluti<strong>on</strong> m<strong>on</strong>i<strong>to</strong>r<strong>in</strong>g/preventi<strong>on</strong> have planned, their suitable sitesshould be identified <strong>in</strong> this z<strong>on</strong>e.6.2.3. Effects of air polluti<strong>on</strong>6.2.3.1. Health Effects<strong>Air</strong> polluti<strong>on</strong> is a comm<strong>on</strong>ly recognized external cost of mo<strong>to</strong>r vehicle use. Mobile (mo<strong>to</strong>r vehicle)emissi<strong>on</strong>s are c<strong>on</strong>sidered more difficult <strong>to</strong> c<strong>on</strong>trol than other emissi<strong>on</strong>s sources, such as electricitygenerati<strong>on</strong> plants and fac<strong>to</strong>ries, because they are numerous and dispersed, and have relativelyhigh damage costs because mo<strong>to</strong>r vehicles operate close <strong>to</strong> people. In many cities the air isalready so polluted that it has been caus<strong>in</strong>g illnesses and premature deaths am<strong>on</strong>g elderly peopleand children. Studies show that disease rate rises when the air polluti<strong>on</strong> level <strong>in</strong>creases. <strong>Air</strong>pollutants are also harmful for water and envir<strong>on</strong>ment, for example, by caus<strong>in</strong>g acid precipitati<strong>on</strong>and acidity of waters. Most of the ambient air-polluti<strong>on</strong> <strong>in</strong> urban areas comes from the fossil fuels<strong>in</strong>dustry, mo<strong>to</strong>r vehicles, heat<strong>in</strong>g and electricity generati<strong>on</strong>. In some cities the ma<strong>in</strong> air polluter isthe domestic heat<strong>in</strong>g. Many people heat their houses <strong>with</strong> firewood and cheap coal. This k<strong>in</strong>d ofheat<strong>in</strong>g method will decrease <strong>in</strong> the future. Although, new heat<strong>in</strong>g methods can be even worsepolluters. Instead of carb<strong>on</strong> dioxide the emissi<strong>on</strong>s can <strong>in</strong>clude various <strong>to</strong>xic and carc<strong>in</strong>ogenicchemicals, heavy metals, trace organic chemicals and fibers, pho<strong>to</strong>chemical pollutants, lead andcarb<strong>on</strong> m<strong>on</strong>oxide, which are much more harmful <strong>to</strong> human health (UNCHS, 1996)Many studies have dem<strong>on</strong>strated that PM10 (particulate matter less than 10 micr<strong>on</strong>s <strong>in</strong> diameter) isassociated <strong>with</strong> a wide range of adverse health outcomes rang<strong>in</strong>g from rang<strong>in</strong>g from acuterespira<strong>to</strong>ry symp<strong>to</strong>ms <strong>to</strong> premature mortality. Given the high correlati<strong>on</strong> between pollutants PM10may also serve as a surrogate measure for other pollutants <strong>in</strong>clud<strong>in</strong>g very f<strong>in</strong>e particles (less than2.5 micr<strong>on</strong>s) and a host of traffic-related <strong>to</strong>x<strong>in</strong>s (WHO, 2002b). East African Standard givespermissible limits of some comm<strong>on</strong> substances found <strong>in</strong> polluted air, namely sulfur dioxide, carb<strong>on</strong>
76m<strong>on</strong>oxides, particulate matter, oxides of nitrogen, hydrocarb<strong>on</strong>s, and lead. The standard coversboth the ambient air and emissi<strong>on</strong> sources for East African Community.Table 12: Ambient <strong>Air</strong> Quality Tolerance Limits <strong>in</strong> East African CommunityPollutantSulphur oxides(SO X);Oxides ofNitrogen (NO X);Time weightedAverageIndustrialareaResidential,Rural & OtherareaC<strong>on</strong>trolledareas***AnnualAverage*24 hours** 125 g/m 3 80 g/m 3 30 g/m 3Annual Average 0.019ppm/50g/m 3M<strong>on</strong>th Average24 Hours 0.048ppm/125g/m 3One HourInstant Peak 500 g/m 3Instant Peak (10m<strong>in</strong>)AnnualAverage*Test methods80 g/m 3 60 g/m 3 15 g/m 3 IS0 4221-19800.191 ppm80 g/m 3 60 g/m 3 15 g/m 3 ISO7996: 198524 hours** 150 g/m 3 80 g/m 3 30 g/m 38 hoursAnnual Average0.2 ppmM<strong>on</strong>th Average0.3 ppm24 Hours 0.4 ppmOne Hour0.8 ppmNitrogenDioxideSuspendedparticulatematter (SPM)Instant Peak1.4 ppmAnnual Average 150 g/m 3 0.05 ppm IS0 6768:1998M<strong>on</strong>th Average0.08 ppm24 Hours 100 g/m 3 0.1 ppmOne Hour0.2 ppmInstant Peak0.5 ppmAnnual360 g/m 3 140 g/m 3 70 g/m 3 ISO 9835:1993Average*24 hours** 500 g/m 3 200 g/m 3 100 g/m 3IndustrialC<strong>on</strong>trolledareaareas***Residential,Rural & Otherareamg/KgAnnual 100 g/m 3
77PollutantRespirableparticulatematter (
Number of cases78SulfatesCarb<strong>on</strong>m<strong>on</strong>oxideNitrogenoxidesSulfurdioxideLeadLower respira<strong>to</strong>ry illnessUpper respira<strong>to</strong>ry illnessChest illnessRespira<strong>to</strong>ry symp<strong>to</strong>msM<strong>in</strong>or RADsDays of work lossModerate or worse asthma statusMortalityHospital admissi<strong>on</strong>s– c<strong>on</strong>gestiveheart failureDecreased time <strong>to</strong> <strong>on</strong>set ofang<strong>in</strong>aRespira<strong>to</strong>ry illnessMorbidity <strong>in</strong> exercis<strong>in</strong>gasthmatics:Changes <strong>in</strong> pulm<strong>on</strong>ary functi<strong>on</strong>Respira<strong>to</strong>ry symp<strong>to</strong>msMortalityHypertensi<strong>on</strong>N<strong>on</strong>fatal cor<strong>on</strong>ary heart diseaseN<strong>on</strong>fatal strokesIntelligence quotient (IQ) lossSource: (Gwilliam and Kojima, 2004)Behavioral effectsOther hospital admissi<strong>on</strong>sIncreasedresp<strong>on</strong>sivenessairwayNeurobehavioral functi<strong>on</strong>Other cardiovascular diseasesReproductive effectsFetal effects from maternalexposureDel<strong>in</strong>quent and antisocialbehavior <strong>in</strong> childrenInflammati<strong>on</strong> of the lungOther cardiovascular effectsDevelopmental effectsDecreased pulm<strong>on</strong>aryfuncti<strong>on</strong>Inflammati<strong>on</strong> of the lungImmunological changesRespira<strong>to</strong>ry symp<strong>to</strong>ms <strong>in</strong>n<strong>on</strong>-asthmaticsHospital admissi<strong>on</strong>sFigure 19: Respira<strong>to</strong>ry Illness <strong>in</strong> Policl<strong>in</strong>ic du Carrefour between 2008 and 2011450400350300250200150100500Respira<strong>to</strong>ry illnesses at Polycl<strong>in</strong>ic duCarrefour2008 2009 2010 2011YearLRTITuberculosisSource: M<strong>in</strong>istry of Health, 2011
Number of casesNumber of cases79Figure 20: Respira<strong>to</strong>ry Illness <strong>in</strong> Kimir<strong>on</strong>ko Health Centre between 2002 and 2011Respira<strong>to</strong>ry illnesses at Kimir<strong>on</strong>ko Health Centre3000025000200001500010000LRTITuberculosisPneum<strong>on</strong>iaURTI500002002 2003 2004 2005 2006 2007 2008 2009 2010 2011YearSource: M<strong>in</strong>istry of Health, 2011Figure 21: Respira<strong>to</strong>ry Illness <strong>in</strong> Kanombe Military Hospital between 2008 and 2011Respira<strong>to</strong>ry Illness at Kanombe Military Hospital30002500200015001000AsthmaLRTIAllergic C<strong>on</strong>juctivitisURTIPneum<strong>on</strong>ia50002008 2009 2010 2011YearSource: M<strong>in</strong>istry of Health, 2011
80Despite such challenges, mobile emissi<strong>on</strong> reducti<strong>on</strong> efforts can be c<strong>on</strong>sidered a qualified success.C<strong>on</strong>trol technologies (often spurred by regulati<strong>on</strong>s or <strong>in</strong>centives) have substantially reduced manypollutants’ emissi<strong>on</strong> rates, but this success is qualified because some pollutants are not easilyreduced by technology, emissi<strong>on</strong> tests often underestimate actual emissi<strong>on</strong> rates, emissi<strong>on</strong> c<strong>on</strong>trolsystems sometimes fail, and reduced emissi<strong>on</strong> rates have been partly offset by <strong>in</strong>creased travel.The harmful impacts of some emissi<strong>on</strong>s, such as air <strong>to</strong>xics, have <strong>on</strong>ly recently been recognizedand so have m<strong>in</strong>imal c<strong>on</strong>trol strategies (HEI, 2007). This share is even higher <strong>in</strong> many areas werepeople c<strong>on</strong>gregate, such as cities, al<strong>on</strong>g highways and <strong>in</strong> tunnels (ORNL, 2005).6.2.3.2. <strong>Air</strong> polluti<strong>on</strong> and Climate changeClimate change (also called global warm<strong>in</strong>g and the greenhouse effect) refers <strong>to</strong> climatic changescaused by gases (called greenhouse gases or GHGs) that <strong>in</strong>crease atmospheric solar heat ga<strong>in</strong>.Although some organizati<strong>on</strong>s argue the evidence is <strong>in</strong>c<strong>on</strong>clusive or emissi<strong>on</strong> reducti<strong>on</strong> ec<strong>on</strong>omiccosts exceed likely benefits (e.g. Center for the Study of Carb<strong>on</strong> Dioxide and Global Change), suchgroups generally have little climatic or ecological expertise, and often represent <strong>in</strong>dustries thatbenefit from c<strong>on</strong>t<strong>in</strong>ued climate change emissi<strong>on</strong>s. Major scientific organizati<strong>on</strong>s c<strong>on</strong>sideranthropogenic (human caused) global warm<strong>in</strong>g a significant cost (actual damages) and risk(possibility of future damages). For example, the Intergovernmental Panel <strong>on</strong> Climate Change,c<strong>on</strong>cluded, “Warm<strong>in</strong>g of the climate system is unequivocal, as is now evident from observati<strong>on</strong>s of<strong>in</strong>creases <strong>in</strong> global average air and ocean temperatures, widespread melt<strong>in</strong>g of snow and ice andris<strong>in</strong>g global average sea level”.Local pollutants such as carb<strong>on</strong> m<strong>on</strong>oxide, air <strong>to</strong>x<strong>in</strong>s and particulates, tends <strong>to</strong> be c<strong>on</strong>centrated <strong>in</strong>vehicles and al<strong>on</strong>g adjacent <strong>to</strong> roadways. <strong>Air</strong> polluti<strong>on</strong> costs (per t<strong>on</strong> of emissi<strong>on</strong>) are higher al<strong>on</strong>gbusy roads, where populati<strong>on</strong> densities are high, and <strong>in</strong> areas where geographic and climaticc<strong>on</strong>diti<strong>on</strong>s trap polluti<strong>on</strong> and produce oz<strong>on</strong>e. Emissi<strong>on</strong>s under c<strong>on</strong>diti<strong>on</strong>s <strong>in</strong> which air polluti<strong>on</strong>tends <strong>to</strong> c<strong>on</strong>centrate due <strong>to</strong> geographic and weather c<strong>on</strong>diti<strong>on</strong>s (such as <strong>in</strong> valleys dur<strong>in</strong>g<strong>in</strong>versi<strong>on</strong>s) impose greater damages than the same emissi<strong>on</strong>s <strong>in</strong> less vulnerable locati<strong>on</strong>s. Jetaircraft emissi<strong>on</strong>s at high altitudes are believed <strong>to</strong> produce relatively large climate change impacts.The follow<strong>in</strong>g table shows different effects of air polluti<strong>on</strong> <strong>on</strong> envir<strong>on</strong>mental climate change.
81Table 14: <strong>Air</strong> polluti<strong>on</strong> effects <strong>on</strong> envir<strong>on</strong>mental climate changePollutantOz<strong>on</strong>e (O3)ParticulateMatter (PM)Envir<strong>on</strong>mental and Climate change effectsDamages vegetati<strong>on</strong> by visibly <strong>in</strong>jur<strong>in</strong>g leaves, reduc<strong>in</strong>g pho<strong>to</strong>synthesis, impair<strong>in</strong>greproducti<strong>on</strong> and growth, and decreas<strong>in</strong>g crop yields. Oz<strong>on</strong>e damage <strong>to</strong> plants may alterecosystem structure, reduce biodiversity, and decrease plant uptake of CO2. Oz<strong>on</strong>e is also agreenhouse gas that c<strong>on</strong>tributes <strong>to</strong> the warm<strong>in</strong>g of the atmosphere.Impairs visibility, adversely affects ecosystem processes, and damages and/or soilsstructures and property. Variable climate impacts depend<strong>in</strong>g <strong>on</strong> particle type. Most particlesare reflective and lead <strong>to</strong> net cool<strong>in</strong>g, while some (especially black carb<strong>on</strong>) absorb energyand lead <strong>to</strong> warm<strong>in</strong>g. Other impacts <strong>in</strong>clude chang<strong>in</strong>g the tim<strong>in</strong>g and locati<strong>on</strong> of traditi<strong>on</strong>alra<strong>in</strong>fall patternsOxides ofSulfur (SOx)Oxides ofNitrogen(NOx)Carb<strong>on</strong>M<strong>on</strong>oxide(CO)Volatile OrganicCompounds (VOCsOther Toxic<strong>Air</strong> PollutantsSource:C<strong>on</strong>tributes <strong>to</strong> the acidificati<strong>on</strong> of soil and surface water and mercury methylati<strong>on</strong> <strong>in</strong> wetlandareas. Causes <strong>in</strong>jury <strong>to</strong> vegetati<strong>on</strong> and local species losses <strong>in</strong> aquatic and terrestrial systems.C<strong>on</strong>tributes <strong>to</strong> particle formati<strong>on</strong> <strong>with</strong> associated envir<strong>on</strong>mental effects. Sulfate particlesc<strong>on</strong>tribute <strong>to</strong> the cool<strong>in</strong>g of the atmosphere.C<strong>on</strong>tributes <strong>to</strong> the acidificati<strong>on</strong> and nutrient enrichment (eutrophicati<strong>on</strong>, nitrogen saturati<strong>on</strong>) ofsoil and surface water. Leads <strong>to</strong> biodiversity losses. Impacts levels of oz<strong>on</strong>e, particles,and methane <strong>with</strong> associated envir<strong>on</strong>mental and climate effectsC<strong>on</strong>tributes <strong>to</strong> the formati<strong>on</strong> of CO2 and oz<strong>on</strong>e, greenhouse gases that warm theatmosphere.C<strong>on</strong>tributes <strong>to</strong> oz<strong>on</strong>e formati<strong>on</strong> <strong>with</strong> associated envir<strong>on</strong>mental and climate effects.C<strong>on</strong>tributes <strong>to</strong> the formati<strong>on</strong> of CO2 and oz<strong>on</strong>e, greenhouse gases that warm theatmosphere.Harmful <strong>to</strong> wildlife and lives<strong>to</strong>ck. Some <strong>to</strong>xic air pollutants accumulate <strong>in</strong> the food cha<strong>in</strong>.Some <strong>to</strong>xic air pollutants c<strong>on</strong>tribute <strong>to</strong> oz<strong>on</strong>e and particle polluti<strong>on</strong> <strong>with</strong> associatedenvir<strong>on</strong>mental and climate effects.7. Model<strong>in</strong>g the <strong>Air</strong> Polluti<strong>on</strong> <strong>in</strong> <strong>Kigali</strong> City<strong>Air</strong> polluti<strong>on</strong> model<strong>in</strong>g is a numerical <strong>to</strong>ol used <strong>to</strong> describe the causal relati<strong>on</strong>ship betweenemissi<strong>on</strong>s, meteorology, atmospheric c<strong>on</strong>centrati<strong>on</strong>s, depositi<strong>on</strong>, and other fac<strong>to</strong>rs. <strong>Air</strong> polluti<strong>on</strong>measurements give important, quantitative <strong>in</strong>formati<strong>on</strong> about ambient c<strong>on</strong>centrati<strong>on</strong>s anddepositi<strong>on</strong>, but they can <strong>on</strong>ly describe air quality at specific locati<strong>on</strong>s and times, <strong>with</strong>out giv<strong>in</strong>gclear guidance <strong>on</strong> the identificati<strong>on</strong> of the causes of the air quality problem. <strong>Air</strong> polluti<strong>on</strong> model<strong>in</strong>g,
82<strong>in</strong>stead, can give a more complete determ<strong>in</strong>istic descripti<strong>on</strong> of the air quality problem, <strong>in</strong>clud<strong>in</strong>g ananalysis of fac<strong>to</strong>rs and causes (emissi<strong>on</strong> sources, meteorological processes, and physical andchemical changes), and some guidance <strong>on</strong> the implementati<strong>on</strong> of mitigati<strong>on</strong> measures.<strong>Air</strong> polluti<strong>on</strong> models play an important role <strong>in</strong> science, because of their capability <strong>to</strong> assess therelative importance of the relevant processes. <strong>Air</strong> polluti<strong>on</strong> models are the <strong>on</strong>ly method thatquantifies the determ<strong>in</strong>istic relati<strong>on</strong>ship between emissi<strong>on</strong>s and c<strong>on</strong>centrati<strong>on</strong>s/depositi<strong>on</strong>s,<strong>in</strong>clud<strong>in</strong>g the c<strong>on</strong>sequences of past and future scenarios and the determ<strong>in</strong>ati<strong>on</strong> of the effectivenessof abatement strategies. This makes air polluti<strong>on</strong> models <strong>in</strong>dispensable <strong>in</strong> regula<strong>to</strong>ry, research, andforensic applicati<strong>on</strong>.7.1.1. Statistical modelsStatistical models are techniques based essentially <strong>on</strong> statistical data analysis of measuredambient c<strong>on</strong>centrati<strong>on</strong>s. These models are not determ<strong>in</strong>istic, <strong>in</strong> the sense that they do not establishnor simulate a cause-effect, physical relati<strong>on</strong>ship between emissi<strong>on</strong>s and ambient c<strong>on</strong>centrati<strong>on</strong>s.One of the ma<strong>in</strong> statistical models is the <strong>Air</strong> Quality Forecast and Alarm Systems. This model<strong>in</strong>clude different statistical techniques (e.g., time series analysis, spectral analysis, Kalman filters)used <strong>to</strong> forecast air polluti<strong>on</strong> trends a few hours <strong>in</strong> advance for the purpose of alert<strong>in</strong>g thepopulati<strong>on</strong> or, for example, block<strong>in</strong>g au<strong>to</strong>mobile traffic.The follow<strong>in</strong>g tables show the average and sum of different data <strong>on</strong> gases CO, SO2, NO2... thathave been collected <strong>on</strong> the stati<strong>on</strong> IO104-1-204 <strong>with</strong><strong>in</strong> <strong>Kigali</strong> City dur<strong>in</strong>g the period June 2009 until<strong>to</strong> January 2011. The data were collected <strong>on</strong> the <strong>in</strong>terval of 30 m<strong>in</strong> <strong>on</strong>e after another. The trend ofthe evoluti<strong>on</strong> of gases emissi<strong>on</strong> can be observed accord<strong>in</strong>g <strong>to</strong> different charts obta<strong>in</strong>ed.Table 15: Gases emissi<strong>on</strong> <strong>in</strong> <strong>Kigali</strong> City from June <strong>to</strong>-December 2009Year2009JuneStatistics CO NO NO2 NOx O3 SO2 M.PtMean 0.673491 0 0 0 50.53673829 0.582260121 0Sum 417.56439 0 0 0 31332.77774 865.8208 0July Mean 0.7272379 0 0 0 66.71198722 0.582260121 0Sum 1081.4027 0 0 0 99200.725 865.8208 0August Mean 0.6133104 0 0 0 54.33233986 0.655955608 0Sum 908.31271 0 0 0 80466.19534 971.4702556 0
83September Mean 0.5020136 0 0 0 55.56679958 0.593700353 0Sum 711.85531 0 0 0 78793.7218 841.8671004 0Oc<strong>to</strong>ber Mean 0.4508038 0 0 0 39.58851915 0.42105684 0Sum 659.526 0 0 0 57918.00352 616.0061568 0November Mean 0.581346 0 0 0 27.21002473 0.188858742 0Sum 795.28185 0 0 0 37223.31382 258.3587587 0December Mean 0.619242167 2.385857664 5.12897603 7.306052802 23.02208427 0.241132951 0Sum 917.71689 3535.841058 7601.142476 10827.57025 34118.72888 357.359033 0Total 5491.65985 3535.841058 7601.142476 10827.57025 419053.4661 4776.7029 0Table 16: Gases emissi<strong>on</strong> <strong>in</strong> <strong>Kigali</strong> City <strong>in</strong> 2010Year2010Statistics CO NO NO 2 NO x O 3 SO 2 M.Pt.January Mean 0.6277503 0.704611 1.567012 2.12927 37.61930364 0.556157422 0Sum 930.95375 1044.938 2323.879 3157.707 55789.4273 824.7814574 0February Mean 0.5821512 1.06E-05 0 0 31.80741845 0.644351382 0Sum 780.08265 0.014211 0 0 42621.94072 863.4308514 0March Mean 0.5809882 0 0 0 25.80570027 0.501789766 0Sum 846.49979 0 0 0 37598.9053 731.1076898 0April Mean 0.5598754 0 0 0 20.42862934 0.339776401 0Sum 800.06198 0 0 0 29192.51133 485.5404764 0May Mean 0.6674135 0 0 0 20.54263245 0.484662272 0Sum 987.77191 0 0 0 30403.09603 717.3001623 0June Mean 0.7855863 0.303926 0 0.232692 39.19606571 0.283553125 0Sum 981.19729 379.6039 0 290.6327 48955.88607 354.1578531 0July Mean 0.7883689 0 0 0 52.41636318 0.508791119 0Sum 1092.6793 0 0 0 72649.07936 705.1844911 0August Mean 0.8260785 0 0 0 55.61853351 0.227800068 0
84Sum 1220.944 0 0 0 82204.19253 336.6885001 0September Mean 0.7905891 0 0 0 47.01160292 0.087753343 0Sum 1136.0765 0 0 0 67555.6734 126.1015533 0Oc<strong>to</strong>ber Mean 0.7373611 0 0 0 39.35778524 0.331660528 0Sum 1089.8198 0 0 0 58170.80659 490.1942605 0November Mean 0.7621111 0 0 0 32.66663184 0.079563255 0Sum 1073.0524 0 0 0 45994.61763 112.0250633 0December Mean 0.8071351 0 0 0 36.33897431 0.174808519 0Sum 1194.5599 0 0 0 53781.68197 258.7166085 0Total 12133.69927 379.6039 0 290.6327 624917.8182 6005.228967Table 17: Gases emissi<strong>on</strong> <strong>in</strong> <strong>Kigali</strong> City <strong>in</strong> January 2011Year2011Statistics CO NO NO2 NOx O3 SO2 M.Pt.January Mean 0.7947499 0 0 0 39.13866567 0.1872394 0Sum 1192.9196 0 0 058747.13717281.0463394 0Before 9FebruaryMean 0.8203964 0 0 0 35.1143131 0.006589286 0Sum 276.4736 0 0 0 11833.52351 2.220589286 0Total 1469.3932 0 0 0 70580.66068 283.2669287 07.2. <strong>Air</strong> polluti<strong>on</strong> trends <strong>in</strong> <strong>Kigali</strong> City7.2.1. Suspended particulate matterAtmospheric particulate matter is def<strong>in</strong>ed <strong>to</strong> be any dispersed matter, solid or liquid, smaller than,500 μm. Under various c<strong>on</strong>diti<strong>on</strong>s of their generati<strong>on</strong>, they are also called by other names such asdust, fume, smoke and mist. Dust usually refers <strong>to</strong> the particles <strong>in</strong> the range of 1 <strong>to</strong> 200 μm size.Fume is very f<strong>in</strong>e solid or liquid particles aris<strong>in</strong>g from chemical reacti<strong>on</strong>s or c<strong>on</strong>densati<strong>on</strong> of gases.Smoke refers <strong>to</strong> f<strong>in</strong>ely divided particles result<strong>in</strong>g from <strong>in</strong>complete combusti<strong>on</strong> of substances suchas coal, petroleum, etc.
85Particles <strong>in</strong> the range of 0.1μm <strong>to</strong> 10μm are of, most <strong>in</strong>terest from health viewpo<strong>in</strong>t. Particulatematter of less then 10μm size (PM10) is classified as respirable dust. Larger particles that enter therespira<strong>to</strong>ry system are trapped by hairs and l<strong>in</strong><strong>in</strong>g of nose or can be captured by mucus <strong>in</strong> upperrespira<strong>to</strong>ry tract and worked back <strong>to</strong> the throat by cilia and removed by spitt<strong>in</strong>g. Particles between0.5 and 10 μm, called thoracic particles, penetrate <strong>to</strong> the lungs and are deposited there. Theseparticles by themselves and or by carry<strong>in</strong>g other air pollutants adsorbed <strong>on</strong> them may cause thegreatest harm. Elevated particulate c<strong>on</strong>centrati<strong>on</strong>s <strong>in</strong> the atmosphere, <strong>in</strong> the range of 400 μg/m 3and above especially <strong>in</strong> c<strong>on</strong>juncti<strong>on</strong> <strong>with</strong> oxides of sulphur have been l<strong>in</strong>ked <strong>to</strong> respira<strong>to</strong>ry<strong>in</strong>fecti<strong>on</strong>s, br<strong>on</strong>chitis, asthma, pneum<strong>on</strong>ia and the like. Many carb<strong>on</strong>aceous particles, especiallythose c<strong>on</strong>ta<strong>in</strong><strong>in</strong>g polycyclic aromatic hydrocarb<strong>on</strong>s (PAH) are suspected carc<strong>in</strong>ogens (UNEP,2004).With<strong>in</strong> <strong>Kigali</strong> City, a seas<strong>on</strong>al variati<strong>on</strong> was found as c<strong>on</strong>sistently higher dust load was found <strong>in</strong> thedry seas<strong>on</strong> which might possibly be attributed <strong>to</strong> the prevailed meteorological c<strong>on</strong>diti<strong>on</strong>s such aslow precipitati<strong>on</strong> and w<strong>in</strong>d speed. Compar<strong>in</strong>g the aerosol particles c<strong>on</strong>centrati<strong>on</strong> sampled dur<strong>in</strong>gweekend-days <strong>in</strong> <strong>Kigali</strong> City, the results showed that the c<strong>on</strong>centrati<strong>on</strong> of particle matter was higher<strong>in</strong> dry seas<strong>on</strong> than <strong>in</strong> the ra<strong>in</strong>y seas<strong>on</strong>. However, the weekday measurements show the oppositetrend. This might be related <strong>to</strong> the w<strong>in</strong>d directi<strong>on</strong> and high w<strong>in</strong>d speed which might be observeddur<strong>in</strong>g the ra<strong>in</strong>y seas<strong>on</strong> and low precipitati<strong>on</strong> observed dur<strong>in</strong>g the dry seas<strong>on</strong>; it was high asexpected tak<strong>in</strong>g <strong>in</strong><strong>to</strong> account that the soil dust was still produced <strong>in</strong> the city <strong>in</strong> dry seas<strong>on</strong>, as wellas the presence of a number of old cars and mo<strong>to</strong>r vehicles <strong>on</strong> the streets (Ingabire, 2009).7.2.2. Sulphur dioxideSulphur dioxide when released <strong>in</strong> the atmosphere can also c<strong>on</strong>vert <strong>to</strong> SO2, which leads <strong>to</strong>producti<strong>on</strong> of sulphuric acid. When SO2 is <strong>in</strong>haled it is likely <strong>to</strong> be absorbed <strong>in</strong> moist passages ofrespira<strong>to</strong>ry tract. When it is entra<strong>in</strong>ed <strong>in</strong> an aerosol, however, it may reach far deeper <strong>in</strong><strong>to</strong> thelungs. The adverse health effects of SO2 can be summarized as the deteriorati<strong>on</strong> <strong>in</strong> healthbr<strong>on</strong>chitis patients, <strong>in</strong>creased <strong>in</strong>cidence of the cardiorespira<strong>to</strong>ry diseases; and <strong>in</strong>creased hospitalityadmissi<strong>on</strong> and as well as augmented cardio-vascular morbidity. At the same, the sulphur dioxidecan damage the vegetati<strong>on</strong> and cause corrosi<strong>on</strong>. <strong>Air</strong>borne sulfates reduce visibility. It is also thecause of acid ra<strong>in</strong> <strong>in</strong> some countries.
SO2 (ppb)14-Jun-0921-Jun-0928-Jun-095-Jul-0912-Jul-0919-Jul-0926-Jul-092-Aug-099-Aug-0916-Aug-0923-Aug-0930-Aug-096-Sep-0913-Sep-0920-Sep-0927-Sep-094-Oct-0911-Oct-0918-Oct-0925-Oct-091-Nov-098-Nov-0915-Nov-0922-Nov-0929-Nov-096-Dec-0913-Dec-0920-Dec-0927-Dec-093-Jan-1010-Jan-1017-Jan-1024-Jan-1031-Jan-107-Feb-1014-Feb-1021-Feb-1028-Feb-107-Mar-1014-Mar-1021-Mar-1028-Mar-104-Apr-1011-Apr-1018-Apr-1025-Apr-102-May-109-May-1016-May-1023-May-1030-May-106-Jun-1013-Jun-1020-Jun-1027-Jun-104-Jul-1011-Jul-1018-Jul-1025-Jul-101-Aug-108-Aug-1015-Aug-1022-Aug-1029-Aug-105-Sep-1012-Sep-1019-Sep-1086Figure 22: L<strong>on</strong>g term SO 2 C<strong>on</strong>centrati<strong>on</strong> <strong>with</strong><strong>in</strong> <strong>Kigali</strong> City20151050-5Source: <strong>Kigali</strong> Institute of Science and Technology, 2010For the year 2009 and 2010, it is clear that the l<strong>on</strong>g-term c<strong>on</strong>centrati<strong>on</strong> of sulphur dioxide <strong>in</strong> <strong>Kigali</strong>City us<strong>in</strong>g the <strong>on</strong>ly <strong>on</strong>e available air quality m<strong>on</strong>i<strong>to</strong>r<strong>in</strong>g system which is located at <strong>Kigali</strong> Institute ofScience and Technology reached its peak <strong>in</strong> dry seas<strong>on</strong>s (August 2009, January and July 2010).Source:
C<strong>on</strong>entrati<strong>on</strong> <strong>in</strong> <strong>in</strong> µg/m387Source:Another <str<strong>on</strong>g>study</str<strong>on</strong>g> <strong>on</strong> of atmospheric aerosols <strong>in</strong> <strong>Kigali</strong> City us<strong>in</strong>g the sample sites revealed thefollow<strong>in</strong>g results.Figure 23: C<strong>on</strong>centrati<strong>on</strong> of SO 2- 4 and SO 2 <strong>in</strong> sample taken <strong>in</strong> <strong>Kigali</strong> CityThe SO4 2- c<strong>on</strong>centrati<strong>on</strong> was higher at the 4 thC<strong>on</strong>centrati<strong>on</strong> of SO 4 and SO 2 <strong>in</strong> sample taken <strong>in</strong> <strong>Kigali</strong> City75.94654.6743.58SO42-32.47SO22.272.1121.741.371 0.560.440.57 0.550.410.5601 2 3 4 5 6 7Numner of samplesSource: (Ingabire, 2009)sample (weekend dry) compared <strong>to</strong> othersamples. Am<strong>on</strong>g the measured elements, SO4 2-was highest <strong>in</strong> c<strong>on</strong>centrati<strong>on</strong>. The maximumc<strong>on</strong>centrati<strong>on</strong> of SO4 2- was 2.47 µg/m 3 collecteddur<strong>in</strong>g weekend. The m<strong>in</strong>imum c<strong>on</strong>centrati<strong>on</strong>SO4 2- was 0.41 µg/m 3 collected dur<strong>in</strong>g 24 hoursampl<strong>in</strong>g. The highest c<strong>on</strong>centrati<strong>on</strong> of SO2 was5.94 µg/m 3 (Ingabire, 2009).Based <strong>on</strong> the above results, it can be c<strong>on</strong>cluded that the sulphur dioxide released <strong>in</strong> theatmosphere of <strong>Kigali</strong> City is low when compared <strong>to</strong> the accepted annually average recommended
13-Dec-0920-Dec-0927-Dec-093-Jan-1010-Jan-1017-Jan-1024-Jan-1031-Jan-107-Feb-1014-Feb-1021-Feb-1028-Feb-107-Mar-1014-Mar-1021-Mar-1028-Mar-104-Apr-1011-Apr-1018-Apr-1025-Apr-102-May-109-May-1016-May-1023-May-1030-May-106-Jun-1013-Jun-1020-Jun-1027-Jun-104-Jul-1011-Jul-1018-Jul-1025-Jul-101-Aug-108-Aug-10NO (ppb)O3 (ppb)88by East African Standard for some comm<strong>on</strong> substances found <strong>in</strong> polluted air ( 80 g/m 3 for<strong>in</strong>dustrial areas, 60 g/m 3 for residential areas; a 15 g/m 3 c<strong>on</strong>trolled areas). But dur<strong>in</strong>g the dryseas<strong>on</strong>s, the measures taken at KIST air quality m<strong>on</strong>i<strong>to</strong>r<strong>in</strong>g are bey<strong>on</strong>d the permissible limits.7.2.3. Nitrogen oxidesAlmost all NOx emissi<strong>on</strong>s are <strong>in</strong> the form of NO, which has no known adverse health effects <strong>in</strong> thec<strong>on</strong>centrati<strong>on</strong>s found <strong>in</strong> atmosphere. However, NO can be oxidized <strong>to</strong> NO2 <strong>in</strong> the atmosphere,which <strong>in</strong> turn may give rise <strong>to</strong> sec<strong>on</strong>dary pollutants, which are <strong>in</strong>jurious. NO2 may also lead <strong>to</strong>formati<strong>on</strong> of HNO3, which is washed out of the atmosphere as acid ra<strong>in</strong>. From 2009 <strong>to</strong> 2010, thel<strong>on</strong>g term Nitrogen Dioxide c<strong>on</strong>centrati<strong>on</strong> <strong>in</strong> <strong>Kigali</strong> City reached the highest level <strong>in</strong> short dryseas<strong>on</strong> of January 2010 and <strong>in</strong> l<strong>on</strong>g dry seas<strong>on</strong> of July-August 2010.Figure 24: L<strong>on</strong>g term NO-O3 C<strong>on</strong>centrati<strong>on</strong> <strong>with</strong><strong>in</strong> <strong>Kigali</strong> City3012010025802060401520100-205-400-60Source: <strong>Kigali</strong> Institute of Science and Technology, 2009The average c<strong>on</strong>centrati<strong>on</strong> was estimate between 15 and 20 g/m 3 while the permissible limitvalue of proposed by the East African Standard for some comm<strong>on</strong> substances found <strong>in</strong> polluted airis 150 g/m 3. Therefore, it can be c<strong>on</strong>clude that nitrogen dioxide c<strong>on</strong>centrati<strong>on</strong> level is the range ofaccepted limit for air quality c<strong>on</strong>trol and m<strong>on</strong>i<strong>to</strong>r<strong>in</strong>g guidel<strong>in</strong>es.
13-Dec-0920-Dec-0927-Dec-093-Jan-1010-Jan-1017-Jan-1024-Jan-1031-Jan-107-Feb-1014-Feb-1021-Feb-1028-Feb-107-Mar-1014-Mar-1021-Mar-1028-Mar-104-Apr-1011-Apr-1018-Apr-1025-Apr-102-May-109-May-1016-May-1023-May-1030-May-106-Jun-1013-Jun-1020-Jun-1027-Jun-104-Jul-1011-Jul-1018-Jul-1025-Jul-101-Aug-108-Aug-10NO2 (ppb)O3 (ppb)89Figure 25: Diagram of l<strong>on</strong>g term NO2-O3 C<strong>on</strong>centrati<strong>on</strong> <strong>with</strong><strong>in</strong> <strong>Kigali</strong> City30120251008020601540102050-200-40-5-60Source: <strong>Kigali</strong> Institute of Science and Technology, 20107.2.4. Carb<strong>on</strong> m<strong>on</strong>oxideMost of the CO emissi<strong>on</strong>s are from transportati<strong>on</strong> sec<strong>to</strong>r. Peak c<strong>on</strong>centrati<strong>on</strong>s occur at street level<strong>in</strong> busy urban centers particularly when there is no atmospheric mix<strong>in</strong>g as it happens dur<strong>in</strong>g w<strong>in</strong>terseas<strong>on</strong>. Carb<strong>on</strong> m<strong>on</strong>oxide <strong>in</strong>terferes <strong>with</strong> blood's ability <strong>to</strong> carry oxygen. With the blood streamcarry<strong>in</strong>g less oxygen, bra<strong>in</strong> functi<strong>on</strong> is affected and heart rate <strong>in</strong>creases <strong>in</strong> an attempt <strong>to</strong> offset theoxygen deficit. Breath<strong>in</strong>g between 20 <strong>to</strong> 35 ppm CO <strong>in</strong> air for 4 hours results <strong>in</strong> impairment of timerelated resp<strong>on</strong>se. Individuals <strong>with</strong> heart c<strong>on</strong>diti<strong>on</strong> may experience chest pa<strong>in</strong>. Exposure <strong>to</strong> 100ppmc<strong>on</strong>centrati<strong>on</strong> would result <strong>in</strong> dizz<strong>in</strong>ess.
CO (ppm)14-Jun-0921-Jun-0928-Jun-095-Jul-0912-Jul-0919-Jul-0926-Jul-092-Aug-099-Aug-0916-Aug-0923-Aug-0930-Aug-096-Sep-0913-Sep-0920-Sep-0927-Sep-094-Oct-0911-Oct-0918-Oct-0925-Oct-091-Nov-098-Nov-0915-Nov-0922-Nov-0929-Nov-096-Dec-0913-Dec-0920-Dec-0927-Dec-093-Jan-1010-Jan-1017-Jan-1024-Jan-1031-Jan-107-Feb-1014-Feb-1021-Feb-1028-Feb-107-Mar-1014-Mar-1021-Mar-1028-Mar-104-Apr-1011-Apr-1018-Apr-1025-Apr-102-May-109-May-1016-May-1023-May-1030-May-106-Jun-1013-Jun-1020-Jun-1027-Jun-104-Jul-1011-Jul-1018-Jul-1025-Jul-101-Aug-108-Aug-1090Figure 26: L<strong>on</strong>g term C0 C<strong>on</strong>centrati<strong>on</strong> <strong>with</strong><strong>in</strong> <strong>Kigali</strong> City76543210Source: <strong>Kigali</strong> Institute of Science and Technology, 2010
CO (ppm)O 3 (ppb)91Figure 27: L<strong>on</strong>g term CO-O3 C<strong>on</strong>centrati<strong>on</strong> <strong>with</strong><strong>in</strong> <strong>Kigali</strong> City4.516041403.512032.521.510080601400.5200027-May-0916-Jun-096-Jul-0926-Jul-0915-Aug-094-Sep-0924-Sep-0914-Oct-093-Nov-0923-Nov-09TimeSource: <strong>Kigali</strong> Institute of Science and Technology, 2009It is very important <strong>to</strong> m<strong>on</strong>i<strong>to</strong>r the air polluti<strong>on</strong> c<strong>on</strong>t<strong>in</strong>uously and c<strong>on</strong>stantly. That is the <strong>on</strong>ly way <strong>to</strong>analyze the situati<strong>on</strong> of air polluti<strong>on</strong> <strong>in</strong> an appropriate manner. And the mach<strong>in</strong>e at KIST is the <strong>on</strong>lyavailable <strong>on</strong>e <strong>in</strong> <strong>Rwanda</strong> <strong>to</strong> keep this valuable data.7.2.5. Oz<strong>on</strong>e (O3)As already menti<strong>on</strong>ed, Oz<strong>on</strong>e gas is not usually emitted directly <strong>in</strong><strong>to</strong> the air, but at ground-level iscreated by a chemical reacti<strong>on</strong> between oxides of nitrogen (NOx) and volatile organic compounds(VOC) <strong>in</strong> the presence of sunlight. Mo<strong>to</strong>r vehicle exhaust and <strong>in</strong>dustrial emissi<strong>on</strong>s, gasol<strong>in</strong>e vapors,and chemical solvents as well as natural sources emit NOx and VOC that help form oz<strong>on</strong>e. Unlikethe protective layer of oz<strong>on</strong>e present <strong>in</strong> the upper atmosphere, oz<strong>on</strong>e produced at ground level canhave a serious health effects <strong>on</strong> people who suffer from lung diseases asthma or emphysema.With<strong>in</strong> <strong>Kigali</strong> City, the Diurnal Oz<strong>on</strong>e (O3) c<strong>on</strong>centrati<strong>on</strong> <strong>in</strong> August 2009 us<strong>in</strong>g the s<strong>in</strong>gle m<strong>on</strong>i<strong>to</strong>r<strong>in</strong>gsystem located at <strong>Kigali</strong> Institute of Science and Technology revealed a higher c<strong>on</strong>centrati<strong>on</strong> ofOz<strong>on</strong>e (O3) <strong>in</strong> atmosphere <strong>in</strong> the morn<strong>in</strong>g between 6:00-12:00 AM.
Oz<strong>on</strong>e (ppb)92Figure 28: Diurnal Oz<strong>on</strong>e (O3) c<strong>on</strong>centrati<strong>on</strong> <strong>in</strong> August 2009 <strong>with</strong><strong>in</strong> <strong>Kigali</strong> City1201008060402002009/8/1 12:002009/8/1 18:002009/8/2 0:002009/8/2 6:002009/8/2 12:002009/8/2 18:002009/8/3 0:002009/8/3 6:002009/8/3 12:002009/8/3 18:002009/8/4 0:00Source: <strong>Kigali</strong> Institute of Science and Technology, 2009Thanks <strong>to</strong> the KIST newly <strong>in</strong>stalled air pollutants m<strong>on</strong>i<strong>to</strong>r<strong>in</strong>g mach<strong>in</strong>e, now it is known that theexact situati<strong>on</strong> of air polluti<strong>on</strong> of <strong>Kigali</strong> City from 2009 is known. The below is the data set <strong>on</strong>ground-level oz<strong>on</strong>e measured <strong>on</strong> KIST campus. The follow<strong>in</strong>g figures show the general trends ofoz<strong>on</strong>e between 2009 and February 2011.
14-Jun-0921-Jun-0928-Jun-095-Jul-0912-Jul-0919-Jul-0926-Jul-092-Aug-099-Aug-0916-Aug-0923-Aug-0930-Aug-096-Sep-0913-Sep-0920-Sep-0927-Sep-094-Oct-0911-Oct-0918-Oct-0925-Oct-091-Nov-098-Nov-0915-Nov-0922-Nov-0929-Nov-096-Dec-0913-Dec-0920-Dec-0927-Dec-093-Jan-1010-Jan-1017-Jan-1024-Jan-1031-Jan-107-Feb-1014-Feb-1021-Feb-1028-Feb-107-Mar-1014-Mar-1021-Mar-1028-Mar-104-Apr-1011-Apr-1018-Apr-1025-Apr-102-May-109-May-1016-May-1023-May-1030-May-106-Jun-1013-Jun-1020-Jun-1027-Jun-104-Jul-1011-Jul-1018-Jul-1025-Jul-101-Aug-108-Aug-1015-Aug-1022-Aug-10Oz<strong>on</strong>e (ppb)93Figure 29: L<strong>on</strong>g-term Oz<strong>on</strong>e (O 3 ) c<strong>on</strong>centrati<strong>on</strong> <strong>with</strong><strong>in</strong> <strong>Kigali</strong> City160140120100806040200Source: <strong>Kigali</strong> Institute of Science and Technology, 2010The blue l<strong>in</strong>e illustrates 0.075ppm, the level of United States-Envir<strong>on</strong>mental Protecti<strong>on</strong> Agency(US-EPA) envir<strong>on</strong>mental standard of ground-level oz<strong>on</strong>e. In short, we can summarize that In <strong>Kigali</strong>City, especially dur<strong>in</strong>g the dry seas<strong>on</strong>, the c<strong>on</strong>centrati<strong>on</strong> of ground-level oz<strong>on</strong>e is already bey<strong>on</strong>dthe major envir<strong>on</strong>mental standards, and the problem of air polluti<strong>on</strong> is already at present (Mi<strong>to</strong>,2010). When c<strong>on</strong>sider<strong>in</strong>g the scale of <strong>in</strong>dustrial activities <strong>in</strong> <strong>Kigali</strong>, we can assume that the primarysource of this polluti<strong>on</strong> is mo<strong>to</strong>r vehicle exhaust especially caused by bad ma<strong>in</strong>tenance of itsemissi<strong>on</strong> c<strong>on</strong>trol. However, the weather patterns play an important role <strong>in</strong> establish<strong>in</strong>g c<strong>on</strong>diti<strong>on</strong>sc<strong>on</strong>ducive <strong>to</strong> oz<strong>on</strong>e formati<strong>on</strong> and accumulati<strong>on</strong>, as well as c<strong>on</strong>diti<strong>on</strong>s term<strong>in</strong>at<strong>in</strong>g oz<strong>on</strong>e episodes.Many scientists agreed that meteorological c<strong>on</strong>diti<strong>on</strong>s determ<strong>in</strong>e whether oz<strong>on</strong>e and/or itsprecursors will be reta<strong>in</strong>ed locally, (stagnant air masses) or will be transported downw<strong>in</strong>d. Hightemperatures enhance the rate of oz<strong>on</strong>e formati<strong>on</strong>. Some processes such as mov<strong>in</strong>g high pressuresystems, can disperse oz<strong>on</strong>e and transport it <strong>to</strong> or from higher layers <strong>in</strong> the atmosphere.As implicati<strong>on</strong>s <strong>to</strong> human health <strong>in</strong> <strong>Kigali</strong> City, people <strong>with</strong> lung disease, children, older adults, andpeople who are active can be affected when oz<strong>on</strong>e levels are unhealthy like it is the case <strong>in</strong> <strong>Kigali</strong>.Numerous scientific studies have l<strong>in</strong>ked ground-level oz<strong>on</strong>e exposure <strong>to</strong> a variety of problems,
94<strong>in</strong>clud<strong>in</strong>g: airway irritati<strong>on</strong>, cough<strong>in</strong>g, and pa<strong>in</strong> when tak<strong>in</strong>g a deep breath; wheez<strong>in</strong>g and breath<strong>in</strong>gdifficulties dur<strong>in</strong>g exercise or outdoor activities; <strong>in</strong>flammati<strong>on</strong>, which is much like a sunburn <strong>on</strong> thesk<strong>in</strong>; aggravati<strong>on</strong> of asthma and <strong>in</strong>creased susceptibility <strong>to</strong> respira<strong>to</strong>ry illnesses like pneum<strong>on</strong>iaand br<strong>on</strong>chitis; and, permanent lung damage <strong>with</strong> repeated exposures (US-EPA, 2011).Therefore, comprehensive measures must be taken <strong>to</strong> tackle <strong>with</strong> this issue. For example,<strong>in</strong>stallati<strong>on</strong> of an <strong>in</strong>specti<strong>on</strong> system <strong>on</strong> mo<strong>to</strong>r vehicle exhaust, establishment of regulati<strong>on</strong>s <strong>on</strong> caremissi<strong>on</strong> and air polluti<strong>on</strong> envir<strong>on</strong>mental standards, tax <strong>in</strong>centive <strong>in</strong>troducti<strong>on</strong> for importati<strong>on</strong> ofenvir<strong>on</strong>mentally friendly cars, re<strong>in</strong>forcement of air polluti<strong>on</strong> m<strong>on</strong>i<strong>to</strong>r<strong>in</strong>g system would be essential.Although tak<strong>in</strong>g the above measures would be very costly more air polluti<strong>on</strong> m<strong>on</strong>i<strong>to</strong>r<strong>in</strong>g systems <strong>in</strong><strong>Kigali</strong> <strong>in</strong> order <strong>to</strong> m<strong>on</strong>i<strong>to</strong>r the air polluti<strong>on</strong> properly), we should start someth<strong>in</strong>g now <strong>to</strong> preventsevere c<strong>on</strong>sequences (Mi<strong>to</strong>, 2010).7.2.6. Lead (Pb)Lead released from mo<strong>to</strong>r vehicle exhaust may affect human populati<strong>on</strong>s by direct <strong>in</strong>halati<strong>on</strong>, <strong>in</strong>which case people liv<strong>in</strong>g nearest <strong>to</strong> highways are at greatest risk. Lead can be <strong>in</strong>gested also after itis deposited <strong>on</strong> <strong>to</strong> foodstuffs. Measurements made <strong>in</strong> exposed communities <strong>in</strong>dicate that leadc<strong>on</strong>centrati<strong>on</strong> of 1μg/m 3 <strong>in</strong> ambient air results <strong>in</strong> an <strong>in</strong>crease of about 1-2 μg per decilitre (μg/dl) <strong>in</strong>blood. Lead pois<strong>on</strong><strong>in</strong>g can cause destructive behavioral changes, learn<strong>in</strong>g disabilities and
95permanent bra<strong>in</strong> damage. Children and pregnant women are at greatest risk. Blood levels of 50–60μg/dl are associated <strong>with</strong> neurobehavioral changes <strong>in</strong> children. Ingabire (2009), c<strong>on</strong>cluded that thePb level <strong>in</strong> the aerosols <strong>in</strong> <strong>Kigali</strong> City is below the World Health Organizati<strong>on</strong> (WHO, 0.5-1.5µg/m 3 )and East African Community recommended levels (0.5-1.0µg/m 3 ). Accord<strong>in</strong>g <strong>to</strong> her, the air quality<strong>in</strong> <strong>Rwanda</strong> is still at a favourable level as compared <strong>to</strong> most countries <strong>in</strong> the world, but the<strong>in</strong>dustrial activities and traffic density c<strong>on</strong>t<strong>in</strong>ue <strong>to</strong> grow.7.3. Strategies for reduc<strong>in</strong>g air polluti<strong>on</strong>7.3.1. Strategic approachesThe development of a strategy <strong>in</strong>volves the selecti<strong>on</strong> of a coherent set of measures which, taken<strong>to</strong>gether, will reduce the emissi<strong>on</strong>s of transport pollutants. These measures can be technologyoriented,target<strong>in</strong>g the vehicles and fuels used and ma<strong>in</strong>tenance practices <strong>with</strong><strong>in</strong> the sec<strong>to</strong>r, or theycan be behavioral, seek<strong>in</strong>g <strong>to</strong> reduce (or prevent <strong>in</strong>creases <strong>in</strong>) the amount of activity of the mostpollut<strong>in</strong>g vehicles. They may also focus <strong>on</strong> systemic aspects of the transport system–ways <strong>in</strong> whichthe transport network <strong>in</strong>fluences either the aggregate amount of vehicle use or the emissi<strong>on</strong>s<strong>in</strong>tensity of <strong>in</strong>dividual vehicles. Emissi<strong>on</strong> c<strong>on</strong>trol strategies for the transport sec<strong>to</strong>r should bedeterm<strong>in</strong>ed <strong>in</strong> the broader c<strong>on</strong>text of improv<strong>in</strong>g outdoor air quality <strong>in</strong> an urban regi<strong>on</strong>. This <strong>in</strong>volvesimportant ec<strong>on</strong>omic technical analysis <strong>in</strong> the c<strong>on</strong>text of air quality management programmers.Different programmers such as the World Bank’s <strong>Air</strong> Quality Management System are useful <strong>in</strong>identify<strong>in</strong>g the most efficient use of scarce resources <strong>to</strong> address an air quality problem.However, the process of carry<strong>in</strong>g out such an assessment tends <strong>to</strong> be quantitative; <strong>in</strong>terventi<strong>on</strong>swhose costs or benefits are not easily quantified tend <strong>to</strong> be discounted. The assessment also tends<strong>to</strong> be static <strong>in</strong> its analytical approach, not tak<strong>in</strong>g <strong>in</strong><strong>to</strong> account potential changes <strong>in</strong> demand overtime. C<strong>on</strong>sequently, it often does not take <strong>in</strong><strong>to</strong> account systemic changes that can <strong>in</strong>fluence thischange <strong>in</strong> demand. These limitati<strong>on</strong>s should be borne <strong>in</strong> m<strong>in</strong>d <strong>in</strong> devis<strong>in</strong>g an effective emissi<strong>on</strong>sstrategy <strong>with</strong> regard <strong>to</strong> transport.
967.3.1.1. Technical strategiesTechnical approaches seek <strong>to</strong> reduce the emissi<strong>on</strong>s produced by road vehicles us<strong>in</strong>g the transportsystem by <strong>in</strong>terven<strong>in</strong>g <strong>with</strong> the vehicles be<strong>in</strong>g used and the fuels they are burn<strong>in</strong>g. By def<strong>in</strong>iti<strong>on</strong>,these approaches address per unit emissi<strong>on</strong>s rather than the amount of activity caus<strong>in</strong>g theemissi<strong>on</strong>s. An exclusively technological approach may be <strong>in</strong>sufficient <strong>to</strong> address the growth <strong>in</strong>emissi<strong>on</strong>s, for a number of reas<strong>on</strong>s. First, growth <strong>in</strong> activity c<strong>on</strong>t<strong>in</strong>uously puts pressure <strong>on</strong>technology ga<strong>in</strong>s. Sec<strong>on</strong>dly, technological improvements can exacerbate the growth <strong>in</strong> activitythrough the much-debated “rebound” effect. Thirdly, an exclusively technological approach <strong>to</strong>address<strong>in</strong>g the problem of emissi<strong>on</strong>s may result <strong>in</strong> significant over-<strong>in</strong>vestment <strong>in</strong> technologycompared <strong>with</strong> a socially optimum soluti<strong>on</strong> (that is, <strong>on</strong>e which would result if a pure tax <strong>on</strong> missi<strong>on</strong>swere implemented).7.3.1.2. Vehicle technologyChang<strong>in</strong>g or improv<strong>in</strong>g technology: Technological improvements <strong>to</strong> vehicles are limited by localcapacity <strong>to</strong> absorb the technology, which <strong>in</strong>cludes both turnover rates and capabilities for servic<strong>in</strong>gand ma<strong>in</strong>tenance, and by the availability of appropriate fuel for the technology. C<strong>on</strong>sequently,vehicle technology strategies need <strong>to</strong> be developed <strong>in</strong> resp<strong>on</strong>se <strong>to</strong> particular local circumstancesand <strong>in</strong> c<strong>on</strong>cert <strong>with</strong> fuel strategies. These strategies may <strong>in</strong>volve improvements <strong>in</strong> c<strong>on</strong>venti<strong>on</strong>altechnologies already <strong>in</strong> widespread use–such as improvements <strong>to</strong> eng<strong>in</strong>e and fuel systems, betteror more widespread use of gasol<strong>in</strong>e or diesel exhaust after treatments, changes and improvements<strong>to</strong> transmissi<strong>on</strong> systems (<strong>to</strong> <strong>in</strong>crease efficiency and reduce CO2 emissi<strong>on</strong>s), treatment for fuelsupply and crankcase systems (<strong>to</strong> reduce evaporative emissi<strong>on</strong>s), or improvements <strong>to</strong> overallvehicle or tyre design <strong>to</strong> reduce fricti<strong>on</strong>. Technological improvements might also <strong>in</strong>volve theadopti<strong>on</strong> and use of alternative fuel or alternative propulsi<strong>on</strong> vehicles. In develop<strong>in</strong>g countries, themost comm<strong>on</strong>ly discussed alternative vehicle strategies <strong>in</strong>clude compressed natural gas (CNG),liquefied petroleum gas (LPG), alcohol-based fuels, and electric propulsi<strong>on</strong> or hybrid-electricvehicles <strong>in</strong> certa<strong>in</strong> applicati<strong>on</strong>s. Other alternative fuels show<strong>in</strong>g potential l<strong>on</strong>g-term promise <strong>in</strong> thetransport sec<strong>to</strong>r <strong>in</strong>clude hydrogen fuel cells and various synthetic fuels for use <strong>in</strong> compressi<strong>on</strong>igniti<strong>on</strong>eng<strong>in</strong>es.
97Rate of change of technology <strong>in</strong> the vehicle fleet: An extensive review of appropriatetechnologies <strong>in</strong> the emissi<strong>on</strong>s-reducti<strong>on</strong> literature and at c<strong>on</strong>ferences can often mask theunderly<strong>in</strong>g importance of the rate of change of technology. Over the short and medium term, therate of change is more important than the technology itself for reduc<strong>in</strong>g transport emissi<strong>on</strong>s,particularly for fleets where basel<strong>in</strong>e emissi<strong>on</strong>s c<strong>on</strong>trol mechanisms are m<strong>in</strong>imal or n<strong>on</strong>-existent.In assess<strong>in</strong>g any technology, therefore, the analysis of technological opti<strong>on</strong>s needs <strong>to</strong> movebey<strong>on</strong>d a narrow assessment of the relative emissi<strong>on</strong>s and energy c<strong>on</strong>sumpti<strong>on</strong> capabilities ofeach technology; rather, the analysis should focus <strong>on</strong> how rapidly the different technologies can bedeployed and widely used <strong>in</strong> the fleet. The rate of change of technology can be <strong>in</strong>fluenced byencourag<strong>in</strong>g vehicle turnover, ideally through well-designed adjustments <strong>to</strong> the fiscal regime underwhich cars are taxed over their lifetimes, or through vehicle retrofitt<strong>in</strong>g programmers’, which allowolder vehicles <strong>to</strong> benefit from more recent technology. The organizati<strong>on</strong>al and technical logistics ofretrofit programmes are substantially different, depend<strong>in</strong>g <strong>on</strong> whether gasol<strong>in</strong>e or diesel vehiclesand <strong>in</strong>dividual or fleet owners are targeted.Vehicle ma<strong>in</strong>tenance: Vehicle ma<strong>in</strong>tenance is a crucial part of any technical strategy <strong>to</strong> reduceper kilometer emissi<strong>on</strong>s of pollutants, both because the proporti<strong>on</strong> of <strong>in</strong>-use vehicles is substantialcompared <strong>with</strong> new vehicles <strong>in</strong> any given year, and because of the vigilance required <strong>to</strong> ensurethat exhaust after-treatment technology is well ma<strong>in</strong>ta<strong>in</strong>ed and rema<strong>in</strong>s functi<strong>on</strong>al. The pr<strong>in</strong>cipallogistical problem is design<strong>in</strong>g cost-effective measures that ensure that the vehicles most <strong>in</strong> needof ma<strong>in</strong>tenance actually receive it. Programmes tend <strong>to</strong> be most cost-effective when they target“gross-emitters”, those 20 per cent of vehicles that tend <strong>to</strong> produce 80 per cent of the polluti<strong>on</strong>,accord<strong>in</strong>g <strong>to</strong> the rule of thumb that applies <strong>to</strong> cities <strong>in</strong> developed as well as develop<strong>in</strong>g countries.Effective strategies focus<strong>in</strong>g <strong>on</strong> vehicle ma<strong>in</strong>tenance have three key elements: Emissi<strong>on</strong>s test<strong>in</strong>g, which provides a mechanism <strong>to</strong> identify vehicles that are notperform<strong>in</strong>g accord<strong>in</strong>g <strong>to</strong> regulati<strong>on</strong>s; Driver and fleet manager educati<strong>on</strong> and tra<strong>in</strong><strong>in</strong>g, which is important <strong>in</strong> facilitat<strong>in</strong>g theacceptance of emissi<strong>on</strong>s test<strong>in</strong>g comp<strong>on</strong>ents, such as <strong>in</strong>specti<strong>on</strong> and ma<strong>in</strong>tenanceprogrammes, and because such tra<strong>in</strong><strong>in</strong>g can specifically target high-kilometre drivers;
98 A programme of <strong>on</strong>go<strong>in</strong>g product liability, for either manufacturers or importers, whichmight also help <strong>to</strong> ensure better ma<strong>in</strong>tenance by creat<strong>in</strong>g a market <strong>in</strong>centive for suppliers<strong>to</strong> follow up <strong>on</strong> their products.7.3.1.3. Fuel technologyImprovements <strong>to</strong> the specificati<strong>on</strong>s of fuels are as important as improvements <strong>to</strong> vehicles. Fuelimprovements can affect emissi<strong>on</strong>s <strong>in</strong> three ways. First, changes <strong>to</strong> fuel c<strong>on</strong>tent can directly br<strong>in</strong>gabout a reducti<strong>on</strong> <strong>in</strong> emissi<strong>on</strong>s of certa<strong>in</strong> pollutants, such as lead, sulphates, oxides of sulphur(SOx), or VOCs. Unlike changes <strong>to</strong> vehicle technology, the effects of these types of fuel c<strong>on</strong>tentchanges are immediate. Sec<strong>on</strong>dly, changes <strong>in</strong> fuel c<strong>on</strong>tent can facilitate the use of certa<strong>in</strong> exhaustafter-treatment technologies–particularly those us<strong>in</strong>g plat<strong>in</strong>um -based catalysts–which would nothave been usable before. Thirdly, the costs of these improvements are passed <strong>on</strong> <strong>to</strong> the c<strong>on</strong>sumerbut, unlike the costs for technical improvements <strong>to</strong> vehicles, these costs are passed <strong>on</strong> as variablerather than fixed costs. This is compatible <strong>with</strong> a strategy aimed at variabiliz<strong>in</strong>g costs as much aspossible.7.3.1.4. Systemic strategiesSystemic approaches <strong>to</strong> air quality focus <strong>on</strong> the transport network, seek<strong>in</strong>g <strong>to</strong> adjust driv<strong>in</strong>gc<strong>on</strong>diti<strong>on</strong>s so as <strong>to</strong> enable vehicles <strong>to</strong> operate <strong>in</strong> the least emissi<strong>on</strong>s-<strong>in</strong>tensive manner possible.Such a goal can <strong>in</strong>volve <strong>in</strong>creas<strong>in</strong>g average speeds <strong>to</strong> an optimal level (ord<strong>in</strong>arily between 65 and90 kilometers per hour for most pollutants, <strong>in</strong>clud<strong>in</strong>g CO2), or “smooth<strong>in</strong>g” flow, so as <strong>to</strong> reduce thevariability of speeds and elim<strong>in</strong>ate the need <strong>to</strong> accelerate or decelerate. In practice, smooth<strong>in</strong>g flowand <strong>in</strong>creas<strong>in</strong>g average speeds are often <strong>in</strong>separable practical outcomes of the same eng<strong>in</strong>eer<strong>in</strong>g<strong>in</strong>terventi<strong>on</strong>s. Increas<strong>in</strong>g average speeds <strong>on</strong> a road network, however, is also associated <strong>with</strong> thephenomen<strong>on</strong> of <strong>in</strong>duced traffic, that is, an <strong>in</strong>crease <strong>in</strong> mo<strong>to</strong>r vehicle use occurr<strong>in</strong>g <strong>in</strong> resp<strong>on</strong>se <strong>to</strong>an improvement <strong>in</strong> mo<strong>to</strong>r vehicle traffic c<strong>on</strong>diti<strong>on</strong>s. Induced traffic means that, at the very least, theemissi<strong>on</strong>s-rate reducti<strong>on</strong>s from smoother flow need <strong>to</strong> be weighed aga<strong>in</strong>st an <strong>in</strong>crease <strong>in</strong> overallemissi<strong>on</strong>s from more traffic. This balanc<strong>in</strong>g suggests two potentially different systemic strategiesfor air quality purposes: smooth<strong>in</strong>g flow <strong>on</strong> the <strong>on</strong>e hand, and restra<strong>in</strong><strong>in</strong>g traffic <strong>on</strong> the other hand.In this c<strong>on</strong>text, the market, through c<strong>on</strong>gesti<strong>on</strong> pric<strong>in</strong>g, would be more able <strong>to</strong> “choose” betweenthese compet<strong>in</strong>g and c<strong>on</strong>flict<strong>in</strong>g strategic approaches than could any eng<strong>in</strong>eer<strong>in</strong>g assessment.
997.3.1.5. Role of <strong>in</strong>ternati<strong>on</strong>al communityThe <strong>in</strong>ternati<strong>on</strong>al community, through various arms of the United Nati<strong>on</strong>s, the multilateraldevelopment banks, and bilateral aid agencies, has helped cities <strong>in</strong> develop<strong>in</strong>g countries <strong>to</strong>address transportati<strong>on</strong> emissi<strong>on</strong>s through a number of different programmes. This aid has beensuccessful <strong>to</strong> a vary<strong>in</strong>g extent, although not always cohesive, and not necessarily comprehensive.Much of the substantive work <strong>in</strong> regi<strong>on</strong>s <strong>with</strong> particularly alarm<strong>in</strong>g air quality has focused <strong>on</strong>assistance <strong>with</strong> assessment and ec<strong>on</strong>omic evaluati<strong>on</strong> of the problem, <strong>in</strong>clud<strong>in</strong>g prioritizati<strong>on</strong> of<strong>in</strong>vestments for air quality mitigati<strong>on</strong>. A number of crucial needs, however, are still under-served bythe <strong>in</strong>ternati<strong>on</strong>al community. In general, these needs <strong>in</strong>volve <strong>in</strong>stituti<strong>on</strong>al development, <strong>in</strong>tegrati<strong>on</strong>of envir<strong>on</strong>mental criteria <strong>in</strong><strong>to</strong> transport and urban plann<strong>in</strong>g, and support for l<strong>on</strong>g-run assessmentsof alternative <strong>in</strong>vestment scenarios.8. Exist<strong>in</strong>g Policy Framework8.1. <strong>Air</strong> polluti<strong>on</strong> policies and regulati<strong>on</strong>s <strong>in</strong> <strong>Rwanda</strong>Like most other countries <strong>in</strong> the world, <strong>Rwanda</strong> is dependent <strong>on</strong> oil products for a wide range ofactivities, notably transport, electricity generati<strong>on</strong>, <strong>in</strong>dustry, cook<strong>in</strong>g and light<strong>in</strong>g (MININFRA, 2004).Oil-based energy generati<strong>on</strong> not <strong>on</strong>ly is it an expensive exercise, but <strong>on</strong>e of the str<strong>on</strong>genvir<strong>on</strong>mentally unfriendly undertak<strong>in</strong>gs ow<strong>in</strong>g <strong>to</strong> its carb<strong>on</strong> dioxide emissi<strong>on</strong>s <strong>in</strong><strong>to</strong> the atmosphere.As we all know this c<strong>on</strong>tributes str<strong>on</strong>gly <strong>to</strong> global climate change (http://www.newtimes.co.rw).In <strong>Rwanda</strong>, urban air polluti<strong>on</strong> result<strong>in</strong>g from dust particles and vehicle emissi<strong>on</strong> is <strong>in</strong>creas<strong>in</strong>glygrow<strong>in</strong>g. Dur<strong>in</strong>g the dry seas<strong>on</strong>, there is a marked <strong>in</strong>crease <strong>in</strong> air borne diseases due <strong>to</strong> dustparticles emissi<strong>on</strong> especially <strong>in</strong> urban areas (<strong>REMA</strong>, 2009). Poorly ma<strong>in</strong>ta<strong>in</strong>ed roads, old mopeds,mo<strong>to</strong>rcycles and vehicles cause an <strong>in</strong>creas<strong>in</strong>g c<strong>on</strong>centrati<strong>on</strong> of different air pollutants (Henn<strong>in</strong>ger,2009). In the recent years the number of vehicles has tremendously <strong>in</strong>creased especially <strong>in</strong> <strong>Kigali</strong>City, where also the number of people rapidly <strong>in</strong>creases. The <strong>in</strong>crease <strong>in</strong> number of vehicle <strong>in</strong><strong>Kigali</strong> City implies the <strong>in</strong>crease <strong>in</strong> exhausts emitted by these and subsequently <strong>in</strong>crease <strong>in</strong> risksassociated <strong>with</strong> the emissi<strong>on</strong>s while documented <strong>in</strong>formati<strong>on</strong> <strong>on</strong> this issue is still lack<strong>in</strong>g (<strong>REMA</strong>,2009). It was found that air polluti<strong>on</strong> <strong>in</strong> <strong>Kigali</strong> has reached an <strong>in</strong>credible level as the c<strong>on</strong>centrati<strong>on</strong>of some air pollutants of is far above those recommended by the World Health Organizati<strong>on</strong>(WHO).
100Particularly, the particle matter c<strong>on</strong>centrati<strong>on</strong> <strong>in</strong> the air suggests that air polluti<strong>on</strong> creates a greatrisk <strong>to</strong> the <strong>in</strong>habitants’ health. The meteorological c<strong>on</strong>diti<strong>on</strong>s <strong>in</strong> <strong>Kigali</strong> City further c<strong>on</strong>tribute <strong>to</strong> thishealth risk due <strong>to</strong> an expected higher stability of the urban atmosphere. This results <strong>in</strong> a lowertransportati<strong>on</strong> and dispersi<strong>on</strong> of polluted air, hence caus<strong>in</strong>g accumulati<strong>on</strong> of the airborne polluti<strong>on</strong>s<strong>with</strong><strong>in</strong> the small valleys and the residential areas respectively (Henn<strong>in</strong>ger, 2009). Apart from thetraffic emissi<strong>on</strong>s, there is also another source of air polluti<strong>on</strong> representative for develop<strong>in</strong>g world:the usage of simple s<strong>to</strong>ves and open fireplaces. Burn<strong>in</strong>g wood for domestic energy, cook<strong>in</strong>g andhousehold everyday jobs produce a lot of emissi<strong>on</strong>, <strong>in</strong>door and outdoor (Han and Naeher, 2006) <strong>in</strong><strong>Kigali</strong> City.Despite this c<strong>on</strong>cern, there has been so far no comprehensive <str<strong>on</strong>g>study</str<strong>on</strong>g> that relates diseases such aslung cancer <strong>with</strong> air polluti<strong>on</strong> caused by emissi<strong>on</strong>s from vehicles. The polluti<strong>on</strong> levels and possiblecauses of air polluti<strong>on</strong> <strong>with</strong> possible measures <strong>in</strong> case of high levels of polluti<strong>on</strong> is also not wellm<strong>on</strong>i<strong>to</strong>red nor known <strong>in</strong> <strong>Kigali</strong> City (Henn<strong>in</strong>ger, 2009). The situati<strong>on</strong> is complicated by the lack ofair quality standards that would serve as a basis <strong>to</strong> enforce certa<strong>in</strong> measures that would help <strong>to</strong>c<strong>on</strong>trol emissi<strong>on</strong>s. This is particularly challeng<strong>in</strong>g s<strong>in</strong>ce it calls for heavy <strong>in</strong>vestments <strong>in</strong> physical<strong>in</strong>frastructure and clear policy framework <strong>to</strong> c<strong>on</strong>trol air polluti<strong>on</strong> <strong>in</strong> <strong>Kigali</strong> City.8.2. Multilateral agreements and <strong>in</strong>ternati<strong>on</strong>al c<strong>on</strong>venti<strong>on</strong>sFrom Internati<strong>on</strong>al perspective, <strong>Rwanda</strong> has already signed the Multilateral Agreements <strong>in</strong>clud<strong>in</strong>gthe Kyo<strong>to</strong> Pro<strong>to</strong>col, United Nati<strong>on</strong>s Framework C<strong>on</strong>venti<strong>on</strong> <strong>on</strong> Climate Change (UNFCCC) and theVienna C<strong>on</strong>venti<strong>on</strong>. The Kyo<strong>to</strong> Pro<strong>to</strong>col <strong>to</strong> the United Nati<strong>on</strong>s Framework C<strong>on</strong>venti<strong>on</strong> <strong>on</strong> ClimateChange strengthens the <strong>in</strong>ternati<strong>on</strong>al resp<strong>on</strong>se <strong>to</strong> climate change, and promotes the C<strong>on</strong>venti<strong>on</strong>'sultimate objective of prevent<strong>in</strong>g "dangerous anthropogenic [human-made] <strong>in</strong>terference <strong>with</strong> theclimate system"; The United Nati<strong>on</strong>s Framework C<strong>on</strong>venti<strong>on</strong> <strong>on</strong> Climate Change (UNFCCC)refers <strong>to</strong> the <strong>in</strong>ternati<strong>on</strong>al agreement that targets <strong>in</strong>dustrial and other emissi<strong>on</strong>s of greenhousegases such as carb<strong>on</strong> dioxide. The UNFCC is the centerpiece of global efforts <strong>to</strong> combat globalwarm<strong>in</strong>g. Initially adopted <strong>in</strong> 1992 at the Rio de Janeiro "Earth Summit"(http://www.un.org/gen<strong>in</strong>fo/bp/enviro.html), the C<strong>on</strong>venti<strong>on</strong> entered <strong>in</strong><strong>to</strong> force <strong>on</strong> March 21, 1994.The ultimate objective of the UNFCC is the "stabilizati<strong>on</strong> of greenhouse gas c<strong>on</strong>centrati<strong>on</strong>s <strong>in</strong> theatmosphere at a level that would prevent dangerous anthropogenic (human-made) <strong>in</strong>terference
101<strong>with</strong> the climate system. Such a level should be achieved <strong>with</strong><strong>in</strong> a time-frame sufficient <strong>to</strong> allowecosystems <strong>to</strong> adapt naturally <strong>to</strong> climate change, <strong>to</strong> ensure that food producti<strong>on</strong> is not threatenedand <strong>to</strong> enable ec<strong>on</strong>omic development <strong>to</strong> proceed <strong>in</strong> a susta<strong>in</strong>able manner. The ViennaC<strong>on</strong>venti<strong>on</strong> refers <strong>to</strong> the United Nati<strong>on</strong>s Envir<strong>on</strong>ment Program’s (UNEP) C<strong>on</strong>venti<strong>on</strong> <strong>on</strong> theProtecti<strong>on</strong> of the Oz<strong>on</strong>e Layer, adopted by the governments of the world <strong>in</strong> 1985. Through theVienna C<strong>on</strong>venti<strong>on</strong> <strong>on</strong> the Protecti<strong>on</strong> of the Oz<strong>on</strong>e Layer, governments committed themselves <strong>to</strong>protect the oz<strong>on</strong>e layer, <strong>to</strong> cooperate <strong>in</strong> scientific research, and <strong>to</strong> improve the understand<strong>in</strong>g ofatmospheric processes Under the C<strong>on</strong>venti<strong>on</strong>, nati<strong>on</strong>s agree <strong>to</strong> take "appropriate measures…<strong>to</strong>protect human health and the envir<strong>on</strong>ment aga<strong>in</strong>st adverse effects result<strong>in</strong>g or likely <strong>to</strong> result fromhuman activities which modify or are likely <strong>to</strong> modify the Oz<strong>on</strong>e Layer." The measures areunspecified. There is no menti<strong>on</strong> of any substances that might harm the oz<strong>on</strong>e; CFCs appear<strong>to</strong>wards the end of the annex <strong>to</strong> the treaty, where they are menti<strong>on</strong>ed as chemicals that should bem<strong>on</strong>i<strong>to</strong>red.8.3. Local policies, laws, programs and strategiesWith the rapid urban development of <strong>Kigali</strong> City and the result<strong>in</strong>g <strong>in</strong>crease <strong>in</strong> air polluti<strong>on</strong>, the<strong>Rwanda</strong>’s Government is locally act<strong>in</strong>g by develop<strong>in</strong>g l<strong>on</strong>g term orientati<strong>on</strong>s, policies, laws,programs and strategies <strong>to</strong> c<strong>on</strong>trol and reduce air polluti<strong>on</strong> and the associated human health risks.For example, the <strong>Rwanda</strong>’s Energy Policy of 2004 states that the petroleum operati<strong>on</strong>s should beundertaken by ensur<strong>in</strong>g highly established standards for envir<strong>on</strong>mental impact assessments andenvir<strong>on</strong>mental management plans will be manda<strong>to</strong>ry (MININFRA, 2004). The Article 81 of the<strong>Rwanda</strong> organic law <strong>on</strong> modalities of protecti<strong>on</strong>, c<strong>on</strong>servati<strong>on</strong> and promoti<strong>on</strong> of the envir<strong>on</strong>mentdoes not allow any activity that may damag<strong>in</strong>g the quality of air, n<strong>on</strong> authorised bush burn<strong>in</strong>g; andas well as the smok<strong>in</strong>g <strong>in</strong> public and <strong>in</strong> any other place where many people meet. It is alsoprohibited <strong>to</strong> release <strong>in</strong><strong>to</strong> the atmosphere pois<strong>on</strong>ous gases, smoke, waste, soot, dust and anyother chemical substances <strong>in</strong> an illegal manner (Government of <strong>Rwanda</strong>, 2005). <strong>Rwanda</strong>’s efforts<strong>in</strong> reduc<strong>in</strong>g its reliance <strong>on</strong> oil are supported through the development of Clean DevelopmentMechanism Projects – which means, for every certified reducti<strong>on</strong> of emissi<strong>on</strong>s of carb<strong>on</strong> dioxide,we ga<strong>in</strong> <strong>on</strong> what is referred <strong>to</strong> as carb<strong>on</strong> credits and subsequently generate revenues through thesale of those carb<strong>on</strong> credits <strong>on</strong> the global market (MININFRA, 2008) .
102Recently, <strong>Rwanda</strong> is support<strong>in</strong>g the efforts of the <strong>in</strong>ternati<strong>on</strong>al community which c<strong>on</strong>tribute <strong>to</strong> thereducti<strong>on</strong> and elim<strong>in</strong>ati<strong>on</strong> of the c<strong>on</strong>sumpti<strong>on</strong> and producti<strong>on</strong> of substances likely <strong>to</strong> deplete theoz<strong>on</strong>e. In this regard, <strong>REMA</strong> has undertaken some of the follow<strong>in</strong>g activities: preparati<strong>on</strong> <strong>in</strong>collaborati<strong>on</strong> <strong>with</strong> RBS of standards <strong>on</strong> air quality; guidance <strong>on</strong> polluti<strong>on</strong> c<strong>on</strong>trol and promoti<strong>on</strong> ofthe Cleaner Producti<strong>on</strong> Programme. Cleaner Producti<strong>on</strong> is applied <strong>to</strong> the entire producti<strong>on</strong> cycle <strong>to</strong><strong>in</strong>crease productivity by ensur<strong>in</strong>g a more efficient use of raw materials, <strong>to</strong> promote betterenvir<strong>on</strong>mental performance through reducti<strong>on</strong> at source of emissi<strong>on</strong>s. More than 10 <strong>Rwanda</strong>n<strong>in</strong>dustries participate <strong>in</strong> Cleaner Producti<strong>on</strong>. The recent publicati<strong>on</strong> of air quality emissi<strong>on</strong>s by the<strong>Rwanda</strong> Bureau of Standards will play a key role <strong>in</strong> the emissi<strong>on</strong>s c<strong>on</strong>trol and enforcement of thelaws (Government of <strong>Rwanda</strong>, 2010). In transport sec<strong>to</strong>r, the Police’s Mo<strong>to</strong>r Vehicle Inspecti<strong>on</strong>Centre (MIC), has recently <strong>in</strong>troduced eng<strong>in</strong>e gas emissi<strong>on</strong> <strong>in</strong>specti<strong>on</strong> <strong>to</strong> the already exist<strong>in</strong>g testsit carries out. The new <strong>in</strong>specti<strong>on</strong> will c<strong>on</strong>tribute <strong>to</strong> the country’s envir<strong>on</strong>mental protecti<strong>on</strong> efforts,s<strong>in</strong>ce vehicles that emit <strong>to</strong>xic gases will not be allowed <strong>to</strong> operate (RNP, 2011).8.4. Role of public transport plann<strong>in</strong>gIn <strong>Kigali</strong> City some problem of air polluti<strong>on</strong> are exaggerated by traffic management system. Sometraffic calm<strong>in</strong>g methods such as multiple speed reduc<strong>in</strong>g humps are found <strong>on</strong> certa<strong>in</strong> roads <strong>to</strong>reduce the speeds of vehicles especially <strong>in</strong> areas where there are tight corners and steepgradients. However, these are improperly designed and <strong>in</strong> many cases, ill-ma<strong>in</strong>ta<strong>in</strong>ed. With the<strong>in</strong>creases <strong>in</strong> private cars, vehicles are beg<strong>in</strong>n<strong>in</strong>g <strong>to</strong> cause c<strong>on</strong>gesti<strong>on</strong> at some important juncti<strong>on</strong>sand al<strong>on</strong>g the major roads. This is compounded by improper design of roads and juncti<strong>on</strong>s, as canbe seen <strong>in</strong> the case of the six-legged Centre Ville Roundabout where traffic c<strong>on</strong>gesti<strong>on</strong> occurspartly due <strong>to</strong> the fact that the approaches are <strong>to</strong>o close of each other.With the ec<strong>on</strong>omic growth that will br<strong>in</strong>g about new wealth <strong>to</strong> the people, it is anticipated that carownership will escalate <strong>in</strong> the future as it is the comm<strong>on</strong> aspirati<strong>on</strong> of the people <strong>in</strong> <strong>Rwanda</strong> <strong>to</strong> owna car. The <strong>in</strong>crease <strong>in</strong> car ownership and car usage is expected <strong>to</strong> put a stra<strong>in</strong> <strong>on</strong> the road network<strong>in</strong> the future, if left unchecked. This will also put a stra<strong>in</strong> <strong>to</strong> the government <strong>in</strong> gett<strong>in</strong>g fund<strong>in</strong>g <strong>to</strong> addmore road space and c<strong>on</strong>struct new roads <strong>to</strong> cater <strong>to</strong> the ever-<strong>in</strong>creas<strong>in</strong>g car populati<strong>on</strong> <strong>on</strong> theroad. To avoid the need <strong>to</strong> keep add<strong>in</strong>g road space <strong>with</strong><strong>in</strong> the City <strong>to</strong> cater <strong>to</strong> the travel demand <strong>in</strong>future, it is the aim of the Master Plan <strong>to</strong> put <strong>in</strong> place an efficient and c<strong>on</strong>venient public transport
103system <strong>with</strong><strong>in</strong> <strong>Kigali</strong> City <strong>to</strong> ensure that public transport will rema<strong>in</strong> as the preferred mode oftransport <strong>in</strong> the future and ma<strong>in</strong>ta<strong>in</strong> a modal split of 70:30 for public transport versus private cars.To achieve this, it is important <strong>to</strong> improve public transport facilities and services <strong>to</strong> make publictransport an efficient and c<strong>on</strong>venient mode of transport.To achieve this objective, the follow<strong>in</strong>g strategies are adopted <strong>in</strong> the plann<strong>in</strong>g of public transport <strong>in</strong>Nyarugenge District: develop an <strong>in</strong>tegrated and cost effective public transport system offer<strong>in</strong>gregi<strong>on</strong>al and local c<strong>on</strong>nectivity; develop bus <strong>in</strong>terchanges <strong>with</strong><strong>in</strong> <strong>to</strong>wnships which offer regi<strong>on</strong>al andlocal c<strong>on</strong>nectivity; Increase the carry<strong>in</strong>g capacity of public buses by phas<strong>in</strong>g out m<strong>in</strong>i-bus taxis and<strong>in</strong>troduc<strong>in</strong>g buses <strong>with</strong> higher capacity such as the l<strong>on</strong>g buses or articulated buses; and creatededicated bus lanes al<strong>on</strong>g major roads <strong>to</strong> ensure smooth flow<strong>in</strong>g of buses.In the present global trend <strong>to</strong>wards susta<strong>in</strong>able developments, green transport which <strong>in</strong>cludewalk<strong>in</strong>g and cycl<strong>in</strong>g will be promoted <strong>in</strong> the development of <strong>Kigali</strong> City. To encourage people <strong>to</strong>c<strong>on</strong>t<strong>in</strong>ue <strong>to</strong> cycle and walk for short distance commut<strong>in</strong>g, it is important <strong>to</strong> create a c<strong>on</strong>duciveenvir<strong>on</strong>ment for walk<strong>in</strong>g and cycl<strong>in</strong>g <strong>with</strong><strong>in</strong> the City. To this end, the follow<strong>in</strong>g strategies areadopted <strong>in</strong> the master plan: Develop a green c<strong>on</strong>nec<strong>to</strong>r network l<strong>in</strong>k<strong>in</strong>g all green areas <strong>with</strong><strong>in</strong> theCity; Provide dedicated pedestrian walkways and cycl<strong>in</strong>g paths al<strong>on</strong>g roads as well asneighborhoods and hous<strong>in</strong>g estates; and Provide facilities such as bicycle shed adjacent <strong>to</strong> bus<strong>in</strong>terchanges / term<strong>in</strong>als <strong>with</strong><strong>in</strong> the City where it is possible (MININFRA, 2009a).9. Towards urban air polluti<strong>on</strong> policy <strong>in</strong> <strong>Rwanda</strong>Whereas polluti<strong>on</strong> of the air <strong>in</strong> <strong>Rwanda</strong> will imperil public health and welfare, create public orprivate nuisances, be harmful <strong>to</strong> wildlife and impair domestic, agricultural, <strong>in</strong>dustrial, recreati<strong>on</strong>aland other beneficial uses; it is hereby declared <strong>to</strong> be the policy and purpose of this policy <strong>on</strong> airpolluti<strong>on</strong> <strong>to</strong> enable the government <strong>to</strong> prevent, reduce and elim<strong>in</strong>ate air polluti<strong>on</strong>; <strong>to</strong> preserve andenhance the air; <strong>to</strong> plan the development, use, reclamati<strong>on</strong>, preservati<strong>on</strong> and enhancement of theair, <strong>to</strong> preserve and exercise the primary resp<strong>on</strong>sibilities and rights of government; <strong>to</strong> reta<strong>in</strong> for thegovernment the c<strong>on</strong>trol over its air, and <strong>to</strong> secure cooperati<strong>on</strong> between different entities <strong>in</strong> carry<strong>in</strong>gout their objectives.
104Clean air can <strong>on</strong>ly be achieved through a susta<strong>in</strong>able mechanisms such as car emissi<strong>on</strong> <strong>in</strong>specti<strong>on</strong>and c<strong>on</strong>trol; oil quality <strong>in</strong>specti<strong>on</strong> and c<strong>on</strong>trol but also by provid<strong>in</strong>g some <strong>in</strong>centive measuresaim<strong>in</strong>g at encourag<strong>in</strong>g people <strong>to</strong> use and purchase what is known as “Green Cars” which have alow impact <strong>on</strong> the envir<strong>on</strong>ment.Bas<strong>in</strong>g <strong>on</strong> the organic law n° 04/2005 of 08/04/2005 determ<strong>in</strong><strong>in</strong>g the modalities of protecti<strong>on</strong>,c<strong>on</strong>servati<strong>on</strong> and promoti<strong>on</strong> of envir<strong>on</strong>ment <strong>in</strong> <strong>Rwanda</strong>, the government has the primary obligati<strong>on</strong><strong>to</strong> protect the envir<strong>on</strong>ment. The envir<strong>on</strong>ment <strong>in</strong> <strong>Rwanda</strong> c<strong>on</strong>stitutes a comm<strong>on</strong> nati<strong>on</strong>al heritage,the reas<strong>on</strong> why the government has <strong>to</strong> provide a basis (or standards) for protect<strong>in</strong>g public healthfrom adverse effects of envir<strong>on</strong>mental pollutants, and for elim<strong>in</strong>at<strong>in</strong>g or reduc<strong>in</strong>g <strong>to</strong> a m<strong>in</strong>imum,c<strong>on</strong>tam<strong>in</strong>ants that are known or likely <strong>to</strong> be hazardous <strong>to</strong> human health and well-be<strong>in</strong>g.Nevertheless, the objective of m<strong>on</strong>i<strong>to</strong>r<strong>in</strong>g of the air polluti<strong>on</strong> <strong>in</strong> <strong>Rwanda</strong> cannot be achievedeffectively by public and private entities that are act<strong>in</strong>g <strong>in</strong>dividually. In particular, as different entitiesc<strong>on</strong>tribute <strong>to</strong> the air polluti<strong>on</strong>; they should have collective resp<strong>on</strong>sibility <strong>to</strong> work hand <strong>in</strong> hand <strong>in</strong>solv<strong>in</strong>g the problems caused by the air polluti<strong>on</strong>.The government of <strong>Rwanda</strong> created different <strong>in</strong>stituti<strong>on</strong>s like RURA; RBS which, <strong>with</strong>out aim<strong>in</strong>gdirectly at the protecti<strong>on</strong> of envir<strong>on</strong>ment, their respective missi<strong>on</strong>s have <strong>in</strong>directly impact <strong>on</strong> theenvir<strong>on</strong>ment protecti<strong>on</strong>. For <strong>in</strong>stance, RBS is the <strong>on</strong>ly body <strong>with</strong> powers <strong>to</strong> def<strong>in</strong>e nati<strong>on</strong>alstandards, <strong>with</strong> the ma<strong>in</strong> resp<strong>on</strong>sibility of def<strong>in</strong><strong>in</strong>g nati<strong>on</strong>al standards, coord<strong>in</strong>at<strong>in</strong>g all the activities<strong>in</strong> relati<strong>on</strong> <strong>to</strong> standards, ensur<strong>in</strong>g their applicati<strong>on</strong> and metrology observance <strong>in</strong> the country,provid<strong>in</strong>g <strong>reference</strong> metrology standard, c<strong>on</strong>troll<strong>in</strong>g its observance and ensur<strong>in</strong>g its dissem<strong>in</strong>ati<strong>on</strong>all over the country.9.1.1. Visi<strong>on</strong> of air quality m<strong>on</strong>i<strong>to</strong>r<strong>in</strong>g policyEven though, every pers<strong>on</strong> has the duty <strong>to</strong> protect, c<strong>on</strong>serve and promote envir<strong>on</strong>ment, the Statehas the pr<strong>in</strong>cipal resp<strong>on</strong>sibility of protect<strong>in</strong>g, c<strong>on</strong>serv<strong>in</strong>g and promot<strong>in</strong>g the envir<strong>on</strong>ment. Therefore,<strong>on</strong> <strong>on</strong>e side, not <strong>on</strong>ly every pers<strong>on</strong> <strong>in</strong> <strong>Rwanda</strong> has a fundamental right <strong>to</strong> live <strong>in</strong> a healthy andbalanced envir<strong>on</strong>ment, but also he or she has the obligati<strong>on</strong> <strong>to</strong> c<strong>on</strong>tribute <strong>in</strong>dividually or collectively<strong>to</strong> the c<strong>on</strong>servati<strong>on</strong> of clean air. On the other side, the establishment of nati<strong>on</strong>al policy of
105protecti<strong>on</strong>, c<strong>on</strong>servati<strong>on</strong> and promoti<strong>on</strong> of the natural air is <strong>with</strong><strong>in</strong> the resp<strong>on</strong>sibility of theGovernment of <strong>Rwanda</strong>. It develops strategies, plans and nati<strong>on</strong>al program aim<strong>in</strong>g at ensur<strong>in</strong>g thec<strong>on</strong>servati<strong>on</strong> and effective use of clean air.9.1.2. Policy statementThe ma<strong>in</strong> purpose of air quality management <strong>in</strong> <strong>Rwanda</strong> would be <strong>to</strong> protect public health and theenvir<strong>on</strong>ment from the adverse effects of air polluti<strong>on</strong>. Adequate air quality management strategiesencompass many activities, <strong>in</strong>clud<strong>in</strong>g risk assessment, air quality and emissi<strong>on</strong> standard sett<strong>in</strong>g,m<strong>on</strong>i<strong>to</strong>r<strong>in</strong>g and enforcement, implementati<strong>on</strong> of c<strong>on</strong>trol measures, and risk communicati<strong>on</strong>. Theuse of air quality standards, however, has become the cornerst<strong>on</strong>e of air quality management,whose roles, adopted and enforced by regula<strong>to</strong>ry authorities, is <strong>to</strong> def<strong>in</strong>e the level of acceptable airpolluti<strong>on</strong> for a country or a regi<strong>on</strong>. The primary aim of this policy presented here is <strong>to</strong> provide aregula<strong>to</strong>ry framework for protect<strong>in</strong>g public health from the effects of air polluti<strong>on</strong>.In <strong>Rwanda</strong>, even though we have different <strong>in</strong>stituti<strong>on</strong>s deal<strong>in</strong>g directly or <strong>in</strong>directly <strong>with</strong> theprotecti<strong>on</strong> of the envir<strong>on</strong>ment, there are currently no specific legislati<strong>on</strong>s regulat<strong>in</strong>g themanagement of the ambient air. However, there are legislati<strong>on</strong>s already developed and othersbe<strong>in</strong>g developed c<strong>on</strong>cern<strong>in</strong>g the management of the envir<strong>on</strong>ment <strong>in</strong> general such as Organic LawN° 04/2005 of 08/04/2005 determ<strong>in</strong><strong>in</strong>g the modalities of protecti<strong>on</strong>, c<strong>on</strong>servati<strong>on</strong> and promoti<strong>on</strong> ofenvir<strong>on</strong>ment <strong>in</strong> <strong>Rwanda</strong> and Law N° 39/2001 of 13/09/2001 establish<strong>in</strong>g an agency for theregulati<strong>on</strong> of certa<strong>in</strong> public utilities that will handle the removal of waste products from residential orbus<strong>in</strong>ess premises. The regula<strong>to</strong>ry authority and the M<strong>in</strong>istry <strong>in</strong> charge of Envir<strong>on</strong>ment have setdifferent quality standards <strong>in</strong> some doma<strong>in</strong> but <strong>with</strong>out clearly establish<strong>in</strong>g clear and specificstandards of ambient air.It is <strong>in</strong> this regards, the foundati<strong>on</strong> of this policy is <strong>to</strong> clearly underscore the need for theexpeditious applicati<strong>on</strong> of the law <strong>in</strong> the promoti<strong>on</strong> of nati<strong>on</strong>al commitment by properly handl<strong>in</strong>g theproblem result<strong>in</strong>g from the air polluti<strong>on</strong> <strong>in</strong> the country. It aims <strong>to</strong> provide the necessary legal andregula<strong>to</strong>ry certitude for all stakeholders <strong>in</strong> the air protecti<strong>on</strong> and preventi<strong>on</strong>.
1069.1.3. Policy objectivesWith regards <strong>to</strong> air envir<strong>on</strong>ment standards, it has always been the Government's key missi<strong>on</strong> andpolicy objective <strong>to</strong> improve our air quality, thereby enhanc<strong>in</strong>g protecti<strong>on</strong> of public health. The airquality policies def<strong>in</strong>e m<strong>in</strong>imum standards for the protecti<strong>on</strong> of health and the envir<strong>on</strong>ments thatare <strong>to</strong> be met everywhere. The ma<strong>in</strong> two aims of the air quality policy are: (i)To “def<strong>in</strong>e andestablish objectives for ambient air quality <strong>in</strong> the community designed <strong>to</strong> avoid, prevent or reduceharmful effects <strong>on</strong> human health and the envir<strong>on</strong>ment as a whole”; and (ii) <strong>to</strong> “ma<strong>in</strong>ta<strong>in</strong> air qualitywhere it is good and <strong>to</strong> improve it <strong>in</strong> other cases”.9.1.4. Core pr<strong>in</strong>ciples F<strong>in</strong>d<strong>in</strong>gsThe Government f<strong>in</strong>ds that:i. Predom<strong>in</strong>ant part of the Nati<strong>on</strong>’s populati<strong>on</strong> is located <strong>in</strong> its rapidly expand<strong>in</strong>g urban areas,which generally cross the boundary l<strong>in</strong>es of local jurisdicti<strong>on</strong>s and often extend rural areas;ii. Growth <strong>in</strong> the amount and complexity of air polluti<strong>on</strong> brought about by urbanizati<strong>on</strong>,<strong>in</strong>dustrial development, and the <strong>in</strong>creas<strong>in</strong>g use of mo<strong>to</strong>r vehicles, has resulted <strong>in</strong> mount<strong>in</strong>gdangers <strong>to</strong> the public health and welfare, <strong>in</strong>clud<strong>in</strong>g <strong>in</strong>jury <strong>to</strong> agricultural crops andlives<strong>to</strong>ck, damage <strong>to</strong> and the deteriorati<strong>on</strong> of property, and hazards <strong>to</strong> air and groundtransportati<strong>on</strong>;iii. <strong>Air</strong> polluti<strong>on</strong> preventi<strong>on</strong> (that is, the reducti<strong>on</strong> or elim<strong>in</strong>ati<strong>on</strong>, through any measures, of theamount of pollutants produced or created at the source) and air polluti<strong>on</strong> c<strong>on</strong>trol at itssource is the primary resp<strong>on</strong>sibility of Government and;iv. Local f<strong>in</strong>ancial assistance and leadership is essential for the development of localprograms <strong>to</strong> prevent and c<strong>on</strong>trol air polluti<strong>on</strong>. PurposesThe purposes of this policy are:i. <strong>to</strong> protect and enhance the quality of the Nati<strong>on</strong>’s air resources so as <strong>to</strong> promote the publichealth and welfare and the productive capacity of its populati<strong>on</strong>;ii. <strong>to</strong> <strong>in</strong>itiate and accelerate a nati<strong>on</strong>al research and development program <strong>to</strong> achieve thepreventi<strong>on</strong> and c<strong>on</strong>trol of air polluti<strong>on</strong>;
107iii. <strong>to</strong> provide technical and f<strong>in</strong>ancial assistance <strong>to</strong> the government <strong>in</strong> c<strong>on</strong>necti<strong>on</strong> <strong>with</strong> thedevelopment and executi<strong>on</strong> of the air polluti<strong>on</strong> preventi<strong>on</strong> and c<strong>on</strong>trol programs;iv. <strong>to</strong> encourage and assist the development and operati<strong>on</strong> of regi<strong>on</strong>al air polluti<strong>on</strong> preventi<strong>on</strong>and c<strong>on</strong>trol programs; andv. <strong>to</strong> development of an air quality measurement and surveillance programme.9.1.5. Polluti<strong>on</strong> preventi<strong>on</strong>A primary goal of this policy is <strong>to</strong> encourage or otherwise promote reas<strong>on</strong>able governmentalacti<strong>on</strong>s, c<strong>on</strong>sistent <strong>with</strong> the provisi<strong>on</strong>s of this policy, for polluti<strong>on</strong> preventi<strong>on</strong>. To achieve theobjectives def<strong>in</strong>ed above the regula<strong>to</strong>ry authority <strong>in</strong>tends <strong>to</strong> implement a strategy based <strong>on</strong> thefollow<strong>in</strong>g axes:9.1.5.1. <strong>Air</strong> pollutant m<strong>on</strong>i<strong>to</strong>r<strong>in</strong>g, analysis, model<strong>in</strong>g, and <strong>in</strong>ven<strong>to</strong>ryIn order <strong>to</strong> achieve the standards determ<strong>in</strong>ed, the regula<strong>to</strong>ry authority shall c<strong>on</strong>duct a program ofresearch, test<strong>in</strong>g, and development of methods for sampl<strong>in</strong>g, measurement, m<strong>on</strong>i<strong>to</strong>r<strong>in</strong>g, analysis,and model<strong>in</strong>g of air pollutants. Such program shall <strong>in</strong>clude the follow<strong>in</strong>g elements:• C<strong>on</strong>siderati<strong>on</strong> of <strong>in</strong>dividual, as well as complex mixtures of air pollutants and their chemicaltransformati<strong>on</strong>s <strong>in</strong> the atmosphere.• Establishment of a nati<strong>on</strong>al network <strong>to</strong> m<strong>on</strong>i<strong>to</strong>r, collect, and compile data <strong>with</strong>quantificati<strong>on</strong> of certa<strong>in</strong>ty <strong>in</strong> the status and trends of air emissi<strong>on</strong>s, depositi<strong>on</strong>, air quality,surface water quality, forest c<strong>on</strong>diti<strong>on</strong>, and visibility impairment, and <strong>to</strong> ensure thecomparability of air quality data collected <strong>in</strong> different regi<strong>on</strong>s.• Development of improved methods and technologies for sampl<strong>in</strong>g, measurement,m<strong>on</strong>i<strong>to</strong>r<strong>in</strong>g, analysis, and model<strong>in</strong>g <strong>to</strong> <strong>in</strong>crease understand<strong>in</strong>g of the sources of oz<strong>on</strong>eprecursors, oz<strong>on</strong>e formati<strong>on</strong>, oz<strong>on</strong>e transport, regi<strong>on</strong>al <strong>in</strong>fluences <strong>on</strong> urban oz<strong>on</strong>e, regi<strong>on</strong>aloz<strong>on</strong>e trends, and <strong>in</strong>teracti<strong>on</strong>s of oz<strong>on</strong>e <strong>with</strong> other pollutants. Emphasis shall be placed <strong>on</strong>those techniques which: improve the ability <strong>to</strong> <strong>in</strong>ven<strong>to</strong>ry emissi<strong>on</strong>s of volatile organiccompounds and nitrogen oxides that c<strong>on</strong>tribute <strong>to</strong> urban air polluti<strong>on</strong>, <strong>in</strong>clud<strong>in</strong>ganthropogenic and natural sources; improve the understand<strong>in</strong>g of the mechanism throughwhich anthropogenic and biogenic volatile organic compounds react <strong>to</strong> form oz<strong>on</strong>e andother oxidants; and improve the ability <strong>to</strong> identify and evaluate regi<strong>on</strong>-specific preventi<strong>on</strong>and c<strong>on</strong>trol opti<strong>on</strong>s for oz<strong>on</strong>e polluti<strong>on</strong>.
108• Submissi<strong>on</strong> of periodic reports <strong>to</strong> the M<strong>in</strong>istry <strong>in</strong> charge of envir<strong>on</strong>ment which evaluate andassess the effectiveness of air polluti<strong>on</strong> c<strong>on</strong>trol regulati<strong>on</strong>s and programs us<strong>in</strong>g m<strong>on</strong>i<strong>to</strong>r<strong>in</strong>gand model<strong>in</strong>g data obta<strong>in</strong>ed.• M<strong>on</strong>i<strong>to</strong>r current levels as a basel<strong>in</strong>e for assessment,• Check the air quality relative <strong>to</strong> standards or limit values,• Inform the public about the air quality and raise the awareness,• Develop warn<strong>in</strong>g systems for the preventi<strong>on</strong> of undesired air polluti<strong>on</strong> episodes,• Develop and test analytical <strong>in</strong>struments and support legislati<strong>on</strong> <strong>in</strong> relati<strong>on</strong> <strong>to</strong> the air qualitylimit values and guidel<strong>in</strong>es.Specifically, the regula<strong>to</strong>ry Authority:• Shall publish proposed regulati<strong>on</strong>s prescrib<strong>in</strong>g a nati<strong>on</strong>al primary ambient air qualitystandard and a nati<strong>on</strong>al sec<strong>on</strong>dary ambient air quality standard for each air pollutant forwhich air quality criteria have been issued; and• After a reas<strong>on</strong>able time for <strong>in</strong>terested pers<strong>on</strong>s <strong>to</strong> submit written comments there<strong>on</strong> shouldby regulati<strong>on</strong> promulgate such proposed nati<strong>on</strong>al primary and sec<strong>on</strong>dary ambient airquality standards <strong>with</strong> such modificati<strong>on</strong>s as he deems appropriate.With respect <strong>to</strong> any air pollutant for which air quality criteria are issued, the regula<strong>to</strong>ry authorityshall publish, simultaneously <strong>with</strong> the issuance of such criteria and <strong>in</strong>formati<strong>on</strong>, proposed nati<strong>on</strong>alprimary and sec<strong>on</strong>dary ambient air quality standards for any such pollutant.• Nati<strong>on</strong>al primary ambient air quality standards prescribed by the regula<strong>to</strong>ry authority shallbe ambient air quality standards; the atta<strong>in</strong>ment and ma<strong>in</strong>tenance of which <strong>in</strong> the judgmen<strong>to</strong>f the regula<strong>to</strong>ry authority, based <strong>on</strong> such criteria and allow<strong>in</strong>g an adequate marg<strong>in</strong> ofsafety, are requisite <strong>to</strong> protect the public health.• Any nati<strong>on</strong>al sec<strong>on</strong>dary ambient air quality standard prescribed shall specify a level of airquality the atta<strong>in</strong>ment and ma<strong>in</strong>tenance of which <strong>in</strong> the judgment of the regula<strong>to</strong>ryauthority, based <strong>on</strong> such criteria, is requisite <strong>to</strong> protect the public welfare from any knownor anticipated adverse effects associated <strong>with</strong> the presence of such air pollutant <strong>in</strong> theambient air.
1099.1.5.2. Polluti<strong>on</strong> preventi<strong>on</strong> and emissi<strong>on</strong>s c<strong>on</strong>trolIn general, the regula<strong>to</strong>ry authority shall promulgate regulati<strong>on</strong>s establish<strong>in</strong>g emissi<strong>on</strong> standardsfor each category or subcategory of major sources and area sources of hazardous air pollutantslisted for regulati<strong>on</strong>. The regula<strong>to</strong>ry may dist<strong>in</strong>guish am<strong>on</strong>g classes, types, and sizes of sources<strong>with</strong><strong>in</strong> a category or subcategory <strong>in</strong> establish<strong>in</strong>g such standards.Emissi<strong>on</strong>s standards promulgated under nati<strong>on</strong>al air policy and applicable <strong>to</strong> new or exist<strong>in</strong>gsources of hazardous air pollutants shall require the maximum degree of reducti<strong>on</strong> <strong>in</strong> emissi<strong>on</strong>s ofthe hazardous air pollutants that the Adm<strong>in</strong>istra<strong>to</strong>r, tak<strong>in</strong>g <strong>in</strong><strong>to</strong> c<strong>on</strong>siderati<strong>on</strong> the cost of achiev<strong>in</strong>gsuch emissi<strong>on</strong> reducti<strong>on</strong>, and any n<strong>on</strong>-air quality health and envir<strong>on</strong>mental impacts and energyrequirements, determ<strong>in</strong>es is achievable for new or exist<strong>in</strong>g sources <strong>in</strong> the category or subcategory<strong>to</strong> which such emissi<strong>on</strong> standard applies, through applicati<strong>on</strong> of measures, processes, methods,systems or techniques <strong>in</strong>clud<strong>in</strong>g, but not limited <strong>to</strong>, measures which:• reduce the volume of, or elim<strong>in</strong>ate emissi<strong>on</strong>s of, such pollutants through process changes,substituti<strong>on</strong> of materials or other modificati<strong>on</strong>s;• enclose systems or processes <strong>to</strong> elim<strong>in</strong>ate emissi<strong>on</strong>s;• collect, capture or treat such pollutants when released from a process, stack, s<strong>to</strong>rage orfugitive emissi<strong>on</strong>s po<strong>in</strong>t;• are design, equipment, work practice, or operati<strong>on</strong>al standards (<strong>in</strong>clud<strong>in</strong>g requirements foropera<strong>to</strong>r tra<strong>in</strong><strong>in</strong>g or certificati<strong>on</strong>); or• are a comb<strong>in</strong>ati<strong>on</strong> of the above?The maximum degree of reducti<strong>on</strong> <strong>in</strong> emissi<strong>on</strong>s that is deemed achievable for new sources <strong>in</strong> acategory or subcategory shall not be less str<strong>in</strong>gent than the emissi<strong>on</strong> c<strong>on</strong>trol that is achieved <strong>in</strong>practice by the best c<strong>on</strong>trolled similar source, as determ<strong>in</strong>ed by the regula<strong>to</strong>ry authority. Withrespect <strong>to</strong> pollutants for which a health threshold has been established, the regula<strong>to</strong>ry authoritymay c<strong>on</strong>sider such threshold level, <strong>with</strong> an ample marg<strong>in</strong> of safety, when establish<strong>in</strong>g emissi<strong>on</strong>standards.
1109.1.5.3. Car emissi<strong>on</strong>s <strong>in</strong>specti<strong>on</strong> and c<strong>on</strong>trol programThe regula<strong>to</strong>ry Authority shall establish the standards, requirements and procedures applicable <strong>to</strong>all mo<strong>to</strong>r vehicles, old model years and newer <strong>with</strong> the excepti<strong>on</strong> of the five newest model years. Itshall:• Prepare a proposal <strong>to</strong> strengthen the c<strong>on</strong>trol of emissi<strong>on</strong>s from petrol vehicles;• Propose emissi<strong>on</strong> c<strong>on</strong>trol for road or n<strong>on</strong>-road mobile sources; and• Set up a Pilot Green Transport Fund <strong>to</strong> encourage the <strong>in</strong>troducti<strong>on</strong> of <strong>in</strong>novative transporttechnology.In this regard, the follow<strong>in</strong>g have also <strong>to</strong> be taken <strong>in</strong><strong>to</strong> c<strong>on</strong>siderati<strong>on</strong>:i. No mo<strong>to</strong>r vehicle that is subject <strong>to</strong> the regulati<strong>on</strong> may be granted registrati<strong>on</strong> unless is <strong>in</strong>compliance <strong>with</strong> the applicable emissi<strong>on</strong>s standards determ<strong>in</strong>ed at an official <strong>in</strong>specti<strong>on</strong>stati<strong>on</strong>.ii. Any mo<strong>to</strong>r vehicle should be deemed <strong>to</strong> be <strong>in</strong> compliance <strong>with</strong> the applicable emissi<strong>on</strong>sstandards if the test results are equal <strong>to</strong> or less than the emissi<strong>on</strong>s standards applicable <strong>to</strong>the mo<strong>to</strong>r vehicle.iii. Any mo<strong>to</strong>r vehicle should be deemed <strong>to</strong> be <strong>in</strong> n<strong>on</strong>compliance <strong>with</strong> applicable emissi<strong>on</strong>sstandards if the test results are greater than the emissi<strong>on</strong>s standards applicable <strong>to</strong> themo<strong>to</strong>r vehicle.iv. Any mo<strong>to</strong>r vehicle which fails its <strong>in</strong>itial emissi<strong>on</strong>s test shall be deemed <strong>to</strong> be <strong>in</strong> compliance<strong>with</strong> applicable emissi<strong>on</strong>s standards if not later than the registrati<strong>on</strong> expirati<strong>on</strong> date, themo<strong>to</strong>r vehicle either (1) is repaired and is <strong>in</strong> compliance <strong>with</strong> applicable emissi<strong>on</strong>sstandards as determ<strong>in</strong>ed by an emissi<strong>on</strong>s retest at an Official Inspecti<strong>on</strong> Stati<strong>on</strong>, or (2) isgranted a waiver.v. All owners and opera<strong>to</strong>rs of mo<strong>to</strong>r vehicles subject <strong>to</strong> the provisi<strong>on</strong>s of this rule shallma<strong>in</strong>ta<strong>in</strong> their mo<strong>to</strong>r vehicles and any air polluti<strong>on</strong> c<strong>on</strong>trol equipment <strong>on</strong> the mo<strong>to</strong>r vehicles<strong>in</strong> good work<strong>in</strong>g order such that they meet the emissi<strong>on</strong> standards specified <strong>in</strong> this rule.vi. A certificate of compliance shall be issued <strong>to</strong> owners or opera<strong>to</strong>rs of mo<strong>to</strong>r vehicles thatpass the emissi<strong>on</strong>s test and tamper<strong>in</strong>g <strong>in</strong>specti<strong>on</strong> and <strong>to</strong> mo<strong>to</strong>r vehicles that are granted awaiver <strong>in</strong> accordance <strong>with</strong> this rule.
1119.1.5.4. Oil quality standardsAtmospheric emissi<strong>on</strong> <strong>in</strong>troduced <strong>to</strong> the envir<strong>on</strong>ment from fuel combusti<strong>on</strong>, <strong>in</strong>c<strong>in</strong>erati<strong>on</strong> and<strong>in</strong>dustrial emissi<strong>on</strong> sources are caus<strong>in</strong>g <strong>in</strong>creas<strong>in</strong>g c<strong>on</strong>cern <strong>to</strong> air polluti<strong>on</strong>. The emissi<strong>on</strong>s are not<strong>on</strong>ly pos<strong>in</strong>g threat human and animals but they may also affect the meteorological and geophysicalset up such as the scatter<strong>in</strong>g of solar radiati<strong>on</strong> back <strong>in</strong><strong>to</strong> the space and reduc<strong>in</strong>g visibility. Thus, thepr<strong>in</strong>ciple c<strong>on</strong>cern of the regulati<strong>on</strong>s is <strong>to</strong>ward the c<strong>on</strong>trol of the smoke and solid particulatesemissi<strong>on</strong> from the burn<strong>in</strong>g wastes. Smog form<strong>in</strong>g compounds and other air <strong>to</strong>xics are released atevery stage of oil and gas development.Oil producti<strong>on</strong> and utilisati<strong>on</strong> emit a variety of air pollutants <strong>in</strong>clud<strong>in</strong>g NOx, carb<strong>on</strong> m<strong>on</strong>oxide andcarb<strong>on</strong> dioxide. Dur<strong>in</strong>g well completi<strong>on</strong>, t<strong>on</strong>s of VOCs may be vented or flared. Oil and naturalgas c<strong>on</strong>densate tanks and glycol dehydra<strong>to</strong>rs release VOCs. Compressor stati<strong>on</strong>s emit a variety ofoz<strong>on</strong>e-form<strong>in</strong>g compounds, as well as other air pollutants. Therefore, the regula<strong>to</strong>ry authority shallprovide additi<strong>on</strong>al standards <strong>to</strong> those provided for a petrol fill<strong>in</strong>g stati<strong>on</strong> aim<strong>in</strong>g at:i. Cutt<strong>in</strong>g emissi<strong>on</strong>s and oil opera<strong>to</strong>rs must cut overall emissi<strong>on</strong>s of volatileorganic compounds (VOCs) from c<strong>on</strong>densate s<strong>to</strong>rage tanks;ii.iii.Emissi<strong>on</strong> c<strong>on</strong>trols and oblige oil opera<strong>to</strong>rs <strong>to</strong> <strong>in</strong>stall emissi<strong>on</strong> c<strong>on</strong>trols <strong>on</strong> c<strong>on</strong>densates<strong>to</strong>rage tanks;<strong>Air</strong> quality report<strong>in</strong>g by provid<strong>in</strong>g an annual report <strong>on</strong> how the oil and gas <strong>in</strong>dustry isaffect<strong>in</strong>g air quality across the state.9.1.5.5. Tax <strong>in</strong>centive <strong>to</strong> eco-carsThe regula<strong>to</strong>ry Authority should provide or establish measures that can encourage the car user andcar owners <strong>to</strong> opt for ecology cars through positive and negative related taxes. In this regard, theregula<strong>to</strong>ry Authority <strong>in</strong> c<strong>on</strong>juncti<strong>on</strong> <strong>with</strong> other related competent <strong>in</strong>stituti<strong>on</strong>s, should:i. Introduce a subsidy <strong>to</strong> encourage the use of eco-cars;ii. Provid<strong>in</strong>g tax <strong>in</strong>centives <strong>to</strong> encourage use of envir<strong>on</strong>ment-friendly vehicles andwaiv<strong>in</strong>g first registrati<strong>on</strong> tax for electric vehicles;iii. Impose road taxes based <strong>on</strong> CO2 emissi<strong>on</strong>s;
112iv. Impose <strong>to</strong> all <strong>in</strong>surance companies <strong>to</strong> provide a certa<strong>in</strong> amount of their <strong>in</strong>comeprofits <strong>in</strong> the protecti<strong>on</strong> of envir<strong>on</strong>ment, <strong>with</strong> a special focus <strong>on</strong> car emissi<strong>on</strong>polluti<strong>on</strong>.9.1.6. Mandate of regula<strong>to</strong>ry authorityRegula<strong>to</strong>ry Authority has been entrusted by the M<strong>in</strong>istry <strong>in</strong> Charge of envir<strong>on</strong>ment for theregulati<strong>on</strong> of the air quality m<strong>on</strong>i<strong>to</strong>r<strong>in</strong>g <strong>in</strong> <strong>Rwanda</strong>. For this reas<strong>on</strong>, the regula<strong>to</strong>ry authority shall:i. Adm<strong>in</strong>istrate this policy <strong>in</strong> c<strong>on</strong>sultati<strong>on</strong> <strong>with</strong> the M<strong>in</strong>istry. This policy and the regulati<strong>on</strong>sadopted pursuant <strong>to</strong> this policy should be enforced by the Regula<strong>to</strong>ry Authority.ii. Have the power <strong>to</strong> make, publish and enforce all regulati<strong>on</strong>s that are necessary <strong>to</strong>implement and pursuant <strong>to</strong> this policy.iii. Prepare, publish, or issue any materials that the Regula<strong>to</strong>ry Authority determ<strong>in</strong>es <strong>to</strong> benecessary for the dissem<strong>in</strong>ati<strong>on</strong> of <strong>in</strong>formati<strong>on</strong> c<strong>on</strong>cern<strong>in</strong>g the activities of the Regula<strong>to</strong>ryAuthority under this policy <strong>in</strong> c<strong>on</strong>sultati<strong>on</strong> <strong>with</strong> the M<strong>in</strong>istry.iv. Have the power <strong>to</strong> impose adm<strong>in</strong>istrative penalties (as per Law N° 39/2001 of 13/09/2001)for the failure <strong>to</strong> comply <strong>with</strong> this policy.v. Manage and regulate po<strong>in</strong>t sources of air polluti<strong>on</strong> which have the potential <strong>to</strong> causematerial or serious envir<strong>on</strong>mental harm or an envir<strong>on</strong>mental nuisance <strong>in</strong> such a manner as<strong>to</strong> not prejudice the achievement of the envir<strong>on</strong>mental values identified <strong>in</strong> this Policy.vi. Where necessary regula<strong>to</strong>ry limits <strong>on</strong> the c<strong>on</strong>centrati<strong>on</strong> or emissi<strong>on</strong> rate of pollutants thatmay be emitted from a new or significantly upgraded po<strong>in</strong>t source of air polluti<strong>on</strong> shall beestablished by the regula<strong>to</strong>ry authority.vii. Provide the regula<strong>to</strong>ry c<strong>on</strong>trols and m<strong>on</strong>i<strong>to</strong>r<strong>in</strong>g requirements applied <strong>to</strong> a po<strong>in</strong>t source ofair polluti<strong>on</strong> proporti<strong>on</strong>ate <strong>to</strong> the level of envir<strong>on</strong>mental risk posed by the emissi<strong>on</strong> ofpolluti<strong>on</strong> from that source.viii. Require a resp<strong>on</strong>sible pers<strong>on</strong> <strong>in</strong> relati<strong>on</strong> <strong>to</strong> a significant source of air polluti<strong>on</strong> which is <strong>in</strong>existence at the time this Policy is made <strong>to</strong> progressively reduce the emissi<strong>on</strong> of pollutantsfrom that source.ix. Manage and regulate diffuse sources of air polluti<strong>on</strong> that have the potential <strong>to</strong> causematerial or serious envir<strong>on</strong>mental harm or an envir<strong>on</strong>mental nuisance <strong>in</strong> such a manner aswill protect the envir<strong>on</strong>mental values identified <strong>in</strong> this Policy.
1139.1.7. Policy recommendati<strong>on</strong>sBas<strong>in</strong>g <strong>on</strong> the exist<strong>in</strong>g policy related <strong>to</strong> the envir<strong>on</strong>ment protecti<strong>on</strong> and the above proposedstandards, the follow<strong>in</strong>g observati<strong>on</strong>s should be taken <strong>in</strong><strong>to</strong> c<strong>on</strong>siderati<strong>on</strong>:i. Specific standards <strong>on</strong> air polluti<strong>on</strong> should be provided and revised when deemednecessary;ii. Established standards should be guided, not <strong>on</strong>ly by Nati<strong>on</strong>al <strong>Air</strong> Status, but also by regi<strong>on</strong>and <strong>in</strong>ternati<strong>on</strong>al air status as the polluti<strong>on</strong> of foreigner States may have an impact <strong>on</strong> theNati<strong>on</strong>al <strong>Air</strong> status;iii. All public <strong>in</strong>stituti<strong>on</strong>s deal<strong>in</strong>g, directly or <strong>in</strong>directly, <strong>with</strong> envir<strong>on</strong>ment protecti<strong>on</strong> comb<strong>in</strong>etheir efforts <strong>in</strong> order <strong>to</strong> promote, prevent and protect the <strong>Rwanda</strong>n Ambient <strong>Air</strong>. This canbe possible if they harm<strong>on</strong>ize their respective policies aim<strong>in</strong>g at envir<strong>on</strong>ment protecti<strong>on</strong>;iv. Researcher’s assessment <strong>on</strong> the air status <strong>in</strong> order <strong>to</strong> improve or ma<strong>in</strong>ta<strong>in</strong> a susta<strong>in</strong>ableclean ambient air;v. Establishment or review of envir<strong>on</strong>ment standards.Other strategies <strong>to</strong> be undertaken by car users <strong>with</strong><strong>in</strong> <strong>Kigali</strong> City <strong>in</strong> order <strong>to</strong> Reduce <strong>Air</strong> Polluti<strong>on</strong>from Transport: drive less; walk or ride your bike <strong>to</strong> nearby places; ride the bus <strong>on</strong> your commute <strong>to</strong>work or school; use the <strong>in</strong>ternet <strong>to</strong> shop or f<strong>in</strong>d out <strong>in</strong>formati<strong>on</strong> <strong>in</strong>stead of driv<strong>in</strong>g where it ispossible; ma<strong>in</strong>ta<strong>in</strong> your vehicle properly; refuel after 5:00p.m. To reduce ground-level oz<strong>on</strong>e; s<strong>to</strong>pat the click when fuel<strong>in</strong>g up <strong>to</strong> reduce gasol<strong>in</strong>e vapors and spills; and keep your tires properly<strong>in</strong>flated.9.1.8. S<strong>to</strong>ckholder’s collaborati<strong>on</strong>S<strong>in</strong>ce the envir<strong>on</strong>mental degradati<strong>on</strong> is such a pervasive problem, a wide-reach<strong>in</strong>g andcomprehensive enforcement apparatus is required <strong>to</strong> cope <strong>with</strong> it. Different <strong>in</strong>stituti<strong>on</strong>s hav<strong>in</strong>gimpact, be<strong>in</strong>g direct or <strong>in</strong>direct, <strong>on</strong> the envir<strong>on</strong>ment protecti<strong>on</strong> have due regard <strong>to</strong> the preservati<strong>on</strong>and protecti<strong>on</strong> of the envir<strong>on</strong>ment, the c<strong>on</strong>servati<strong>on</strong> of natural resources and the health and safetyof envir<strong>on</strong>ment beneficiaries. It is <strong>in</strong> this regard; RRA, <strong>REMA</strong>, RBS, RNP, researchers, etc. shouldcollaborate <strong>in</strong> order <strong>to</strong> avoid <strong>in</strong>terference of their respective missi<strong>on</strong>s.
1149.1.8.1. <strong>Rwanda</strong> Revenue Authority (RAA)RRA shall have the follow<strong>in</strong>g ma<strong>in</strong> resp<strong>on</strong>sibilities, <strong>in</strong> accordance <strong>with</strong> taxati<strong>on</strong> <strong>in</strong>centives for“Green Cars”:• participat<strong>in</strong>g <strong>in</strong> fix<strong>in</strong>g, collect<strong>in</strong>g, c<strong>on</strong>troll<strong>in</strong>g and manag<strong>in</strong>g tax <strong>in</strong>centives measures foreco-cars <strong>in</strong> accordance <strong>with</strong> the law and modalities perta<strong>in</strong><strong>in</strong>g there<strong>to</strong> established by theregula<strong>to</strong>ry authority;• grant<strong>in</strong>g tax waivers or <strong>in</strong>centives measures as provided for by relevant policy legalprovisi<strong>on</strong>s accord<strong>in</strong>g <strong>to</strong> the procedures it prescribes;• exercis<strong>in</strong>g judicial police powers <strong>to</strong> <strong>in</strong>vestigate any air pollutant, especially enter<strong>in</strong>g cars;• carry<strong>in</strong>g out any other activity related <strong>to</strong> the protecti<strong>on</strong> of envir<strong>on</strong>ment up<strong>on</strong> request by theregula<strong>to</strong>ry authority as far as potential cross-border pollutants are c<strong>on</strong>cerned;9.1.8.2. <strong>Rwanda</strong> Envir<strong>on</strong>ment Management Authority (<strong>REMA</strong>)<strong>Rwanda</strong> Envir<strong>on</strong>ment Management Authority will be entrusted by the M<strong>in</strong>istry <strong>with</strong> the follow<strong>in</strong>gresp<strong>on</strong>sibilities related <strong>to</strong> envir<strong>on</strong>ment protecti<strong>on</strong>:• Prepare and publish technical guidel<strong>in</strong>es for the <strong>in</strong>specti<strong>on</strong> of car emissi<strong>on</strong>s.• In collaborati<strong>on</strong> <strong>with</strong> the police, the Regula<strong>to</strong>ry Authority and other competent authoritiesshall identify suitable sites for car emissi<strong>on</strong> <strong>in</strong>specti<strong>on</strong>s and provide the necessaryequipments for that purpose.• Coord<strong>in</strong>ate the envir<strong>on</strong>mental impact assessment process of car emissi<strong>on</strong>s.• Coord<strong>in</strong>ate <strong>in</strong>specti<strong>on</strong>, m<strong>on</strong>i<strong>to</strong>r<strong>in</strong>g and follow up activities <strong>to</strong> ensure compliance <strong>with</strong>applicable air envir<strong>on</strong>mental standards and regulati<strong>on</strong>s <strong>in</strong> place.• Prepar<strong>in</strong>g rules and regulati<strong>on</strong>s aim<strong>in</strong>g at the improvement of the ambient air which shallbe approved by the M<strong>in</strong>ister <strong>in</strong> charge of envir<strong>on</strong>ment.• Provid<strong>in</strong>g the strategic visi<strong>on</strong> and acti<strong>on</strong> plan aim<strong>in</strong>g at the improvement of ambient air andenvir<strong>on</strong>ment protecti<strong>on</strong>;9.1.8.3. <strong>Rwanda</strong> Bureau of Standards (RBS)The ma<strong>in</strong> resp<strong>on</strong>sibilities of the Bureau of Standards as the body <strong>with</strong> powers <strong>to</strong> def<strong>in</strong>e nati<strong>on</strong>alstandards are as follow:• def<strong>in</strong><strong>in</strong>g nati<strong>on</strong>al air envir<strong>on</strong>ment standards, coord<strong>in</strong>at<strong>in</strong>g all the activities <strong>in</strong> relati<strong>on</strong> <strong>to</strong>standards, ensur<strong>in</strong>g their applicati<strong>on</strong> and observance <strong>in</strong> the country;
115• Grant<strong>in</strong>g car envir<strong>on</strong>ment standards certificates <strong>in</strong> collaborati<strong>on</strong> <strong>with</strong> the police;• In collaborati<strong>on</strong> <strong>with</strong> RRA, ensure that all new cars enter<strong>in</strong>g the country (imported) meetthe established air envir<strong>on</strong>ment standards;• promot<strong>in</strong>g and co-coord<strong>in</strong>at<strong>in</strong>g all the activities <strong>in</strong> relati<strong>on</strong> <strong>to</strong> the def<strong>in</strong>iti<strong>on</strong> of airenvir<strong>on</strong>ment standards;• assist<strong>in</strong>g the Government of <strong>Rwanda</strong> <strong>in</strong> def<strong>in</strong><strong>in</strong>g, devis<strong>in</strong>g and implement<strong>in</strong>g air protecti<strong>on</strong>standardizati<strong>on</strong> policy;• advis<strong>in</strong>g <strong>on</strong> all issues perta<strong>in</strong><strong>in</strong>g <strong>to</strong> standardizati<strong>on</strong> <strong>in</strong> the country and collaborat<strong>in</strong>g <strong>with</strong>Regula<strong>to</strong>ry authority or any other nati<strong>on</strong>al or <strong>in</strong>ternati<strong>on</strong>al organizati<strong>on</strong>s <strong>in</strong> matters relat<strong>in</strong>g<strong>to</strong> air envir<strong>on</strong>ment standardizati<strong>on</strong>;• sett<strong>in</strong>g up a standards <strong>in</strong>specti<strong>on</strong> system for imported and exported products and ensur<strong>in</strong>gtheir respect of envir<strong>on</strong>ment c<strong>on</strong>trol at all po<strong>in</strong>ts of market<strong>in</strong>g and c<strong>on</strong>sumpti<strong>on</strong> <strong>with</strong><strong>in</strong> thecountry;• In collaborati<strong>on</strong> <strong>with</strong> <strong>REMA</strong>, provid<strong>in</strong>g facilities or mak<strong>in</strong>g arrangements for theexam<strong>in</strong>ati<strong>on</strong> or <strong>in</strong>specti<strong>on</strong> and test<strong>in</strong>g of car emissi<strong>on</strong>.9.1.8.4. <strong>Rwanda</strong> Nati<strong>on</strong>al Police (RNP)In implementati<strong>on</strong> of the Organic Law No 04/2005 of 08/04/2005 determ<strong>in</strong><strong>in</strong>g the modalities ofprotecti<strong>on</strong>, c<strong>on</strong>servati<strong>on</strong> and promoti<strong>on</strong> of envir<strong>on</strong>ment <strong>in</strong> <strong>Rwanda</strong>, the <strong>Rwanda</strong>n Nati<strong>on</strong>al Policeshall have resp<strong>on</strong>sibility <strong>to</strong>:• M<strong>on</strong>i<strong>to</strong>r whether all cars have “<strong>Air</strong> envir<strong>on</strong>ment certificate”, <strong>in</strong> additi<strong>on</strong> <strong>to</strong> the ord<strong>in</strong>arydocuments ( like car <strong>in</strong>surance deed), show<strong>in</strong>g the last date of <strong>in</strong>specti<strong>on</strong> and that of thenext <strong>in</strong>specti<strong>on</strong>;• Impose sancti<strong>on</strong>s <strong>to</strong> any car owner of the car who didn’t br<strong>in</strong>g his/her car for <strong>in</strong>specti<strong>on</strong>test;• Determ<strong>in</strong>e which reparati<strong>on</strong>s <strong>to</strong> be d<strong>on</strong>e <strong>in</strong> the case a car fail <strong>to</strong> pass the <strong>in</strong>specti<strong>on</strong> testbefore be<strong>in</strong>g <strong>in</strong> circulati<strong>on</strong>;• Facilitate the <strong>in</strong>specti<strong>on</strong> process by c<strong>on</strong>duct<strong>in</strong>g the air polluti<strong>on</strong> <strong>in</strong>specti<strong>on</strong> <strong>to</strong> all cars <strong>in</strong>additi<strong>on</strong> <strong>to</strong> the actual technical tests.9.1.8.5. Research <strong>in</strong>stitutesThe researchers <strong>in</strong> collaborati<strong>on</strong> <strong>with</strong> the Envir<strong>on</strong>mental Authority shall:
116• C<strong>on</strong>duct research <strong>on</strong> envir<strong>on</strong>mental effects caused by car emissi<strong>on</strong>s, and recommendmeasures <strong>to</strong> be taken <strong>to</strong> mitigate or offset the negative effects;• Provides tra<strong>in</strong><strong>in</strong>g, c<strong>on</strong>sultancy, applied research services and extends advocacy <strong>in</strong> thearea of envir<strong>on</strong>ment protecti<strong>on</strong> <strong>to</strong> <strong>in</strong>dustries, regula<strong>to</strong>ry bodies, Government Organizati<strong>on</strong>sand NGOs and works <strong>to</strong>wards br<strong>in</strong>g<strong>in</strong>g about change for a more balanced development;• Promote Informati<strong>on</strong>, Educati<strong>on</strong> and Communicati<strong>on</strong> activities <strong>in</strong> schools, colleges,<strong>in</strong>dustry etc. <strong>to</strong> enhance the knowledge base <strong>on</strong> risk of car emissi<strong>on</strong>s <strong>on</strong> human health.10. C<strong>on</strong>cluded remarks10.1. C<strong>on</strong>clusi<strong>on</strong>sThe overall objective was <strong>to</strong> develop a solid understand<strong>in</strong>g of air quality <strong>in</strong> <strong>Rwanda</strong> <strong>with</strong> focus <strong>on</strong><strong>Kigali</strong> and <strong>to</strong> develop a related strategy and policy recommendati<strong>on</strong>s <strong>to</strong> address the polluti<strong>on</strong>issues. Methods used <strong>in</strong>clude literature review about urbanizati<strong>on</strong>, air polluti<strong>on</strong> and human healthrisk. The exist<strong>in</strong>g standards, regulati<strong>on</strong>s and policies about air polluti<strong>on</strong> c<strong>on</strong>trol and air qualitym<strong>on</strong>i<strong>to</strong>r<strong>in</strong>g; the state of air polluti<strong>on</strong> <strong>in</strong> <strong>Kigali</strong> City and the plausible c<strong>on</strong>sequences <strong>on</strong> human healtheffects <strong>with</strong> a focus <strong>on</strong> respira<strong>to</strong>ry illnesses have been highlighted from literature review based <strong>on</strong>exit<strong>in</strong>g policy framework for <strong>Rwanda</strong> <strong>in</strong>clud<strong>in</strong>g Multilateral Agreements and Internati<strong>on</strong>alC<strong>on</strong>venti<strong>on</strong>s such as Kyo<strong>to</strong> Pro<strong>to</strong>col C<strong>on</strong>venti<strong>on</strong>; United Nati<strong>on</strong>s Framework C<strong>on</strong>venti<strong>on</strong> <strong>on</strong>Climate Change; Vienna C<strong>on</strong>venti<strong>on</strong> <strong>on</strong> the Protecti<strong>on</strong> of the Oz<strong>on</strong>e Layer. Other policydocuments analysed comprise the air quality emissi<strong>on</strong>s standards for <strong>Rwanda</strong> and for East AfricanCommunity; the <strong>Rwanda</strong> Bureau of Standards publicati<strong>on</strong> and other government publicati<strong>on</strong>s <strong>on</strong>air quality and envir<strong>on</strong>ment policies, laws, programs and strategies.A desk <str<strong>on</strong>g>study</str<strong>on</strong>g> was also carried out <strong>to</strong> acquire and analyse relevant <strong>in</strong>formati<strong>on</strong> perta<strong>in</strong><strong>in</strong>g <strong>to</strong> airpolluti<strong>on</strong>/air quality from previous studies <strong>in</strong> <strong>Kigali</strong> City. These <strong>in</strong>clude for example, themeteorological records above <strong>Kigali</strong> City (temperature, relative humidity, ra<strong>in</strong>falls, w<strong>in</strong>d speed anddirecti<strong>on</strong>) from the M<strong>in</strong>istry of Infrastructure, the <strong>to</strong>pography or Digital Elevati<strong>on</strong> Model (DEM),ROAD network; land use and ma<strong>in</strong> sources of air polluti<strong>on</strong> such <strong>in</strong>dustrial z<strong>on</strong>es, roads trafficlights, roundabouts and car stati<strong>on</strong>s and s<strong>to</strong>ps <strong>with</strong><strong>in</strong> the <str<strong>on</strong>g>study</str<strong>on</strong>g> area. Medical records <strong>on</strong> upperrespira<strong>to</strong>ry <strong>in</strong>fecti<strong>on</strong>s diseases such as cough, phlegm, <strong>in</strong>fluenza, headaches and eye irritati<strong>on</strong>;and chr<strong>on</strong>ic respira<strong>to</strong>ry disease like asthma, pneum<strong>on</strong>ia, br<strong>on</strong>chitis have been acquired from the
117selected health facilities <strong>in</strong> <strong>Kigali</strong> City. A field work <strong>in</strong> selected sites <strong>to</strong> fill <strong>in</strong> gaps <strong>in</strong> exist<strong>in</strong>gmeasurements was also organized and the selecti<strong>on</strong> of the sample po<strong>in</strong>ts was guided by thegeography of <strong>Kigali</strong> City, traffic activities and locati<strong>on</strong> of <strong>in</strong>dustries. The <strong>in</strong>formati<strong>on</strong> <strong>on</strong> <strong>in</strong>door airpolluti<strong>on</strong> was gathered from other studies which tried <strong>to</strong> measure the PM2.5 and CO us<strong>in</strong>g theTraditi<strong>on</strong>al Cook<strong>in</strong>g S<strong>to</strong>ves and the Improved Cook<strong>in</strong>g S<strong>to</strong>ves <strong>in</strong> rural areas.The research f<strong>in</strong>d<strong>in</strong>g revealed that air polluti<strong>on</strong> <strong>in</strong> <strong>Kigali</strong> City is an already an <strong>in</strong>creas<strong>in</strong>g problemwhich may have many effects and facts <strong>to</strong> the life of populati<strong>on</strong>. The rapid urban populati<strong>on</strong> of<strong>Kigali</strong> City <strong>in</strong> the last decade has resulted <strong>in</strong> unplanned urban development, ris<strong>in</strong>g rate ofmo<strong>to</strong>rizati<strong>on</strong> and <strong>in</strong>crease <strong>in</strong> c<strong>on</strong>sumpti<strong>on</strong>; and then air polluti<strong>on</strong> problems. The situati<strong>on</strong> isexacerbated by <strong>in</strong>creas<strong>in</strong>g number of vehicles, <strong>in</strong>adequate <strong>in</strong>specti<strong>on</strong> and ma<strong>in</strong>tenance of facilities;Adulterati<strong>on</strong> of fuel products; improper traffic management system and road c<strong>on</strong>diti<strong>on</strong>s, high levelsof polluti<strong>on</strong> at traffic <strong>in</strong>tersecti<strong>on</strong>s; absence of effective mass rapid transport system. The ma<strong>in</strong>sources are vehicles; <strong>in</strong>dustries and power plant units; domestic fuel and household woodscombusti<strong>on</strong>s. Meteorological and <strong>to</strong>pographic c<strong>on</strong>diti<strong>on</strong>s of the <strong>Kigali</strong> City have been po<strong>in</strong>ted outas the dispersi<strong>on</strong> fac<strong>to</strong>rs of air pollutants <strong>in</strong><strong>to</strong> the atmosphere especially <strong>in</strong> dry seas<strong>on</strong>s.Today, the mounta<strong>in</strong>s around <strong>Kigali</strong> City are hardly rarely visible due <strong>to</strong> very severe deteriorati<strong>on</strong> ofambient air by pollutants, specially, suspended particulates and oz<strong>on</strong>e which are caused by<strong>in</strong>creased number of gas guzzl<strong>in</strong>g and smok<strong>in</strong>g old vehicles driven <strong>on</strong> severely dusty roads andsidewalks, populati<strong>on</strong> <strong>in</strong>crease, low quality fuel, used mo<strong>to</strong>r oil, wood, and coal, and <strong>in</strong>tensesunlight promot<strong>in</strong>g pho<strong>to</strong>chemical reacti<strong>on</strong>s. The number of mo<strong>to</strong>rized vehicles is now reach<strong>in</strong>galmost 300 thousands <strong>in</strong> the city. High elevati<strong>on</strong> and <strong>in</strong>tense sunlight trigger oz<strong>on</strong>e formati<strong>on</strong>. Inadditi<strong>on</strong>, due <strong>to</strong> <strong>in</strong>versi<strong>on</strong>, air polluti<strong>on</strong> is generally worse <strong>in</strong> the dry seas<strong>on</strong>, when thermal<strong>in</strong>versi<strong>on</strong>s are more comm<strong>on</strong>.A number of <strong>in</strong>fluenc<strong>in</strong>g fac<strong>to</strong>rs of the quantity of emissi<strong>on</strong>s from transport sec<strong>to</strong>r have beenidentified as the frequency that vehicles are used; extent <strong>to</strong> which the vehicle is used (excessive);the age of the vehicle fleet; the technology used <strong>with</strong><strong>in</strong> it; and the extent <strong>to</strong> which vehicles areproperly ma<strong>in</strong>ta<strong>in</strong>ed; the availability of appropriate fuels and the extent <strong>to</strong> which they are usedproperly. C<strong>on</strong>cern<strong>in</strong>g the current state of air polluti<strong>on</strong> <strong>in</strong> <strong>Kigali</strong> City, the measurement results <strong>on</strong>
118suspended particulate matter showed that <strong>Kigali</strong> City exceeded already the recommendati<strong>on</strong>s ofthe WHO (50 μg m 3 ). Inhabitants of <strong>Kigali</strong> are therefore exposed <strong>to</strong> enormous levels of PM10 dur<strong>in</strong>gmost of their time outdoors especial <strong>in</strong> the even<strong>in</strong>g hours. A seas<strong>on</strong>al variati<strong>on</strong> was found asc<strong>on</strong>sistently higher dust load was found <strong>in</strong> the dry seas<strong>on</strong>s which might possibly be attributed <strong>to</strong>the prevailed meteorological c<strong>on</strong>diti<strong>on</strong>s such as low precipitati<strong>on</strong> and w<strong>in</strong>d speed. Likewise, thec<strong>on</strong>centrati<strong>on</strong> of ground-level oz<strong>on</strong>e is already bey<strong>on</strong>d the major envir<strong>on</strong>mental standards, and theproblem of air polluti<strong>on</strong> is already at present. When c<strong>on</strong>sider<strong>in</strong>g the scale of <strong>in</strong>dustrial activities <strong>in</strong><strong>Kigali</strong>, we can assume that the primary source of this polluti<strong>on</strong> is mo<strong>to</strong>r vehicle exhaust especiallycaused by bad ma<strong>in</strong>tenance of its emissi<strong>on</strong> c<strong>on</strong>trol. Even if the sulphur dioxide released <strong>in</strong> theatmosphere of <strong>Kigali</strong> City was found low when compared <strong>to</strong> the accepted annually averagerecommended by East African Standard for some comm<strong>on</strong> substances found <strong>in</strong> polluted air (80g/m 3 for <strong>in</strong>dustrial areas, 60 g/m 3 for residential areas; a 15 g/m 3 c<strong>on</strong>trolled areas), the sulphurdioxide is already a c<strong>on</strong>cern for <strong>in</strong>habitants especially dur<strong>in</strong>g the dry seas<strong>on</strong>s, as the measurestaken at KIST air quality m<strong>on</strong>i<strong>to</strong>r<strong>in</strong>g were bey<strong>on</strong>d the permissible limits.Like many other cities of the world, <strong>Kigali</strong> City has not yet made major efforts <strong>to</strong> reduce airpolluti<strong>on</strong>. The regula<strong>to</strong>ry regime <strong>on</strong> air polluti<strong>on</strong> c<strong>on</strong>trol and reducti<strong>on</strong> still has <strong>to</strong> be improved <strong>in</strong><strong>Rwanda</strong>. The envir<strong>on</strong>ment management acts exist <strong>in</strong> <strong>Rwanda</strong> but relevant regulati<strong>on</strong>s and theirenforcement are yet <strong>to</strong> be formulated and f<strong>in</strong>alized. Limited <strong>in</strong>stituti<strong>on</strong>al capacity and technical<strong>in</strong>frastructure such as f<strong>in</strong>d<strong>in</strong>g, equipment and human resource have been identified <strong>in</strong> this <str<strong>on</strong>g>study</str<strong>on</strong>g>.Very limited <strong>in</strong>formati<strong>on</strong> and is another challenge as there is no systematic quantitativeassessment of the magnitude of the air quality due <strong>to</strong> <strong>in</strong>adequate capacity and resources. The levelof public awareness <strong>on</strong> the air polluti<strong>on</strong> problems and associated adverse effect <strong>to</strong> human healthand envir<strong>on</strong>ment is still low. The rapid growth of rural and urban populati<strong>on</strong> coupled <strong>with</strong> poorurban plann<strong>in</strong>g which allows for <strong>in</strong>appropriate allocati<strong>on</strong> of ec<strong>on</strong>omic activities <strong>with</strong><strong>in</strong> <strong>Kigali</strong> City isalso lead<strong>in</strong>g <strong>to</strong> air polluti<strong>on</strong>. Inadequate <strong>in</strong>stituti<strong>on</strong>al coord<strong>in</strong>ati<strong>on</strong> and collaborati<strong>on</strong> betweengovernment <strong>in</strong>stituti<strong>on</strong>s can lead <strong>to</strong> the lack of comm<strong>on</strong> strategies. Inadequate <strong>in</strong>volvement ofmajor stakeholders (e.g. local community, NGOs, private sec<strong>to</strong>r, <strong>in</strong>dustries) <strong>in</strong> address<strong>in</strong>g theenvir<strong>on</strong>mental problems has been noticed.
119As <strong>Kigali</strong> City urbanizes and the traffic density c<strong>on</strong>t<strong>in</strong>ues <strong>to</strong> grow, the result<strong>in</strong>g <strong>in</strong>crease <strong>in</strong> airpolluti<strong>on</strong> is becom<strong>in</strong>g an alarm<strong>in</strong>g c<strong>on</strong>cern for its <strong>in</strong>habitants especially dur<strong>in</strong>g the dry seas<strong>on</strong>s. Thesusta<strong>in</strong>able urban management of <strong>Kigali</strong> City calls therefore for tak<strong>in</strong>g comprehensive measures <strong>to</strong>reduce the air polluti<strong>on</strong> problem and its related human health effects.10.2. Recommendati<strong>on</strong>sRecogniz<strong>in</strong>g that transportati<strong>on</strong> is a major polluti<strong>on</strong> source <strong>in</strong> <strong>Kigali</strong> City, any strategy that geared<strong>to</strong> reduce or c<strong>on</strong>trol atmospheric polluti<strong>on</strong> has <strong>to</strong> <strong>in</strong>clude a transportati<strong>on</strong> improvement program.The ma<strong>in</strong> programs <strong>to</strong> combat air polluti<strong>on</strong> <strong>in</strong> <strong>Kigali</strong> that need <strong>to</strong> be c<strong>on</strong>sidered but not limited <strong>to</strong><strong>in</strong>clude:i. Establishment of c<strong>on</strong>t<strong>in</strong>uous air polluti<strong>on</strong> m<strong>on</strong>i<strong>to</strong>r<strong>in</strong>g system/schemes <strong>in</strong> <strong>Kigali</strong>CityThere is a need <strong>to</strong> establish the air polluti<strong>on</strong> taskforce <strong>in</strong> <strong>Rwanda</strong> and <strong>to</strong> build the exist<strong>in</strong>g capacity<strong>to</strong> <strong>in</strong>clude tra<strong>in</strong><strong>in</strong>g of scientists <strong>in</strong> learn<strong>in</strong>g <strong>in</strong>stituti<strong>on</strong>s focus<strong>in</strong>g <strong>on</strong> modell<strong>in</strong>g and impactassessment of air polluti<strong>on</strong> <strong>in</strong> <strong>Rwanda</strong>. The flow<strong>in</strong>g map shows where the air quality/polluti<strong>on</strong>m<strong>on</strong>i<strong>to</strong>r<strong>in</strong>g stati<strong>on</strong>s and its <strong>in</strong>frastrurure may be located <strong>in</strong> <strong>Kigali</strong> City.Figure 30: Proposed sites for air polluti<strong>on</strong> m<strong>on</strong>i<strong>to</strong>r<strong>in</strong>g stati<strong>on</strong>s
120The suitable site for air polluti<strong>on</strong> m<strong>on</strong>i<strong>to</strong>r<strong>in</strong>g stati<strong>on</strong>s have been proposed <strong>in</strong> the southern parts of<strong>Kigali</strong> City where the c<strong>on</strong>centrati<strong>on</strong> of air polluti<strong>on</strong> would expect <strong>to</strong> be highest than other areasbecause the general annual trend of w<strong>in</strong>d directi<strong>on</strong> is from North and North-East <strong>to</strong> the South.ii. Improv<strong>in</strong>g the transport system <strong>in</strong> urban areasMo<strong>to</strong>rized transport is <strong>on</strong>e of the major sources of air polluti<strong>on</strong> particularly <strong>in</strong> <strong>Kigali</strong> City due <strong>to</strong>traffic c<strong>on</strong>gesti<strong>on</strong> s<strong>in</strong>ce vehicles release more pollutants when idl<strong>in</strong>g than when speed<strong>in</strong>g; and<strong>in</strong>efficient mo<strong>to</strong>r vehicles especially sec<strong>on</strong>d-hand vehicles which not <strong>on</strong>ly pose mechanicalproblems but also envir<strong>on</strong>mental problems. In this regards, there is a need <strong>to</strong> promote publictransportati<strong>on</strong> <strong>with</strong> bigger capacity of passengers and newer quality (such as ONATRACOMbuses) and whiles also discourag<strong>in</strong>g the small cars use <strong>in</strong> transport like the m<strong>in</strong>i-bus of ATRACO.Other c<strong>on</strong>trol strategies are also required for <strong>in</strong>stance the c<strong>on</strong>trol of the number of private cars;prohibit the import of old cars, impose high tax <strong>on</strong> gas guzzlers, encourage car pool<strong>in</strong>g andtelecommut<strong>in</strong>g; strictly c<strong>on</strong>trol quality of imported fuels, promote the use of low sulfur diesel,<strong>in</strong>troduce the use of catalytic c<strong>on</strong>ver<strong>to</strong>rs <strong>to</strong> reduce exhaust emissi<strong>on</strong>s; c<strong>on</strong>trol eng<strong>in</strong>e c<strong>on</strong>diti<strong>on</strong>s.
121S<strong>in</strong>ce <strong>in</strong>complete combusti<strong>on</strong> <strong>in</strong> old or poorly ma<strong>in</strong>ta<strong>in</strong>ed eng<strong>in</strong>es is a direct cause of carb<strong>on</strong>m<strong>on</strong>oxide and unburned hydrocarb<strong>on</strong> emissi<strong>on</strong>s, the enforcement of eng<strong>in</strong>e ma<strong>in</strong>tenancestandards should be another goal of traffic. The major compulsory program implemented <strong>in</strong> thisdirecti<strong>on</strong> <strong>in</strong> other countries for example the United Sates is called the Inspecti<strong>on</strong> and Ma<strong>in</strong>tenanceProgram. It is a costly program, however, <strong>in</strong> <strong>Kigali</strong> City this process can be simplified by authoriz<strong>in</strong>gtraffic <strong>in</strong>spec<strong>to</strong>rs <strong>to</strong> s<strong>to</strong>p smok<strong>in</strong>g vehicles until they have been repaired and do not smoke anyl<strong>on</strong>ger. Reducti<strong>on</strong> of lead and sulfur <strong>in</strong> fuels and f<strong>in</strong>ally the <strong>in</strong>troducti<strong>on</strong> of catalytic c<strong>on</strong>verters willdrastically reduce polluti<strong>on</strong>. To significantly reduce emissi<strong>on</strong>s of dust by traffic and w<strong>in</strong>ds, a goodstrategy would be <strong>to</strong> populate the dusty roads, vacant areas, and park<strong>in</strong>g lots by those trees andshrubs that are native <strong>to</strong> the area. The <strong>in</strong>tensificati<strong>on</strong> of pavement of dirt roads and othersec<strong>on</strong>dary streets can also be promoted if the f<strong>in</strong>ancial means are not a c<strong>on</strong>stra<strong>in</strong>t.iii. Promot<strong>in</strong>g the public awareness and educati<strong>on</strong>.Awareness creati<strong>on</strong> efforts should c<strong>on</strong>t<strong>in</strong>ue target<strong>in</strong>g key stakeholders (policy and decisi<strong>on</strong>makers, journalists, <strong>in</strong>dustrialists) as well as ma<strong>in</strong>stream<strong>in</strong>g air quality management <strong>in</strong> schoolcurricula. It may be worth support<strong>in</strong>g NGOs and professi<strong>on</strong>al associati<strong>on</strong>s deal<strong>in</strong>g <strong>with</strong> awarenesscreati<strong>on</strong> acti<strong>on</strong>. Another opti<strong>on</strong> would be <strong>to</strong> collaborate <strong>with</strong> the mass media <strong>to</strong> launch extensiveenvir<strong>on</strong>mental campaign <strong>on</strong> polluti<strong>on</strong> preventi<strong>on</strong> <strong>to</strong>pics for free.iv. Promot<strong>in</strong>g the use of renewable energy sources such bio-fuelIn an effort <strong>to</strong> f<strong>in</strong>d a soluti<strong>on</strong> <strong>to</strong> the current problem of fuel and air polluti<strong>on</strong> from vehicularemissi<strong>on</strong>s <strong>in</strong> <strong>Rwanda</strong>; there is a need <strong>to</strong> support biodiesel research and development as a majorcomp<strong>on</strong>ent of renewable energies. With this regards, the IRST is explor<strong>in</strong>g the use of biodiesel asa renewable energy. There are huge benefits that can result from the development of a biodiesel<strong>in</strong>dustry <strong>in</strong> <strong>Rwanda</strong> <strong>in</strong>clud<strong>in</strong>g the improved envir<strong>on</strong>ment and health; easy blend<strong>in</strong>g <strong>with</strong> petroleumdiesel; better eng<strong>in</strong>e lubricati<strong>on</strong>; and safe transportati<strong>on</strong>. Indeed, Biodiesel fuel burns up <strong>to</strong> 75%cleaner than c<strong>on</strong>venti<strong>on</strong>al diesel fuel made from fossil fuels. Biodiesel substantially reducesunburned hydrocarb<strong>on</strong>s, carb<strong>on</strong> m<strong>on</strong>oxide and particulate matter <strong>in</strong> exhaust fumes. Sulphurdioxideemissi<strong>on</strong>s are elim<strong>in</strong>ated as biodiesel c<strong>on</strong>ta<strong>in</strong>s no sulphur. Biodiesel is plant-based and adds noCO 2 <strong>to</strong> the atmosphere. The oz<strong>on</strong>e-form<strong>in</strong>g potential of biodiesel emissi<strong>on</strong>s is nearly 50% less thanc<strong>on</strong>venti<strong>on</strong>al diesel fuel. Biodiesel exhaust is not offensive and doesn't cause eye irritati<strong>on</strong>.
122Biodiesel is envir<strong>on</strong>mentally friendly: it is renewable, "more biodegradable than sugar and less<strong>to</strong>xic than table salt“. Biodiesel can be used <strong>in</strong> any diesel eng<strong>in</strong>e. Fuel ec<strong>on</strong>omy is the same asc<strong>on</strong>venti<strong>on</strong>al diesel fuel. Biodiesel is a much better lubricant than c<strong>on</strong>venti<strong>on</strong>al diesel fuel andextends eng<strong>in</strong>e life. Biodiesel has a high cetanerat<strong>in</strong>g, which improves eng<strong>in</strong>e performance: 20%biodiesel added <strong>to</strong> c<strong>on</strong>venti<strong>on</strong>al diesel fuel improves the cetanerat<strong>in</strong>g 3 po<strong>in</strong>ts, mak<strong>in</strong>g it apremium fuel (Nduwayezu, 2010).v. C<strong>on</strong>duct an impact assessment <strong>on</strong> health and envir<strong>on</strong>ment10.3. Acti<strong>on</strong>s related <strong>to</strong> recommendati<strong>on</strong>sRecommendati<strong>on</strong> Acti<strong>on</strong>s (not exhaustive) Resp<strong>on</strong>sible<strong>Air</strong> polluti<strong>on</strong> m<strong>on</strong>i<strong>to</strong>r<strong>in</strong>gsystem/schemes <strong>in</strong> <strong>Kigali</strong> CityBiodiesel research anddevelopmentSelecti<strong>on</strong> of the resp<strong>on</strong>sible entitiesEstablishment of m<strong>on</strong>i<strong>to</strong>r<strong>in</strong>g strategySelecti<strong>on</strong> of suitable for locat<strong>in</strong>g them<strong>on</strong>i<strong>to</strong>r<strong>in</strong>g stati<strong>on</strong>sM<strong>on</strong>i<strong>to</strong>r<strong>in</strong>g stati<strong>on</strong> establishment ou<strong>to</strong>f <strong>Kigali</strong>Reahabilitati<strong>on</strong> of weather stati<strong>on</strong>s <strong>in</strong><strong>Rwanda</strong>, especially <strong>in</strong> urban areasEstablishment of the Nati<strong>on</strong>alambient air quality standardsSet up of a large plantati<strong>on</strong> <strong>on</strong>marg<strong>in</strong>al lands and degraded hill<strong>to</strong>psfor jatropha, palm, soy, mor<strong>in</strong>gasugar...etc.Creati<strong>on</strong> of Biomass ResearchCentreEstablishment of more biofuellabora<strong>to</strong>ries <strong>in</strong> different areas of<strong>Rwanda</strong>Pilot Green Transport Fund <strong>to</strong>encourage the <strong>in</strong>troducti<strong>on</strong> of<strong>in</strong>novative transport technologyIncentive for the car user and car<strong>REMA</strong><strong>REMA</strong><strong>REMA</strong>, MININFRAMININFRAMININFRARBSISAR, MINAGRI, IRST,NURIRSTIRST<strong>REMA</strong>, IRST<strong>REMA</strong>,RRA
123Improv<strong>in</strong>g public transport <strong>in</strong>urban areasProhibit<strong>in</strong>g import<strong>in</strong>g old carsor restricti<strong>on</strong> of car’simportati<strong>on</strong> that is older thanspecific years of producti<strong>on</strong>Promot<strong>in</strong>g the publicawareness and educati<strong>on</strong>owners <strong>to</strong> opt for ecology carsRoad network improvement <strong>to</strong> cater<strong>to</strong> the over-<strong>in</strong>creas<strong>in</strong>g car populati<strong>on</strong><strong>on</strong> roadsTo put <strong>in</strong> place an efficient andc<strong>on</strong>venient public transport system<strong>with</strong><strong>in</strong> <strong>Kigali</strong> CityIncrease the carry<strong>in</strong>g capacity ofpublic buses by phas<strong>in</strong>g out m<strong>in</strong>i-bustaxis and <strong>in</strong>troduc<strong>in</strong>g buses <strong>with</strong>higher capacity such as the l<strong>on</strong>gbuses or articulated busesTo create a c<strong>on</strong>ducive for greentransport (walk<strong>in</strong>g and cycl<strong>in</strong>g )where is possibleCar emissi<strong>on</strong>s <strong>in</strong>specti<strong>on</strong> and c<strong>on</strong>trolprogramAny mo<strong>to</strong>r vehicle should be <strong>in</strong>compliance <strong>with</strong> the applicableemissi<strong>on</strong>s standards determ<strong>in</strong>ed atan official <strong>in</strong>specti<strong>on</strong> stati<strong>on</strong>Specificati<strong>on</strong>s of fuels <strong>to</strong> be used <strong>in</strong><strong>Rwanda</strong>Introduce a subsidy <strong>to</strong> encourage theuse of eco-cars.Institute a dynamic program <strong>in</strong>schools of the country at all levelsEducate the future generati<strong>on</strong> of thecountry <strong>on</strong> the health effects of airpolluti<strong>on</strong> and polluti<strong>on</strong>preventi<strong>on</strong>MININFRAMININFRA and <strong>Kigali</strong>CityRURA, RRA, ATRACO,ONATRACOM<strong>Kigali</strong> CityRNP, RBSRNP, RBS, RRAMINICOMMINICOM, RRAMINEDUC and all Highlearn<strong>in</strong>g Instituti<strong>on</strong>sMINEDUC; High learn<strong>in</strong>gInstituti<strong>on</strong>s, Mass Media(<strong>Rwanda</strong> Radio <strong>Rwanda</strong>Televisi<strong>on</strong>....).
12411. ReferencesAib<strong>in</strong>u, A. (2001) GIS Applicati<strong>on</strong> <strong>in</strong> urban plann<strong>in</strong>g and urban management: Utilis<strong>in</strong>g GIS <strong>in</strong> <strong>Kigali</strong>urban plann<strong>in</strong>g and city management. CORP 2001, p. 93-96, Vienna University ofTechnology.Alpopi, C., and Colesca, S.E. (2010) Urban air quality: A comparative <str<strong>on</strong>g>study</str<strong>on</strong>g> of major EuropeanCapitals. Theoritical and Empirical Researches <strong>in</strong> Urban Management, 6(15), 92-107.Bai, X., and Imura, H. (2000). A comparative <str<strong>on</strong>g>study</str<strong>on</strong>g> of urban envir<strong>on</strong>ment <strong>in</strong> East Asia: stage modelof urban envir<strong>on</strong>mental evoluti<strong>on</strong>. Internati<strong>on</strong>al Review for Envir<strong>on</strong>mental Strategies, 1.Barigye, T. (2009) <strong>Rwanda</strong>: Few Companies Have Waste Treatment Systems-<strong>REMA</strong>.http://www.newtimes.co.rw/, 25 Oc<strong>to</strong>ber 2009.Bizimana, J.P., and Schill<strong>in</strong>g, M. (2010) Geo-Informati<strong>on</strong> Technology for Infrastructural Flood RiskAnalysis <strong>in</strong> Unplanned Settlements: a case <str<strong>on</strong>g>study</str<strong>on</strong>g> of <strong>in</strong>formal settlement flood risk <strong>in</strong> theNyabugogo flood pla<strong>in</strong>, <strong>Kigali</strong> City, <strong>Rwanda</strong>. In P.S. Showalter, and Y. Lu, Eds. GeospatialTechniques <strong>in</strong> Urban Hazard and Disaster Analysis. Spr<strong>in</strong>ger, Netherlands.Borchers, M. (1997) Strategies <strong>to</strong> promote ec<strong>on</strong>omically sound energy use <strong>in</strong> low-<strong>in</strong>comehouseholds. Energy & Development Group. Cape Town.Borchers, M., and Annecke, W. (2006) Policy Brief: Poverty-Envir<strong>on</strong>ment-Energy L<strong>in</strong>kages <strong>in</strong><strong>Rwanda</strong>; Prepared for United Nati<strong>on</strong>s Envir<strong>on</strong>ment Programme (UNEP) by Susta<strong>in</strong>ableEnergy Africa.Byamukama, B., Carey, C., Cole, M., Dyszynski, J., and Warnest, M. (2011) Nati<strong>on</strong>al Strategy <strong>on</strong>Climate Change and Low Carb<strong>on</strong> Development for <strong>Rwanda</strong>; Basel<strong>in</strong>e Report.Care Internati<strong>on</strong>al <strong>Rwanda</strong>. (2010) Community assisted access <strong>to</strong> susta<strong>in</strong>able energy project; CareInternati<strong>on</strong>al <strong>in</strong> <strong>Rwanda</strong>; Annual Narrative Report 2010.Chris<strong>to</strong>phersen, K.B., A. (1999) <strong>Rwanda</strong> Energy Sec<strong>to</strong>r Rehabilitati<strong>on</strong> Study <strong>on</strong> Safeguard<strong>in</strong>g theBiomass Supply, Biomass Energy Assessment work plan. Prepared for the World Bankand the M<strong>in</strong>istry of Energy, Water and Nati<strong>on</strong>al Resources, <strong>Kigali</strong>, <strong>Rwanda</strong>.Damte, A., and Koch, S.F. (2011) Clean Fuel Sav<strong>in</strong>g Technology Adopti<strong>on</strong> <strong>in</strong> Urban Ethiopia;University of Pre<strong>to</strong>ria; Department of Ec<strong>on</strong>omics Work<strong>in</strong>g Paper Series; Work<strong>in</strong>g Paper:2011-09, April 2011.
125Durand-Lasserve, A. (2005) Market-Driven Displacements and Perpetuati<strong>on</strong> of Informalsettlements <strong>in</strong> Develop<strong>in</strong>g Cities. 6th N-AERUS Research C<strong>on</strong>ference <strong>on</strong> Cities <strong>in</strong> South.Cap Town University Press, Cap Town, South Africa.EAC. (2010a) <strong>Air</strong> quality - Emissi<strong>on</strong>s <strong>to</strong> the air by cement fac<strong>to</strong>ries guidel<strong>in</strong>es; EAST AfricanStandard, East African Community (EAC); First Editi<strong>on</strong> 2010.EAC. (2010b) <strong>Air</strong> quality – Specificati<strong>on</strong>; EAST African Standard, East African Community (EAC);First Editi<strong>on</strong> 2010; CD/T/66/2010Elsom, D.M. (1992) Atmospheric Polluti<strong>on</strong>: A Global Problem, Sec<strong>on</strong>d Editi<strong>on</strong>. Oxford: BrackwellPublishers.Government of <strong>Rwanda</strong>. (2005) Organic Law Determ<strong>in</strong><strong>in</strong>g the Modalities of Protecti<strong>on</strong>,C<strong>on</strong>servati<strong>on</strong> and Promoti<strong>on</strong> of the Envir<strong>on</strong>ment <strong>in</strong> <strong>Rwanda</strong>; Official Gazette of theRepublic of <strong>Rwanda</strong>, No. 04/2005 of 08/04/2005.Government of <strong>Rwanda</strong>. (2008) Envir<strong>on</strong>mental Health Policy, M<strong>in</strong>istry of Health, <strong>Kigali</strong>, <strong>Rwanda</strong>.http://www.moh.gov.rw.Government of <strong>Rwanda</strong>. (2010) Operati<strong>on</strong>al Audit Report of <strong>Rwanda</strong> Envir<strong>on</strong>ment ManagementAuthority; the Office of the Ombudsman; November 2010.GTZ. (2011) The potential of susta<strong>in</strong>able liquid biofuel producti<strong>on</strong> <strong>in</strong> <strong>Rwanda</strong> A <str<strong>on</strong>g>study</str<strong>on</strong>g> <strong>on</strong> theagricultural, technical and ec<strong>on</strong>omic c<strong>on</strong>diti<strong>on</strong>s and food security; Eschborn, February2011.Gwilliam, K., and Kojima, M. (2004) Urban <strong>Air</strong> Polluti<strong>on</strong>: Policy Framework for Mobile Sources,Prepared for the <strong>Air</strong> Quality Thematic Group, World Bank (www.worldbank.org).http://www.cleanairnet.org/cai/1403/articles-56396_entire_handbook.pdf.Han, X., and Naeher, L.P. (2006) A review of traffic-related air polluti<strong>on</strong> exposure assessmentstudies <strong>in</strong> the develop<strong>in</strong>g world. Envir<strong>on</strong>ment Internati<strong>on</strong>al, 32(1), 106-120.HEI. (2007) Mobile-Source <strong>Air</strong> Toxics: A Critical Review of the Current Literature <strong>on</strong> Exposure andHealth Effects, Special Report 16, Health Effects Institute.http://pubs.healtheffects.org/view.php?id=282.Henn<strong>in</strong>ger, S. (2009) Urban Climate and <strong>Air</strong> Polluti<strong>on</strong> <strong>in</strong> <strong>Kigali</strong>, <strong>Rwanda</strong>. The seventh Internati<strong>on</strong>alC<strong>on</strong>ference <strong>on</strong> Urban Climate, 29June-3July 2009, Yokohama, Japan.
126Hertel, O., and Goodsite, M.E. (2009) Urban <strong>Air</strong> Polluti<strong>on</strong> Climates throughout the World; Issues <strong>in</strong>Envir<strong>on</strong>mental Science and Technology, No 28, <strong>Air</strong> Quality <strong>in</strong> Urban Envir<strong>on</strong>ments.Ingabire, A.S. (2009) A <str<strong>on</strong>g>study</str<strong>on</strong>g> of atmospheric aerosols <strong>in</strong> <strong>Kigali</strong> City; <strong>Kigali</strong> Institute of Science andTechnology (KIST), <strong>Kigali</strong>, November 2009.Ishii, S. (2004) Urban <strong>Air</strong> Polluti<strong>on</strong> and Urban Management: Applicability of Ecosystem Approachand the Way Forward; UNU-IAS Work<strong>in</strong>g Paper No 120.Kathuria, V. (2001) Vehicular Polluti<strong>on</strong> C<strong>on</strong>trols <strong>in</strong> Delhi, India-Are the efforts enough? The BeijerInstitute, Internati<strong>on</strong>al <strong>in</strong>stitute of Ecological Ec<strong>on</strong>omics.Krzyzanowski, M., Kuna-Dibbert, B., and Schneider, J. (2005) Health effects of transport-related airpolluti<strong>on</strong>; The Regi<strong>on</strong>al Office for Europe of the World Health Organizati<strong>on</strong>Mabogunje, A.L. (1995) The Envir<strong>on</strong>mental Challenges <strong>in</strong> Sub-Saharan Africa. Envir<strong>on</strong>ment, 37(4),4-11.MINECOFIN. (2000) <strong>Rwanda</strong> Visi<strong>on</strong> 2020, 2000. M<strong>in</strong>istry of F<strong>in</strong>ance and Ec<strong>on</strong>omic Plann<strong>in</strong>g,Government of <strong>Rwanda</strong> (GoR), <strong>Kigali</strong>, <strong>Rwanda</strong>, July 2000.MINECOFIN. (2002) The 3 rd General Census of Populati<strong>on</strong> and Hous<strong>in</strong>g <strong>in</strong> <strong>Rwanda</strong>, <strong>Kigali</strong>,M<strong>in</strong>istry of F<strong>in</strong>ance and Ec<strong>on</strong>omic Plann<strong>in</strong>g, <strong>Kigali</strong>.MININFRA. (2004) Energy policy for <strong>Rwanda</strong>; M<strong>in</strong>istry of Infrastructure (MININFRA), <strong>Kigali</strong>,<strong>Rwanda</strong>MININFRA. (2008) Nati<strong>on</strong>al Urban Hous<strong>in</strong>g Policy for <strong>Rwanda</strong>; M<strong>in</strong>istry of Infrastructure; Republicof <strong>Rwanda</strong>, <strong>Kigali</strong>.MININFRA. (2009a) <strong>Kigali</strong> City Sub-Areas Plann<strong>in</strong>g: Detailed Transportati<strong>on</strong> and InfrastructureMaster Plan Report for Nyarugenge District, December 2009, Volume 7.MININFRA. (2009b) Nati<strong>on</strong>al Energy Policy and Nati<strong>on</strong>al Energy Strategy 2008-2012, MININFRA,Government of <strong>Rwanda</strong>, Funded by the EUEI.Mi<strong>to</strong>, T. (2010) <strong>Air</strong> Polluti<strong>on</strong> M<strong>on</strong>i<strong>to</strong>r<strong>in</strong>g <strong>in</strong> <strong>Kigali</strong> City.http://www.njaq<strong>in</strong>ow.net/App_AQI/AQI.en-US.pdf.Mugabo, C. (2011) Ambient <strong>Air</strong> Quality <strong>in</strong> a Low Income Urban Area <strong>on</strong> the South AfricanHighveld: A Case Study of Leandra Township, MSc Thesis, University of theWitwatersrand, Johannesburg, 2011.
127Nduwayezu, J.B. (2010) Socio-ec<strong>on</strong>omic Impact of Biodiesel Producti<strong>on</strong> <strong>in</strong> <strong>Rwanda</strong>; Institute ofScientific and Technological Research(IRST),www.irst.ac.rw/IMG/pdf/Dr_NDUWAYEZU_PRESENTATION-2.pdfNiyogi, D.S., and Patil, R.S. (1994) Technical note a modified w<strong>in</strong>drose for air quality management.Almosphenc Envw<strong>on</strong>ment, 28(9), 1715-1717.Nuwar<strong>in</strong>da, H. (2007) <strong>Air</strong> Polluti<strong>on</strong> Study of a Highveld Township dur<strong>in</strong>g a BASA NJENGOMAGOGO Rollout. Unpublished MSc thesis, University of Johannesburg-South Africa.OECD. (1995) Mo<strong>to</strong>r Vehicle polluti<strong>on</strong>: Reducti<strong>on</strong> Strategies Bey<strong>on</strong>d 2020, Organisati<strong>on</strong> forEc<strong>on</strong>omic Co-operati<strong>on</strong> and Development (OECD), Paris: OECD, 1995.ORNL. (2005) Transportati<strong>on</strong> Energy Data Book, USDOE. www.doe.gov.Pérouse de M<strong>on</strong>tclos, M.A. (2002) <strong>Kigali</strong> après la guerre: la questi<strong>on</strong> f<strong>on</strong>cière et l’accès aulogement. Centre Français sur la Populati<strong>on</strong> et le Développement. Dossier du CEPED N°57. Février 2000.<strong>REMA</strong>. (2009) <strong>Rwanda</strong> state of the Envir<strong>on</strong>ment and Outlook Report; <strong>Rwanda</strong> Envir<strong>on</strong>mentManagement Authority (<strong>REMA</strong>), <strong>Kigali</strong>, <strong>Rwanda</strong>.RNP. (2011) <strong>Rwanda</strong>n police move <strong>to</strong> curb vehicle gas emissi<strong>on</strong>s, <strong>Rwanda</strong> Nati<strong>on</strong>al Police (RNP),April 2011.Sano, J.C. (2007) Challenges and Opportunities for Modernized Decentralised Sanitati<strong>on</strong> System<strong>in</strong> Poor Neighborhoods: <strong>Kigali</strong>, <strong>Rwanda</strong>, MSc Thesis, Wagen<strong>in</strong>gen University,Wagen<strong>in</strong>gen, Netherlands.Serrar, M., Hatfield, M., and Bents<strong>on</strong>, S. (2010) <strong>Rwanda</strong> Tra<strong>in</strong><strong>in</strong>g and WBT-CCT Correlati<strong>on</strong> Study;PCIA- Aprovecho Research Center; December, 2010.Sobbot<strong>in</strong>a, T.P., and Sheram , K.A. (2000) Bey<strong>on</strong>d Ec<strong>on</strong>omic Growth; Meet<strong>in</strong>g the challenge ofGlobal Development; The Internati<strong>on</strong>al Bank for Rec<strong>on</strong>structi<strong>on</strong> and Development/TheWorld Bank.Stephen, T.H., J<strong>on</strong>athan, M.S., K, H.S., and L.M, R. (2007) <strong>Air</strong> Polluti<strong>on</strong> and Health. Elsevier,L<strong>on</strong>d<strong>on</strong>, United K<strong>in</strong>gdom.SURBANA. (2010) <strong>Kigali</strong> City Sub-areas Plann<strong>in</strong>g: Detailed Transportati<strong>on</strong> and InfrastructureMaster Plan; Report for Nyarugenge District; February 2010.The State of Queensland. (2011) Meteorological data; Department of Envir<strong>on</strong>ment and ResourceManagement.
128http://www.derm.qld.gov.au/envir<strong>on</strong>mental_management/air/air_quality_m<strong>on</strong>i<strong>to</strong>r<strong>in</strong>g/meteorological_data/.Thorne, S. (1997) Ec<strong>on</strong>omic costs of energy services <strong>in</strong> South African Cities. Energy ResearchCentre, University of Cape Town.UN-Habitat. (2009) Plann<strong>in</strong>g Susta<strong>in</strong>able Cities: Policy directi<strong>on</strong>s-A global report <strong>on</strong> humansettlements 2009; United Nati<strong>on</strong>al Human Settlement Programme, Nairobi, Kenya;L<strong>on</strong>d<strong>on</strong>-Sterl<strong>in</strong>g, VA; EarthScan.UNCHS. (1996) An Urbaniz<strong>in</strong>g World: Global Report <strong>on</strong> Human Settlements, United Nati<strong>on</strong>sCentre for Human Settlements, (Habitat), Oxford University Press, 1996.UNEP. (1997) Asia-Pacific Envir<strong>on</strong>ment Outlook.United Nati<strong>on</strong> Envir<strong>on</strong>mental Programme (UNEP)and Envir<strong>on</strong>ment Assessment Programme for Asia and the Pacific (EAPAP) [On-l<strong>in</strong>e],1997. Available at: http://www.eapap.unep.org/apeo/<strong>in</strong>dex.html.UNEP. (2004) Malé Declarati<strong>on</strong> <strong>on</strong> C<strong>on</strong>trol and Preventi<strong>on</strong> of <strong>Air</strong> Polluti<strong>on</strong> and Its LikelyTransboundary Effects for South Asia; United Nati<strong>on</strong>s for Envir<strong>on</strong>ment Programme(UNEP); Regi<strong>on</strong>al Resource Center for Asia and the Pacific.Urwibutso, N.J. (2008) Mak<strong>in</strong>g sanitati<strong>on</strong> matter: Analysis of the sanitati<strong>on</strong> issues <strong>in</strong> <strong>Rwanda</strong> andthe possibilities for <strong>in</strong>troduc<strong>in</strong>g Ecological Sanitati<strong>on</strong> <strong>in</strong> <strong>Kigali</strong> city. UNESCO-IHE; InstituteFor Water Educati<strong>on</strong>, Delft, The Netherlands.US-EPA. (1994) Au<strong>to</strong>mobile Emissi<strong>on</strong>s: An Overview. U.S. Envir<strong>on</strong>mental Protecti<strong>on</strong> Agency,Office of Mobile Sources, EPA 400-F-92-007.US-EPA. (2011) Health and Envir<strong>on</strong>ment; United States-Envir<strong>on</strong>mental Protecti<strong>on</strong> Agency (US-EPA), www.epa.gov/air/oz<strong>on</strong>epolluti<strong>on</strong>/health.htmlHealth.Last updated <strong>on</strong> Friday, May 13,2011.Verma, S.S., and Desai, B. (2008) Effect of Meteorological C<strong>on</strong>diti<strong>on</strong>s <strong>on</strong> <strong>Air</strong> Polluti<strong>on</strong> of SuratCity. Journal of Internati<strong>on</strong>al Envir<strong>on</strong>mental Applicati<strong>on</strong> & Science, 3(5), 358-367.v<strong>on</strong> Schirnd<strong>in</strong>, Y. (2002) Health <strong>in</strong> Susta<strong>in</strong>able Development Plann<strong>in</strong>g: The Role of Indica<strong>to</strong>rs;World Health Organizati<strong>on</strong>, Geneva, 2002.Watkiss, P., Pye, S., Dyszynsk, J., and Bodansky, D. (2009) A Rapid Assessment of a Nati<strong>on</strong>alEnergy and Low Carb<strong>on</strong> Path for <strong>Rwanda</strong>.WHO. (1992) Our Planet, Our Health; United Nati<strong>on</strong>s World Health Organizati<strong>on</strong>; Commissi<strong>on</strong> <strong>on</strong>Health and the Envir<strong>on</strong>ment. Geneva
129WHO. (1997a) Health and Envir<strong>on</strong>ment <strong>in</strong> Susta<strong>in</strong>able Development: Five Years after EarthSummit, Geneva.WHO. (1997b) Intersec<strong>to</strong>ral Acti<strong>on</strong> for Health; Address<strong>in</strong>g Health and Envir<strong>on</strong>ment <strong>in</strong> Susta<strong>in</strong>ableDevelopment; United Nati<strong>on</strong>s World Health Organizati<strong>on</strong> (WHO), Geneva.WHO. (2002a) Address<strong>in</strong>g the Impact of Household Energy and Indoor <strong>Air</strong> Polluti<strong>on</strong> <strong>on</strong> the Healthof the Poor: Implicati<strong>on</strong>s for Policy Acti<strong>on</strong> and Interventi<strong>on</strong> Measures; Paper Prepared forthe Commissi<strong>on</strong> <strong>on</strong> Macroec<strong>on</strong>omics and Health; World Health Organizati<strong>on</strong> 2002.WHO. (2002b) Health impact assessment of air polluti<strong>on</strong> <strong>in</strong> the eight major Italian cities; WorldHealth Organizati<strong>on</strong> (WHO); Regi<strong>on</strong>al Office for Europe.WHO. (2003) Health Aspects of <strong>Air</strong> Polluti<strong>on</strong> <strong>with</strong> Particulate Matter, Oz<strong>on</strong>e and Nitrogen Dioxide.WHO Geneva, Switzerland.WHO. (2006) <strong>Air</strong> quality guidel<strong>in</strong>es for particulate matter, oz<strong>on</strong>e, nitrogen dioxide and sulfurdioxide; Global update 2005- Summary of risk assessment, Geneva, 22 p.