MBA Employment Report - MIT Sloan School of Management
MBA Employment Report - MIT Sloan School of Management
MBA Employment Report - MIT Sloan School of Management

Create successful ePaper yourself
Turn your PDF publications into a flip-book with our unique Google optimized e-Paper software.
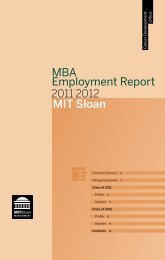
07<br />
08<br />
<strong>MBA</strong><br />
<strong>Employment</strong><br />
<strong>Report</strong><br />
<strong>MIT</strong> <strong>Sloan</strong><br />
From the Director 1<br />
Class <strong>of</strong> 2007<br />
Pr<strong>of</strong>ile 2<br />
Salaries 3<br />
Class <strong>of</strong> 2008<br />
Pr<strong>of</strong>ile 6<br />
Salaries 7<br />
Contacts back cover<br />
<strong>MIT</strong> <strong>Sloan</strong><br />
<strong>MBA</strong> Program
Employers Hiring Members <strong>of</strong> the Classes <strong>of</strong> 2007 and 2008<br />
A.T. Kearney<br />
A123 Systems<br />
Accenture<br />
AdMob<br />
Adobe Systems<br />
Advanced American<br />
Electronics<br />
Advanced Electron<br />
Beams<br />
Advanced Technology<br />
Ventures<br />
Aéropostale<br />
Agility<br />
Akamai Technologies<br />
Alnylam<br />
Pharmaceuticals<br />
Altman Vilandrie &<br />
Company<br />
Amazon.com<br />
American Express<br />
Amgen<br />
Analysis Group<br />
Anheuser-Busch<br />
Companies<br />
Apple<br />
Arnhold and<br />
S. Bleichroeder<br />
Advisers<br />
Ascent Venture<br />
Partners<br />
Atlas Venture<br />
Bain & Company<br />
Banc <strong>of</strong> America<br />
Securities<br />
Bank <strong>of</strong> America<br />
Bank <strong>of</strong> New York<br />
Mellon<br />
Barclays<br />
Bates White<br />
Bayer Corporation<br />
Bear, Stearns<br />
& Co.<br />
Bechtel Corporation<br />
Billow Butler &<br />
Company<br />
Biogen Idec<br />
Black Creek Group<br />
Black Duck S<strong>of</strong>tware<br />
The Blackstone Group<br />
Boehringer Ingelheim<br />
Boeing<br />
Booz Allen<br />
Hamilton<br />
Bose Corporation<br />
BCG<br />
Boston Scientific<br />
Corporation<br />
BP Solar<br />
The Brattle Group<br />
The Bridgespan Group<br />
Brightcove<br />
CA (Computer<br />
Associates)<br />
Cambridge Associates<br />
The Carlyle Group<br />
Cartier<br />
Caterpillar<br />
CB Richard Ellis<br />
CEMEX<br />
China International<br />
Capital Corporation<br />
Cisco Systems<br />
Citi<br />
Citizens Energy<br />
CJ Entertainment<br />
Colony Capital<br />
Comcast Interactive<br />
Capital<br />
Cone<br />
Conergy<br />
Cooper Industries<br />
Copper Rock Capital<br />
Partners<br />
Cornerstone Research<br />
The Corporation for<br />
Public Broadcasting<br />
Credit Suisse<br />
CSMG ADVENTIS<br />
Cummins<br />
Cytyc Corporation<br />
DAI<br />
DarwinSuzs<strong>of</strong>t<br />
DC Energy<br />
Dell<br />
Deloitte<br />
Consulting<br />
Deutsche Bank<br />
Diamond<br />
<strong>Management</strong><br />
& Technology<br />
Consultants<br />
Digitas<br />
Domino Foods<br />
eBay<br />
Edgeview Partners<br />
Education Pioneers<br />
Eli Lilly and Company<br />
Elsevier<br />
ELV Associates<br />
EMC<br />
EMI Music<br />
Emmis<br />
Communications<br />
Endeavor<br />
Endeca Technologies<br />
EnerNOC<br />
The Estée Lauder<br />
Companies<br />
Evergreen Solar<br />
ExxonMobil<br />
Facebook<br />
Fidelity<br />
Flextronics<br />
Flywheel Ventures<br />
Fortress Investment<br />
Group<br />
Garage Technology<br />
Ventures Canada<br />
Gartner<br />
Genentech<br />
General Electric<br />
General Motors<br />
Genzyme<br />
Glencore<br />
Globespan Capital<br />
Partners<br />
Goldman Sachs<br />
Google<br />
Grove International<br />
Partners<br />
Hakuhodo<br />
Harmonix Music<br />
Systems<br />
Harrah’s<br />
Entertainment<br />
Headwaters<br />
Economics<br />
Health Advances<br />
HelioVolt<br />
Hewlett-Packard<br />
H.J. Heinz<br />
Honeywell<br />
The HSBC Group<br />
Hubert Burda Media<br />
HubSpot<br />
IBM<br />
IDG Ventures Boston<br />
iMDs<strong>of</strong>t<br />
Infosys<br />
Innologic Pune<br />
Polyrub &<br />
Engineering<br />
Innosight<br />
Intel<br />
InterGen<br />
Introgen Therapeutics<br />
Intuit<br />
Inversiones Los<br />
Guindos<br />
ITT<br />
Jefferies & Company<br />
Johnson &<br />
Johnson<br />
JPMorgan Chase<br />
Kaupthing Bank<br />
KPMG<br />
Kraft Foods<br />
L.E.K. Consulting<br />
Lehman Brothers<br />
Liberty Mutual<br />
Limited Brands<br />
Loomis, Sayles &<br />
Company<br />
Luminus Devices<br />
<strong>Management</strong><br />
Consulting Services<br />
Mars & Co<br />
Marshall Wace<br />
Mascoma Corporation<br />
McKinsey &<br />
Company<br />
Mercatus Partners<br />
Merrill Lynch<br />
MFS Investment<br />
<strong>Management</strong><br />
Micros<strong>of</strong>t<br />
MKS Partners<br />
Monitor<br />
Monster<br />
Morgan Stanley<br />
Motorola<br />
Mozilla Corporation<br />
MTPV Corporation<br />
MTV Networks<br />
National Parks<br />
Service<br />
NBC Universal<br />
Network Appliance<br />
News Corporation<br />
Nicholas-Applegate<br />
Capital<br />
<strong>Management</strong><br />
The Nicobar Group<br />
NODE<br />
Nokia<br />
Nomura Securities<br />
Novartis<br />
Nth Power<br />
NVIDIA<br />
NWI <strong>Management</strong><br />
OC&C Strategy<br />
Consultants<br />
Oddo & Cie<br />
Oliver Wyman<br />
Oracle<br />
PARC<br />
Parish Capital<br />
Advisors<br />
The Parthenon<br />
Group<br />
PayPal<br />
Pearson Education<br />
Pioneer Investments<br />
Plainfield Asset<br />
<strong>Management</strong><br />
Polar Sports<br />
PRTM<br />
PureTech Ventures<br />
Putnam Associates<br />
Raytheon<br />
Reebok<br />
The Richman Group<br />
Ripplewood Holdings<br />
The Riverside<br />
Company<br />
The Rock Creek Group<br />
Safeway<br />
Sage Asset<br />
<strong>Management</strong><br />
SAP<br />
Saudi Arabian<br />
General Investment<br />
Authority<br />
Schlumberger<br />
Simon Property Group<br />
Simon-Kucher &<br />
Partners<br />
Sirios Capital<br />
<strong>Management</strong><br />
Sistema de Ensino<br />
Aprender<br />
Small-Scale<br />
Sustainable<br />
Infrastructure<br />
Development Fund<br />
Staples<br />
Starwood Hotels<br />
and Resorts<br />
Worldwide<br />
State Street Global<br />
Advisors<br />
Sun Microsystems<br />
Susquehanna<br />
International Group<br />
Symantec<br />
Synergo<br />
Synthes<br />
T. Rowe Price<br />
Taiwan<br />
Semiconductor<br />
Manufacturing<br />
Company<br />
Techno-Sciences<br />
Tesla Motors<br />
Textron<br />
Thomas J. Herzfeld<br />
Advisors<br />
Thermo Fisher<br />
Scientific<br />
The Thomson<br />
Corporation<br />
THQ<br />
Tiedemann<br />
Investment Group<br />
Time Warner<br />
Tishman Speyer<br />
T-Mobile<br />
The Travelers<br />
Companies<br />
Trillium Asset<br />
<strong>Management</strong><br />
Trinity Boston<br />
Foundation<br />
Turbine<br />
Twentieth Century Fox<br />
UBS Financial<br />
Services<br />
Unilever<br />
Unison Capital<br />
University Fashions<br />
Vela Systems<br />
Vertica Systems<br />
Virgo Capital<br />
VistaPrint<br />
VMware<br />
W.R. Huff Asset<br />
<strong>Management</strong><br />
Walker Magnetics<br />
Group<br />
The Walt Disney<br />
Company<br />
Wellington<br />
<strong>Management</strong><br />
Company<br />
Wilson TurboPower<br />
The World Bank<br />
WPP Group<br />
Yahoo!<br />
Zipcar<br />
Zip Technologies<br />
ZS Associates<br />
NOTE: Employers<br />
hiring three or<br />
more <strong>MIT</strong> <strong>Sloan</strong><br />
students for fulltime<br />
or summer<br />
positions are<br />
noted in red.
2007 2008<br />
From the Director<br />
Thank you for your support <strong>of</strong> <strong>MIT</strong> <strong>Sloan</strong>.<br />
Our employment report statistics reflect the strong demand for our students, and we are<br />
grateful to our recruiting partners, alumni, and friends <strong>of</strong> the <strong>School</strong> for their ongoing<br />
commitment to the <strong>MIT</strong> <strong>Sloan</strong> <strong>School</strong> <strong>of</strong> <strong>Management</strong>. This past year has proven to be<br />
an outstanding recruiting year for <strong>MIT</strong> <strong>Sloan</strong> <strong>MBA</strong> students, with over 97% <strong>of</strong> the Class <strong>of</strong><br />
2007 having a job <strong>of</strong>fer by September 8, three months after graduation.<br />
The largest hiring sector for both full-time and summer employment continues to be service<br />
industries, with consulting and financial services attracting the most students. One-fifth <strong>of</strong><br />
students accepted opportunities in the manufacturing sector, showing the diversity <strong>of</strong><br />
interest among our students. We also continue to see a growing interest in sustainability,<br />
with more students choosing to accept full-time opportunities in areas such as energy and<br />
nonpr<strong>of</strong>it work than in prior years.<br />
Consulting/strategic planning and finance maintain dominance in the list <strong>of</strong> job functions<br />
that <strong>MIT</strong> <strong>Sloan</strong> students accepted. Student interest in a diversity <strong>of</strong> areas such as<br />
marketing/sales, product development/management, and general management/leadership<br />
also remains strong. Finally, we continue to see a growing interest in business development<br />
positions for summer internships.<br />
The Career Development Office remains committed to connecting students with com panies,<br />
with over 75 percent <strong>of</strong> students finding full-time job opportunities through the <strong>School</strong>. We<br />
strive to provide a variety <strong>of</strong> methods for our recruiting partners to reach our students, from<br />
scheduled interviews on and <strong>of</strong>f campus to resume books to job postings and club events.<br />
We provide personalized services to meet the needs <strong>of</strong> the wide variety <strong>of</strong> firms that recruit<br />
<strong>MIT</strong> <strong>Sloan</strong> <strong>MBA</strong>s, whether you are looking to hire one summer intern or ten full-time<br />
employees. Our goal is to be the school <strong>of</strong> choice for <strong>MBA</strong> hirers, and we are committed to<br />
making your recruiting experience both positive and productive.<br />
Sincerely,<br />
Jacqueline Wilbur<br />
Director<br />
<strong>MBA</strong> Career Development Office<br />
Accuracy in <strong>Report</strong>ing <strong>Employment</strong> Statistics<br />
The <strong>MIT</strong> <strong>Sloan</strong> <strong>School</strong> <strong>of</strong> <strong>Management</strong> adheres to the <strong>MBA</strong> Career Services Council (<strong>MBA</strong> CSC) Standards for <strong>Report</strong>ing <strong>MBA</strong> <strong>Employment</strong> Statistics (mbacsc.org).<br />
Conformance to this business school industry standard ensures accurate and comparable employment data.<br />
Currently, the majority <strong>of</strong> the leading <strong>MBA</strong> programs adhere to these accepted reporting standards. <strong>MIT</strong> <strong>Sloan</strong> takes a leadership role to promote the importance <strong>of</strong><br />
accurate and comparable employment and salary statistics to prospective students and employers.
2<br />
<strong>MIT</strong> <strong>Sloan</strong> <strong>MBA</strong> Class <strong>of</strong> 2007 1<br />
Number <strong>of</strong> Candidates 375<br />
U.S. Citizens 60%<br />
Non-U.S. Citizens 40%<br />
Women 30%<br />
Class <strong>of</strong> 2007 <strong>Employment</strong> Pr<strong>of</strong>ile 2<br />
Number %<br />
Seeking <strong>Employment</strong> 313 83.2<br />
Not Seeking <strong>Employment</strong> 48 12.8<br />
Continuing education 4 1.1<br />
Company sponsored or have<br />
been employed as student 29 7.7<br />
Starting own business 9 2.4<br />
Job search postponed 4 1.1<br />
Other reason(s) for not seeking 2 .5<br />
No Information Available 15 4.0<br />
Total Graduates 376 100.0<br />
Full-Time <strong>Employment</strong> Overview 3<br />
Mean Base Salary $107,990<br />
Median Base Salary $110,000<br />
Range <strong>of</strong> Base Salary $65,000 – 161,800<br />
Median GMAT Score 710<br />
Median Undergraduate GPA (out <strong>of</strong> 4.0) 3.5<br />
Average Age at Entry to <strong>MIT</strong> <strong>Sloan</strong> 28<br />
Average Years <strong>of</strong> Full-Time<br />
Work Experience Prior to <strong>MIT</strong> <strong>Sloan</strong> 5<br />
Top Hirers <strong>of</strong> Class <strong>of</strong> 2007<br />
McKinsey & Company 27 graduates<br />
Bain & Company 17<br />
BCG 16<br />
Booz Allen Hamilton 12<br />
Lehman Brothers 9<br />
Google 8<br />
Citi 7<br />
Goldman Sachs 6<br />
IBM 6<br />
Dell 5<br />
Fidelity 5<br />
1. Class pr<strong>of</strong>ile (as <strong>of</strong> matriculation) and employment statistics (as <strong>of</strong> graduation) include information for <strong>MBA</strong>s and students in the joint<br />
<strong>MBA</strong>/Leaders for Manufacturing program.<br />
2. All information based on data reported by students.<br />
3. Full-time employment statistics based on job acceptances. 98.7% <strong>of</strong> reported acceptances included usable salary information.
Class <strong>of</strong> 2007 Base Salary by Industry<br />
Percent Mean Median range<br />
Service industries 78.8 $110,194 $115,000 $65,000–161,800<br />
Consulting 37.2 115,611 120,000 72,000–140,000<br />
Investment Banking 15.4 100,287 95,000 80,000–161,800<br />
Investment <strong>Management</strong> 6.7 111,550 110,000 92,000–150,000<br />
S<strong>of</strong>tware 4.7 109,429 110,000 75,000–136,000<br />
Media/Entertainment 4.7 110,357 115,000 65,000–155,000<br />
Retail 3.4 100,000 100,000 90,000–110,000<br />
VC/PE/Hedge Fund 2.3 114,286 111,000 94,000–150,000<br />
Diversified Financial Services 1.7 97,800 95,000 75,000–115,000<br />
Real Estate 1.0 100,833 100,000 92,500–110,000<br />
Service/Other 1.7 106,000 100,000 90,000–140,000<br />
Manufacturing industries 19.5 $100,734 $98,000 $68,000–160,000<br />
Computers/Electronics 7.7 102,233 100,000 85,000– 130,000<br />
Pharmaceutical/<br />
Healthcare/Biotechnology<br />
3.4 92,444 95,000 80,000– 105,000<br />
Oil/Energy 1.7 106,200 106,000 85,000– 120,000<br />
Automotive/Aerospace 1.7 102,200 103,000 90,000– 110,000<br />
Consumer Packaged Goods 1.0 88,500 89,000 86,500– 90,000<br />
Transportation/Equipment/<br />
Defense<br />
0.7 — 1<br />
— —<br />
Telecommunications 0.7 — — —<br />
Manufacturing/Other 2.6 98,250 95,000 68,000– 120,000<br />
government/nonPr<strong>of</strong>it 1.7 88,000 80,000 65,000– 120,000<br />
1. Dash indicates fewer than three people or less than 1% reported salary information.<br />
Class <strong>of</strong> 2007 Base Salary by Job Function<br />
Percent Mean Median range<br />
Consulting/Strategic Planning 40.6 $114,891 $120,000 $72,000 –140,000<br />
Finance (total) 26.1 103,016 95,000 75,000 –161,800<br />
Finance/Investment<br />
Banking<br />
Finance/Investment<br />
<strong>Management</strong><br />
10.4 99,693 95,000 80,000 –161,800<br />
7.7 109,548 110,000 75,000 –150,000<br />
Finance/Sales & Trading 4.0 97,917 95,000 95,000 –115,000<br />
Finance/Research 0.3 — 1<br />
— —<br />
Finance/Other 2 3.7 99,348 100,000 85,830 –111,000<br />
Marketing/Sales 8.1 93,854 95,000 65,000 –120,000<br />
Product <strong>Management</strong>/<br />
Development<br />
General <strong>Management</strong>/<br />
7.4 108,705 105,000 80,000 –136,000<br />
Leadership Development<br />
Program<br />
6.7 105,056 107,000 65,000 –155,000<br />
Operations/<br />
Project <strong>Management</strong><br />
5.7 102,529 105,000 68,000 –160,000<br />
Business Development 2.7 107,875 115,000 80,000 –120,000<br />
Information Technology 0.7 — — —<br />
Other 2.0 107,000 101,500 94,000 –125,000<br />
1. Dash indicates fewer than three people or less than 1% reported salary information.<br />
2. Finance/Other includes corporate finance and private equity.<br />
Top Industries<br />
Consulting<br />
Investment Banking<br />
High Technology*<br />
� ����<br />
� ����<br />
� ����<br />
����<br />
� ����<br />
� ����<br />
� ����<br />
����<br />
� ����<br />
� ����<br />
� ����<br />
����<br />
* Includes Computers/Electronics,<br />
S<strong>of</strong>tware and Telecommunications<br />
Top Functions<br />
Consulting<br />
Finance<br />
Marketing/Sales*<br />
� ����<br />
� ����<br />
����<br />
����<br />
� ����<br />
� �����<br />
���<br />
����<br />
* Not a top function in 2006<br />
� ����<br />
� ����<br />
����<br />
����<br />
3
4<br />
Class <strong>of</strong> 2007 Base Salary by Geographic Location<br />
Percent Mean Median range<br />
north america 86.2 $107,342 $110,000 $65,000–150,000<br />
United States 84.9 107,311 110,000 65,000–150,000<br />
Northeast 1 50.7 107,682 110,000 65,000–150,000<br />
Metro Boston 25.5 110,087 115,000 65,000–130,000<br />
Metro NYC 23.2 105,699 102,750 65,000–150,000<br />
West 18.8 106,810 105,000 75,000–136,000<br />
Southwest 5.4 107,563 111,000 80,000–122,000<br />
Midwest 4.0 105,917 109,000 80,000–120,000<br />
Mid-Atlantic 3.4 107,850 110,000 86,500–122,000<br />
South 2.6 104,875 107,500 90,000–116,000<br />
Mexico 1.0 105,667 102,000 95,000–120,000<br />
Canada 0.3 — 2<br />
— —<br />
rest <strong>of</strong> the World 13.8 $112,005 $110,000 $75,000–161,800<br />
Asia 6.7 104,400 100,000 75,000– 160,000<br />
Europe 5.4 119,981 114,500 98,000– 161,800<br />
United Kingdom 3.4 119,590 117,500 105,000– 140,000<br />
Latin America<br />
and the Caribbean<br />
1.7 116,899 101,496 93,000–155,000<br />
1. Northeast includes states/cities beyond Metro Boston and Metro NYC.<br />
2. Dash indicates fewer than three people or less than 1% reported salary information.<br />
Class <strong>of</strong> 2007 Base Salary by Undergraduate Major<br />
Major Percent Mean Median range<br />
Engineering 45.5 $109,460 $110,000 $75,000–161,800<br />
Social Sciences & Humanities 20.2 104,242 110,000 65,000–150,000<br />
Business 18.5 107,867 110,000 68,000–155,000<br />
Sciences & Mathematics 15.8 108,685 107,500 75,000–154,000<br />
Class <strong>of</strong> 2007 Base Salary by Pr<strong>of</strong>essional Experience<br />
yearS exPerience Percent Mean Median range<br />
One year or less 2.7 $99,979 $102,500 $65,000–120,000<br />
More than one year, up to 3 years 15.4 103,023 103,000 65,000–140,000<br />
More than 3 years, up to 5 years 42.1 110,410 115,000 75,000–161,800<br />
More than 5 years 39.8 107,885 110,000 72,000–155,000
Signing Bonus Received by Job Function 1<br />
Percent rePorting Mean Median range<br />
Finance/Sales & Trading 100.0 $41,667 $40,000 $20,000–50,000<br />
Finance/Investment Banking 93.5 41,807 40,000 37,400–50,000<br />
Consulting/Strategic Planning 90.9 19,976 20,000 9,000–50,000<br />
Finance/Other 2 90.9 19,131 14,903 5,000–47,000<br />
Operations/Project <strong>Management</strong> 88.2 17,122 15,833 5,000–30,000<br />
Product <strong>Management</strong>/Development 86.4 15,368 12,000 4,000–40,000<br />
Business Development 75.0 20,833 22,500 5,000–30,000<br />
General <strong>Management</strong>/<br />
Leadership Development Program<br />
75.0 16,667 15,000 5,000–30,000<br />
Marketing/Sales 75.0 15,361 15,000 2,000–32,500<br />
Finance/Investment <strong>Management</strong> 73.9 25,959 20,000 10,000–60,000<br />
1. 85.6% <strong>of</strong> the students reporting usable salary data reported receiving a signing bonus. Percentage represents the<br />
number <strong>of</strong> students who received a signing bonus in the job function.<br />
2. Finance/Other includes corporate finance and private equity.<br />
Other Guaranteed Compensation<br />
Percent rePorting Mean Median range<br />
13 $30,813 $25,000 $2,000– 150,000<br />
Class <strong>of</strong> 2007 Timing <strong>of</strong> Job Offers (percent <strong>of</strong> students)<br />
At Graduation 92.7%<br />
Three Months after Graduation 97.2%<br />
Class <strong>of</strong> 2007 Timing <strong>of</strong> Job Acceptances 1 (percent <strong>of</strong> students)<br />
At Graduation 86.9%<br />
Three Months after Graduation 94.6%<br />
1. One graduate, representing 0.27% <strong>of</strong> graduates, reneged on an accepted <strong>of</strong>fer.<br />
Class <strong>of</strong> 2007 Reason for Accepting Position<br />
Class <strong>of</strong> 2007 Source <strong>of</strong> Job<br />
Growth Potential 26.5%<br />
Job Content 20.2%<br />
Job Function 18.8%<br />
Industry 12.4%<br />
People/Corporate Culture 8.7%<br />
Location 6.7%<br />
Prestige <strong>of</strong> Firm 3.7%<br />
Compensation 2.7%<br />
Other 0.3%<br />
SCHOOL-FACILITATED ACTIvITIES 76.3%<br />
Scheduled Interviews On or Off Campus 34.5%<br />
Summer Internship 31.4%<br />
<strong>MIT</strong>/<strong>MIT</strong> <strong>Sloan</strong> Job Posting 5.6%<br />
Faculty/CDO/Student Referral 3.1%<br />
Resume Book, Resume Referral 1.4%<br />
Club Event 0.3%<br />
STUDENT-FACILITATED ACTIvITIES 20.2%<br />
Contacted Directly 9.4%<br />
Personal Network 6.6%<br />
Previous employer 3.1%<br />
Newspaper, Magazine, Job Board 1.1%<br />
OTHER 3.5%<br />
Other 3.5%<br />
5
6<br />
<strong>MIT</strong> <strong>Sloan</strong> <strong>MBA</strong> Class <strong>of</strong> 2008 1<br />
Number <strong>of</strong> Candidates 377<br />
U.S. Citizens 70%<br />
Non-U.S. Citizens 30%<br />
Women 31%<br />
Class <strong>of</strong> 2008 <strong>Employment</strong> Pr<strong>of</strong>ile 2<br />
Number %<br />
Seeking <strong>Employment</strong> 306 81.2<br />
Not Seeking <strong>Employment</strong> 64 16.9<br />
Leaders for Manufacturing<br />
Students 45 11.9<br />
Company sponsored or have<br />
been employed as student 11 2.9<br />
Starting own business 7 1.8<br />
Other reason(s) for not seeking 1 0.3<br />
No Information Available 7 1.9<br />
Total Graduates 377 100.0<br />
Summer <strong>Employment</strong> Overview 3<br />
Mean Monthly Base Salary $7,136<br />
Median Monthly Base Salary $7,200<br />
Range <strong>of</strong> Monthly Base Salary 4 $700 – $14,167<br />
Top Intern Hirers <strong>of</strong> Class <strong>of</strong> 2008<br />
McKinsey & Company 23 interns<br />
BCG 11<br />
Goldman Sachs 10<br />
Google 9<br />
Micros<strong>of</strong>t 8<br />
Bain & Company 7<br />
Booz Allen Hamilton 7<br />
Morgan Stanley 7<br />
Barclay’s Capital 5<br />
Deutsche Bank Group 5<br />
Merrill Lynch 5<br />
1. Class pr<strong>of</strong>ile includes information for <strong>MBA</strong> students and students in the joint <strong>MBA</strong>/Leaders for Manufacturing program.<br />
2. All information based on data reported by students.<br />
Median GMAT Score 710<br />
3. Summer employment statistics based on job acceptances. 88.7% <strong>of</strong> reported acceptances included usable salary information.<br />
4. 2.0% <strong>of</strong> students reported accepting unpaid internships; reflected in mean and median calculations.<br />
Median Undergraduate GPA (out <strong>of</strong> 4.0) 3.5<br />
Average Age at Entry to <strong>MIT</strong> <strong>Sloan</strong> 28<br />
Average Years <strong>of</strong> Full-Time<br />
Work Experience Prior to <strong>MIT</strong> <strong>Sloan</strong> 5
Class <strong>of</strong> 2008 Monthly Salary by Industry<br />
Percent Mean Median range<br />
Service industries 76.3 8,541 $ 7,918 $700–14,167<br />
Consulting 25.1 9,137 10,000 700–14,167<br />
Investment Banking 16.3 8,072 7,919 2,000–11,600<br />
Media/Entertainment 7.1 6,374 7,000 2,500–10,400<br />
VC/PE/Hedge Fund 6.1 6,905 6,934 2,000–12,000<br />
Investment <strong>Management</strong> 5.8 6,777 7,200 1,000–10,000<br />
S<strong>of</strong>tware 5.8 6,093 6,400 3,200– 7,200<br />
Diversified Financial Services 3.7 7,669 8,000 6,154– 9,167<br />
Real Estate 1.0 4,333 3,500 2,400– 7,100<br />
Retail 1.0 — 1 — —<br />
Service/Other 4.4 5,647 6,000 1,720–10,000<br />
Manufacturing industries 22.0 5,769 6,000 $1,500–11,000<br />
Pharmaceutical/<br />
Healthcare/Biotechnology<br />
7.5 6,128 5,960 3,500– 11,000<br />
Computers/Electronics 5.0 5,138 6,000 1,500– 7,084<br />
Oil/Energy 2.7 6,443 6,000 5,000– 8,000<br />
Consumer Packaged Goods 1.4 4,650 5,700 2,500– 5,750<br />
Automotive/Aerospace 0.7 — — —<br />
Telecommunications 0.7 — — —<br />
Transportation/Equipment/<br />
Defense<br />
0.3 — — —<br />
Manufacturing: Other 3.7 4,942 6,000 2,000– 7,500<br />
government/nonPr<strong>of</strong>it 1.7 2,360 3,000 1,400– 3,000<br />
1. Dash indicates fewer than three people or less than 1% reported salary information.<br />
Class <strong>of</strong> 2008 Monthly Salary by Job Function<br />
Percent Mean Median range<br />
Finance (total) 34.1 7,328 7,917 1,000–12,000<br />
Finance/Investment Banking 9.4 8,029 8,000 2,000–11,600<br />
Finance/<br />
Investment <strong>Management</strong><br />
8.0 6,786 7,100 1,000–10,000<br />
Finance/Sales & Trading 6.7 8,085 8,000 3,000–10,000<br />
Finance/Research 1.3 8,600 9,000 6,800–10,000<br />
Finance/Other 1 8.7 6,357 6,500 2,300–12,000<br />
Consulting/Strategic Planning 29.8 8,365 10,000 700–14,167<br />
Marketing/Sales 11.4 5,800 6,000 1,500–10,000<br />
Business Development 11.0 5,429 6,000 1,400–11,000<br />
Product <strong>Management</strong>/<br />
Development<br />
5.4 6,537 6,600 2,000–10,400<br />
Operations/<br />
Project <strong>Management</strong><br />
2.3 5,666 5,600 1,720– 7,500<br />
Information Technology 1.3 6,833 6,833 6,666– 7,000<br />
General <strong>Management</strong>/<br />
Leadership Development<br />
Program<br />
1.0 — 2<br />
— —<br />
Other 2.0 3.7 5,763 7,000– 8,000<br />
1. Finance/Other includes corporate finance and private equity.<br />
2. Dash indicates fewer than three people or less than 1% reported salary information.<br />
Top Industries<br />
Consulting<br />
Investment Banking<br />
High Technology*<br />
� ����<br />
� ����<br />
� ����<br />
����<br />
� ����<br />
� �����<br />
� ����<br />
����<br />
� ����<br />
� ����<br />
� �����<br />
����<br />
* Includes Computers/Electronics,<br />
S<strong>of</strong>tware and Telecommunications<br />
Top Functions<br />
Finance<br />
Consulting/Strategic Planning<br />
Marketing/Sales<br />
� ����<br />
� ����������<br />
� ��������������������������������������<br />
����<br />
� ����<br />
� ����<br />
� ����������<br />
����<br />
� ����<br />
� ����<br />
� ����<br />
����<br />
7
8<br />
Class <strong>of</strong> 2008 Monthly Salary by Geographic Location<br />
Percent Mean Median range<br />
north america 79.0 $7,090 $7,000 $1,000 –14,167<br />
United States 78.0 7,142 7,000 1,000 –14,167<br />
Northeast 1 50.2 7,459 7,917 1,000 –12,000<br />
Metro Boston 26.4 7,153 7,100 1,000 –11,000<br />
Metro NYC 20.7 8,062 7,917 2,400 –12,000<br />
West 16.6 6,772 6,693 2,500 –10,000<br />
Southwest 3.4 5,907 5,000 2,400 –14,167<br />
Midwest 3.4 7,229 7,200 1,500 –10,000<br />
Mid-Atlantic 2.4 5,033 5,000 2,000 – 9,200<br />
South 2.0 7,136 6,950 5,000 –10,000<br />
Mexico 0.7 — 2<br />
— —<br />
Canada 0.3 — — —<br />
rest <strong>of</strong> the World 21.0 $7,202 $8,000 $700 –12,000<br />
Asia 10.8 5,936 7,917 700 – 10,000<br />
Europe 8.8 8,530 9,633 4,000 – 12,000<br />
United Kingdom 5.4 9,525 9,783 6,997 – 12,000<br />
Latin America<br />
and the Caribbean<br />
1.1 4,450 4,450 1,400 – 7,500<br />
Oceania 0.3 — — —<br />
1. Northeast includes states/cities beyond Metro Boston and Metro NYC.<br />
2. Dash indicates fewer than three people or less than 1% reported salary information.<br />
Class <strong>of</strong> 2008 Monthly Salary by Undergraduate Major<br />
Major Percent Mean Median range<br />
Social Sciences & Humanities 33.0 $6,544 $6,733 $700 – 14,167<br />
Engineering 31.0 7,456 7,917 1,400 – 11,600<br />
Sciences & Mathematics 18.3 7,698 7,254 5,000 – 12,000<br />
Business 17.7 7,027 7,150 2,000 – 11,000<br />
Class <strong>of</strong> 2008 Monthly Salary by Pr<strong>of</strong>essional Experience<br />
yearS exPerience Percent Mean Median range<br />
One year or less 4.3 $6,942 $7,500 $2,000– 11,500<br />
More than one year, up to 3 years 19.4 8,081 8,000 1,400– 11,600<br />
More than 3 years, up to 5 years 40.8 6,962 7,000 1,500– 12,000<br />
More than 5 years 35.5 6,788 6,500 700– 14,167
Class <strong>of</strong> 2008 Reason for Accepting Position<br />
Class <strong>of</strong> 2008 Source <strong>of</strong> Job<br />
Job Content 23.0%<br />
Job Function 19.9%<br />
Industry 17.1%<br />
Growth Potential 11.8%<br />
People/Corporate Culture 10.5%<br />
Prestige <strong>of</strong> Firm 10.1%<br />
Location 5.9%<br />
Compensation 0.7%<br />
Other 1.0%<br />
SCHOOL-FACILITATED ACTIvITIES 76.7%<br />
Scheduled Interviews On or Off Campus 42.7%<br />
<strong>MIT</strong>/<strong>MIT</strong> <strong>Sloan</strong> Job Posting 14.3%<br />
<strong>MIT</strong>/<strong>MIT</strong> <strong>Sloan</strong> Sponsored Event 7.6%<br />
Faculty/CDO/Student Referral 6.9%<br />
Club Event 3.1%<br />
Resume Book, Resume Referral 2.1%<br />
STUDENT-FACILITATED ACTIvITIES 20.8%<br />
Contacted Directly 11.8%<br />
Personal Network 7.6%<br />
Previous employer 0.7%<br />
Newspaper, Magazine, Job Board 0.7%<br />
OTHER 2.5%<br />
Other 2.5%<br />
The Massachusetts Institute <strong>of</strong> Technology is committed to the principle <strong>of</strong> equal opportunity in education<br />
and employment. The Institute does not discriminate against individuals on the basis <strong>of</strong> race, color, sex, sexual<br />
orientation, religion, disability, age, veteran status, ancestry, or national or ethnic origin in the administration<br />
<strong>of</strong> its educational policies, admissions policies, employment policies, scholarship and loan programs, and<br />
other Institute administered programs and activities, but may favor U.S. citizens or residents in admissions<br />
and financial aid.*<br />
The vice President for Human Resources is designated as the Institute’s Equal Opportunity Officer and Title<br />
IX Coordinator. Inquiries concerning the Institute’s policies, compliance with applicable laws, statutes, and<br />
regulations (such as Title vI, Title IX, and Section 504), and complaints may be directed to Alison Alden, vice<br />
President for Human Resources, Room E19–215, 617–253–6512 or to Philip Lima, Staff Diversity Initiatives<br />
Coordinator, Room E19-215, 617–253–1594. Inquiries about the laws and about compliance may also be<br />
directed to the Assistant Secretary for Civil Rights, U.S. Department <strong>of</strong> Education.<br />
*The ROTC programs located on the <strong>MIT</strong> campus are operated under Department <strong>of</strong> Defense policies and<br />
regulations, and do not comply fully with <strong>MIT</strong>’s policy <strong>of</strong> nondiscrimination with regard to sexual orientation.<br />
On the recommendation <strong>of</strong> the Faculty, <strong>MIT</strong> is working to develop a modified on–campus ROTC program open<br />
to all <strong>MIT</strong> students.<br />
9
<strong>MBA</strong> Career Development Office Job Postings Contacts<br />
Office Contacts<br />
Marilyn Cronin<br />
Administration<br />
Administration<br />
Jackie Wilbur<br />
Jackie Wilbur<br />
Director<br />
Director<br />
jwilbur@mit.edu<br />
jwilbur@mit.edu<br />
1-617-258-6492<br />
1-617-258-6492<br />
Gwen Churchill<br />
Gwen Churchill<br />
Administrative Assistant<br />
Administrative Assistant<br />
gwenc@mit.edu<br />
gwenc@mit.edu<br />
1-617-253-6149<br />
1-617-253-6149<br />
Associate Director<br />
Employer mcronin@mit.edu Relations<br />
Career Education<br />
Bryn 1-617-258-6125<br />
Panee Burkhart<br />
Workshops<br />
Associate Director<br />
Sue Kline<br />
brynb@mit.edu<br />
Career Education WorkshopsSenior<br />
Associate Director<br />
1-617-253-8399<br />
skline@mit.edu<br />
Sue Kline<br />
JanSenior Araullo-Dong<br />
1-617-253-3946<br />
Associate Director<br />
Assistant skline@mit.edu Director<br />
janina_a@mit.edu<br />
1-617-253-3946<br />
<strong>MBA</strong> Program<br />
1-617-253-8944<br />
Debbie Berechman<br />
Employer Relations<br />
Bryn Panee Burkhart<br />
Associate Director<br />
brynb@mit.edu<br />
1-617-253-8399<br />
Jan Araullo-Dong<br />
Assistant Director<br />
janina_a@mit.edu<br />
1-617-253-8944<br />
Katie Lynch<br />
Assistant Director<br />
klynch1@mit.edu<br />
1-617-258-6493<br />
Alissa Kharkar<br />
Recruiting Assistant<br />
(academic year only)<br />
akharkar@mit.edu<br />
1-617-324-1017<br />
Katie <strong>MBA</strong> Lynch Program<br />
Assistant Director<br />
klynch1@mit.edu<br />
Debbie Berechman<br />
1-617-258-6493<br />
Executive Director<br />
dberech@mit.edu<br />
Alissa 1-617-253-5160<br />
Kharkar<br />
Recruiting Assistant<br />
(academic year only)<br />
akharkar@mit.edu<br />
Corporate Relations<br />
1-617-324-1017<br />
Dave Weber<br />
Director<br />
Job dweber@mit.edu<br />
Postings<br />
1-617-253-7161<br />
Marilyn Cronin<br />
Associate Director<br />
mcronin@mit.edu<br />
Leaders for Manufacturing<br />
1-617-258-6125<br />
Program<br />
Don Rosenfield<br />
Director<br />
donrose@mit.edu<br />
1-617-253-1064<br />
Executive Director<br />
dberech@mit.edu<br />
1-617-253-5160<br />
Corporate Relations<br />
Dave Weber<br />
Director<br />
dweber@mit.edu<br />
1-617-253-7161<br />
Leaders for<br />
Manufacturing Program<br />
Don Rosenfield<br />
Director<br />
donrose@mit.edu<br />
1-617-253-1064<br />
<strong>MIT</strong> <strong>Sloan</strong> <strong>School</strong> <strong>of</strong> <strong>Management</strong><br />
Career Development Office<br />
70 Memorial Drive, E51-203<br />
Cambridge, MA 02142-1347<br />
Phone: 1-617-253-6149<br />
Fax: 1-617-253-0226<br />
http://mitsloan.mit.edu/cdo<br />
This piece is printed on 100% post–consumer–waste paper manufactured with windpower and is Green Seal and FSC certified.<br />
The print facility has a 100% recycling policy, uses vegetable based inks, and is recognized by the Massachusetts Water Resource<br />
Authority as a zero–discharge site.<br />
John Kramer Design | Photography by Stuart Darsch | PSB 07 10 0879<br />
A special thank you to Lisa Monaghan for her exceptional work on this project.