Barros and Lang (2003) - University of California, Santa Barbara
Barros and Lang (2003) - University of California, Santa Barbara
Barros and Lang (2003) - University of California, Santa Barbara
- No tags were found...

Create successful ePaper yourself
Turn your PDF publications into a flip-book with our unique Google optimized e-Paper software.
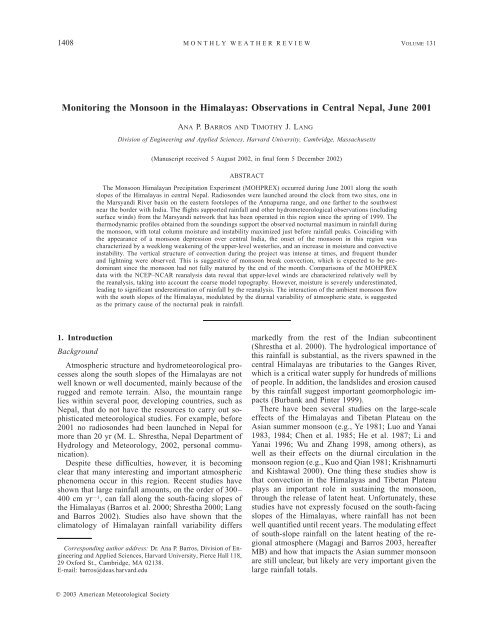
JULY <strong>2003</strong> BARROS AND LANG1411FIG. 2. (a) Time series <strong>of</strong> daily rainfall during Jun 2001, for selected network stations. (b) Jun 2001 me<strong>and</strong>iurnal cycle <strong>of</strong> rainfall for high- <strong>and</strong> low-altitude gauge stations.pography forms part <strong>of</strong> the footslopes <strong>of</strong> the AnnapurnaRange, to the northwest. The main advantages <strong>of</strong> Besisaharwere its proximity to the core <strong>of</strong> the meteorologicalnetwork (e.g., a gauge station in the town <strong>of</strong>Khudi lies just a few kilometers up the Annapurna trekkingtrail), <strong>and</strong> that it had access to good infrastructure(e.g., paved roads, commercial power, <strong>and</strong> reasonableaccommodations for project workers). Tansen lies 90km to the southwest (SW) <strong>of</strong> Besisahar, providing anintermediate location between the mountains <strong>and</strong> theplains <strong>of</strong> northern India. The launching site was locatednear the top <strong>of</strong> a small, relatively isolated mountain at1453 m MSL.The basic frequency <strong>of</strong> flights, observed at both sites,was five per day: 0000, 0600, 1200, 1800, <strong>and</strong> 2100UTC. See Table 2 for launch frequency at both sites.Launches were done on UTC time to better match operationalradiosonde observations <strong>and</strong> model analyses.Nepal is 0545 ahead <strong>of</strong> UTC time, so this correspondsto 6-hourly flights with one additional nocturnal flight(2100 UTC, or 0245 LNT) to provide more resolutionaround the time <strong>of</strong> the postmidnight peak in rainfall. Inthis case, the 1800 UTC launch precedes this peak, <strong>and</strong>the 2100 UTC follows it. Launch times periodicallywere adjusted to match overflights by the TRMM satellite,<strong>and</strong> at times more than five launches per day (atBesisahar) were made as interesting weather conditionsdeveloped. When monsoon onset occurred (later shownto be after 10 June) launch frequency was increased to3 hourly (0000, 0300, 0600 UTC, etc.) at Besisahar tobetter resolve the incoming monsoon flow. This alsoprovided more detailed resolution <strong>of</strong> the atmosphericdiurnal cycle.Nepal provided many challenges in order to completea successful field project. Apart from the typical problemsassociated with developing countries, such as extralogistical strains, poor accommodations, <strong>and</strong> illness,there were difficult political barriers. The governmentm<strong>and</strong>atedmourning period following the tragic demise<strong>of</strong> the king <strong>and</strong> queen <strong>of</strong> Nepal just as MOHPREX wasslated to start delayed the project. For the first few days,all launches had to be done late at night, resulting in alow frequency <strong>of</strong> at most two flights per day (Table 2).Information on sounding data quality control can befound in appendix A.3. Monsoon onsetDaily rainfall at five network stations is shown in Fig.2a. Monthly <strong>and</strong> seasonal totals can be found in Table1. Unlike the previous 2 yr, there was no major rainevent associated with the monsoon onset, where 100mm day 1 <strong>of</strong> rainfall fell at a majority <strong>of</strong> the stationsover 2 days (<strong>Lang</strong> <strong>and</strong> <strong>Barros</strong> 2002). Indeed, after some
1412 MONTHLY WEATHER REVIEWVOLUME 131FIG. 3. Time series <strong>of</strong> Besisahar <strong>and</strong> Tansen winds at four different atmospheric layers.significant early rainfall, the weather was relatively dryuntil 13 June. The most intense storms after this date(15, 19, <strong>and</strong> 24 June) produced rainfall accumulationsup to 100 mm in 1 day, but this was a local phenomenonrestricted to one to two gauges at most. However, rainfallwas persistent after 12 June, with most gauges receivingat least some rainfall each day.Average daily rainfall during June 2001 was 17.0 mmat high altitudes <strong>and</strong> 19.3 mm at low altitudes. Ten <strong>of</strong>the 17 functioning network gauges during this monthreceived over 500 mm <strong>of</strong> rain in June (Table 1). Thewesternmost ridge station (Pasqam Ridge) received 974mm, the most <strong>of</strong> any gauge. Khudi (closest to Besisahar)received 696 mm, but the Tansen rain gauge receivedonly 301 mm. The observed rain totals during June 2001were overall lower when compared with previous years(1999 <strong>and</strong> 2000). For example, Khudi received 771 mmin June 1999 <strong>and</strong> 981 mm in 2000, while Tansen had456 mm in June 1999 <strong>and</strong> 608 mm in 2000. The primaryreason for this was the lack <strong>of</strong> a major onset rainfallevent in 2001 (<strong>Lang</strong> <strong>and</strong> <strong>Barros</strong> 2002).Figure 3 shows the temporal evolution <strong>of</strong> horizontalwinds at Besisahar <strong>and</strong> Tansen from four atmosphericlayers, centered on 900, 700, 500, <strong>and</strong> 200 hPa. Nomenclature<strong>and</strong> sign convention are st<strong>and</strong>ard, with positiveU being westerly flow <strong>and</strong> positive V being southerlyflow. The data show that the wind pr<strong>of</strong>ile underwentconsiderable layer-dependent evolution during June asthe monsoon established itself. For instance, being dominatedby the diurnal cycle, near-surface winds (900hPa) at Besisahar exhibited no obvious change throughoutthe 3 weeks <strong>of</strong> the project, routinely switching betweensoutheast (SE) flow during the day to northwest(NW) flow at night. Tansen also showed considerablevariability but no long-term trends.At 700 hPa, winds were extremely light during earlyJune, but showed more fluctuations in intensity duringthe middle <strong>of</strong> the month. Eventually, ESE flow settledin Besisahar, though with strong variability in intensity[east (E) flow being strongest in the morning]. At Tansen,however, NW winds became increasingly weaker.Note that Tansen is more exposed at 700 hPa than Besisahar,which is situated very close to several 2000–3000-m ridges on the foothills <strong>of</strong> the Himalayan range(Fig. 1). These ridges serve as an obstacle to flow thatdoes not have a significant southerly component. Whenmesoscale depressions originating from the Bay <strong>of</strong> Bengalinteract with easterly vertical shear forced by themountains, an asymmetric secondary circulation developswith strong near-surface upslope (southerly) flow
JULY <strong>2003</strong> BARROS AND LANG1413FIG. 4. (a) Time series <strong>of</strong> Besisahar <strong>and</strong> Tansen precipitable water. (b) Same as in (a) but for CAPE.<strong>and</strong> return flow (northerly) at midlevel (see also Fig. 6in <strong>Lang</strong> <strong>and</strong> <strong>Barros</strong> 2002).The largest wind changes occurred al<strong>of</strong>t at 500 <strong>and</strong>200 hPa at Besisahar (nearly perfect agreement withTansen at 200 hPa). At 500 hPa, winds originally witha significant westerly component vanished after 10 June,becoming more easterly. A short-duration return to lightwesterly flow occurred after 15 June, but this soon wasreplaced by well-developed SE flow. The most dramaticreduction in westerly flow occurred at 200 hPa with adecrease in wind velocity from U 20ms 1 at thebeginning <strong>of</strong> the project to near zero after 11 June. Light<strong>and</strong> variable westerly flow eventually prevailed towardthe end <strong>of</strong> the month. The north–south component at200 hPa was variable throughout MOHPREX. The overallimpression given by Fig. 3 is that <strong>of</strong> a reduction inthe strength <strong>of</strong> the westerly component <strong>of</strong> flow, if notan outright switch to SE winds as the monsoon establisheditself.The time evolution <strong>of</strong> precipitable water (PW) at Besisahar<strong>and</strong> Tansen is shown in Fig. 4a. While the diurnalcycle was a major component <strong>of</strong> PW variability, a significantincrease in the mean value <strong>of</strong> PW between 10<strong>and</strong> 15 June, remaining more or less constant after that.A similar pattern was found in the values <strong>of</strong> convectiveavailable potential energy (CAPE; Fig. 4b), a measure<strong>of</strong> atmospheric instability (Moncrieff <strong>and</strong> Miller 1976).Finally, the atmosphere warmed during the project, withan increase in freezing-level altitude on the order <strong>of</strong> 500m prior to 15 June (not shown).Based on all these data, it is apparent that monsoononset occurred during the period 10–15 June, manifestingitself in all notable fields (Figs. 2–4). While theonset process was a multiday phenomenon, we set theapproximate date for onset as 13 June, since by this timeCAPE <strong>and</strong> precipitable water had reached their maxima,while upper-level westerlies had become nearly quiescent.In addition, 13 June was the date after which rainfallwas observed on a daily basis in the Marsy<strong>and</strong>iregion.This time period is consistent with the development<strong>and</strong> onshore movement <strong>of</strong> a depression that originatedfrom the Bay <strong>of</strong> Bengal (Fig. 5), which placed centralNepal under a regime <strong>of</strong> moist SE flow, consistent withmonsoon onset conditions originally discussed by <strong>Lang</strong><strong>and</strong> <strong>Barros</strong> (2002). Specifically, onset monsoon depressionstend to form over the easterly notch <strong>of</strong> the monsoontrough over the Bay <strong>of</strong> Bengal, <strong>and</strong> propagate westwardon the northern flank <strong>of</strong> the westerly jet over theIndian subcontinent: the more southward the jet, theweaker the interaction with the easterly vertical shearalong the Himalayas, keeping the depressions awayfrom the Himalayan range, <strong>and</strong> favoring disorganizedconvection over northern India. Accordingly, the 2001onset depression moved mostly west from the bay, <strong>and</strong>did not interact as strongly with the mountains as did
1414 MONTHLY WEATHER REVIEWVOLUME 131FIG. 5. NCAR–NCEP reanalysis 850-hPa winds at four different times during the 2001 monsoon onsetin central Nepal.the onset depressions from 1999 <strong>and</strong> 2000 (<strong>Lang</strong> <strong>and</strong><strong>Barros</strong> 2002). Therefore, although the atmosphericstructure exhibited definite change, rainfall totals duringthe 2001 onset period were not as dramatic as in theprevious 2 yr because convection associated with thedepression did not reach the mountains. That is, localprocesses facilitated by the synoptic SE monsoon flowwere more important for rainfall during the 2001 onset.4. Diurnal cycleWhile the month-long evolution <strong>of</strong> the atmospherewas significant during the MOHPREX project, the previousfigures also demonstrate the importance <strong>of</strong> thediurnal cycle. In fact, for many fields (e.g., CAPE) thediurnal cycle was the strongest component <strong>of</strong> variability.Thus, further analysis <strong>of</strong> this variability is warranted.The diurnal cycle <strong>of</strong> rainfall during June 2001 isshown in Fig. 2b. High- (2000 m MSL) <strong>and</strong> low-(2000 m MSL) altitude stations were combined <strong>and</strong>averaged together in 30-min bins to create this plot.Clearly demonstrated is the near-midnight peak in rainfallat both types <strong>of</strong> stations. Also, there is a lull inrainfall at both stations during the time period 0600–1200 local Nepal time (LNT). Average rain rates increaseduring the afternoon hours, although there is asignificant depression in rainfall near 1800 LNT at highaltitudes. The secondary afternoon peak is not as strongduring June 2001. This peak tends to be more apparentat the seasonal scale (<strong>Barros</strong> et al. 2000), where dominanttrends better overcome day-to-day variability.The methodology employed to calculate the diurnalcycle <strong>of</strong> sounding-derived variables is reviewed in appendixB. The diurnal cycle <strong>of</strong> precipitable water isconsistent with a late-morning/midday minimum inrainfall <strong>and</strong> a postmidnight maximum (Fig. 6a). Themaximum occurs during the period 2100–0000 LNT <strong>and</strong>the minimum during 0900–1200 LNT. Soundings thatoccurred when there was no rainfall (see appendix B)show some differences, with a slight dip <strong>of</strong> 2 mm at0000 LNT compared to the all-weather soundings, <strong>and</strong>a secondary peak <strong>of</strong> 54 mm at 0300 LNT (not shown).Figure 6b shows the diurnal cycle <strong>of</strong> CAPE, whichhas a similar pattern to precipitable water, reaching amaximum over the period 1800–0000 LNT. This is the6-h period immediately preceding the nocturnal rainfallpeak in the Marsy<strong>and</strong>i network. The minimum in CAPEoccurs during the period 0600–0900 LNT, when observedcloud cover <strong>and</strong> rainfall were near their minimum.Considering only soundings with no observedrainfall (not shown), there is no significant deviationfrom this general pattern. Overall, the observations areconsistent with a gradual buildup <strong>of</strong> convective instabilityduring the day, which is then released after midnightleading to a stable atmosphere at the start <strong>of</strong> anew daytime period. Total column moisture <strong>and</strong> instabilityreinforce one another, <strong>and</strong> from a thermodynamicperspective the nocturnal rainfall peak is no surprise.
JULY <strong>2003</strong> BARROS AND LANG1415FIG. 6. (a) Diurnal cycle <strong>of</strong> Besisahar precipitable water. (b) Same as in (a) but for CAPE.In order to underst<strong>and</strong> this thermodynamic behavior,the diurnal evolution <strong>of</strong> the vertical pr<strong>of</strong>iles <strong>of</strong> temperature<strong>and</strong> mixing ratio were explored (not shown). At0000 LNT, absolute moisture is well above averagethroughout the depth <strong>of</strong> the troposphere, while temperaturesare slightly cooler than the daily mean, particularlyat high altitudes. This is an excellent combinationto produce high instability <strong>and</strong> precipitable water. Bycontrast, at 1200 LNT, moisture is well below averagein the troposphere <strong>and</strong> temperatures are average to aboveaverage. Intermediate times show some variability, butoverall reflect the trends between high (0000 LNT) <strong>and</strong>low atmospheric instability (1200 LNT). What the datasuggest is normal diurnal heating <strong>and</strong> cooling <strong>of</strong> theatmosphere, which is perhaps lagged a bit by the highmoisture levels. Also, there is a daily replenishment <strong>of</strong>moisture occurring at all levels after the nocturnal depletion.The timing <strong>of</strong> these two processes leads to theobserved diurnal evolution <strong>of</strong> CAPE <strong>and</strong> precipitablewater.Note from Fig. 6a that the net daily depletion <strong>of</strong> atmosphericmoisture is 6 mm on average. This moisturesupply must be restored daily through local evapotranspiration<strong>and</strong> through advection by the monsoonflow. Figure 7 shows time series <strong>of</strong> relative humidity,evapotranspiration, <strong>and</strong> rainfall at Telbrung (station 19,Fig. 1) during June 2001. The hydrometeorological towerat Telbrung is equipped with sensors that fully monitorthe water <strong>and</strong> energy cycles including soil moisture,soil temperature, soil heat fluxes, <strong>and</strong> incoming <strong>and</strong> outgoingshortwave <strong>and</strong> longwave radiation fluxes. Evapotranspiration(ET) estimates are obtained indirectly fromthe latent heat flux, which is estimated as the residual<strong>of</strong> the energy balance equation. During the monsoon,ET varies between 0.5 <strong>and</strong> 6 mm day 1 , correspondingto an average daily evaporative fraction (ET/rainfall) onthe order <strong>of</strong> 0.15. Telbrung is a ridge location; at lowelevations, which do not see rainfall during the day, weestimate that the evaporative fraction correspond to averagepremonsoon values about 0.35 when soil moistureavailability is not a limiting factor. Although spatiallyvariable, these data imply that 15%–35% <strong>of</strong> the dailysoil moisture supply is locally or regionally recycled.The remainder must be restored daily through moistureadvection by the monsoon flow. Thus, analysis <strong>of</strong> thediurnal cycle <strong>of</strong> tropospheric winds is warranted.Let us consider the diurnal evolution <strong>of</strong> U <strong>and</strong> V inJune 2001 for three surface stations (Fig. 8). The Besisaharstation was a temporary station established nearthe sounding station to support the flights, whereas Koprung<strong>and</strong> Rambrong are high-altitude stations along theeastern <strong>and</strong> central ridges, respectively, <strong>of</strong> the Marsy<strong>and</strong>inetwork (Table 1, Fig. 1). There is a diurnalreversal <strong>of</strong> wind direction at Besisahar (SE during daytime,NW at night) indicative <strong>of</strong> normal valley flow,although the strongest winds are observed during thedaytime. By contrast, Rambrong sees no such reversal,only a slight veering <strong>of</strong> the enhanced daytime winds
1416 MONTHLY WEATHER REVIEWVOLUME 131FIG. 7. Time series <strong>of</strong> (top) relative humidity (RH), (middle) evapotranspiration (ET), <strong>and</strong> (bottom)rainfall observations at the Telbrung tower (station 19 in Table 1 <strong>and</strong> Fig. 1) during Jun 2001.FIG. 8. Daily cycles <strong>of</strong> surface winds at three network stations.
JULY <strong>2003</strong> BARROS AND LANG1417FIG. 9. Daily cycles <strong>of</strong> vertical pr<strong>of</strong>iles <strong>of</strong> winds at Besisahar.from SE to SW in the late afternoon. Koprung, at anintermediate altitude, has a very weak reversal in theN–S plane, but once again afternoon winds are strongest<strong>and</strong> mostly from the S to SE. As noted earlier, the asymmetrybetween day <strong>and</strong> night winds is observed elsewherein the Himalayas (Egger et al. 2000; Ueno et al.2001; Bollasina et al. 2002).Figure 9 shows the diurnal evolution <strong>of</strong> the verticalpr<strong>of</strong>iles <strong>of</strong> U <strong>and</strong> V winds at Besisahar. Mean windspeeds are fairly light (5 ms 1 ) in this region, particularlyin the lower troposphere with behavior similarto the surface observations at Besisahar (Fig. 8), thatis, daytime upvalley winds <strong>and</strong> nocturnal downvalleyflow. The low-level flow is less southerly/more northerlywhen results from rain soundings are considered separately(not shown), suggesting that cool outflow fromrainstorms increases the downvalley tendency <strong>of</strong> windsin accord with the analysis <strong>of</strong> Steiner et al. (<strong>2003</strong>) inthe Alps. The diurnal variability <strong>of</strong> middle- <strong>and</strong> uppertroposphericwinds is less clear, mostly showing shortdurationfluctuations around the mean trend <strong>of</strong> increasingwesterly flow (i.e., veering <strong>of</strong> winds) with altitudeaway from SE flow in the midtroposphere.The main reason for the lack <strong>of</strong> an upper-level diurnalcycle is the evolution <strong>of</strong> the wind fields during thecourse <strong>of</strong> the project, which was much stronger than thediurnal cycle amplitude except near the surface (Fig. 3).That is, the most trust should be placed in the diurnalcycle results from the lowest parts <strong>of</strong> the troposphere,<strong>and</strong> regions al<strong>of</strong>t should be viewed skeptically sincetemporal evolution <strong>of</strong> the wind field was not removedwhen computing diurnal cycle.These results show that a southerly component <strong>of</strong> flowis present during much <strong>of</strong> the day (also observed at highaltitudesurface stations; Fig. 8), which is strengthenedby the daytime valley wind at low levels. Given thenegative gradient in atmospheric moisture between India<strong>and</strong> the Tibetan Plateau during the monsoon, near-constantadvection <strong>of</strong> moisture into the Marsy<strong>and</strong>i regionis expected under these wind conditions (Peixoto <strong>and</strong>Oort 1992). Increased near-surface southerly flow duringthe afternoon enhances this advection <strong>and</strong>, in concertwith the weak nighttime wind reversal, sets up the nocturnalmaximum in precipitable water.5. Case study: 13 June 2001An excellent example <strong>of</strong> nocturnal convection is thethunderstorm case <strong>of</strong> 13 June 2001 (local time). Whilenot the most significant rain event during MOHPREX,a TRMM overpass occurred during this storm, providinginsight into the vertical structure <strong>of</strong> nocturnal convectionin this region. This storm occurred during the monsoononset period, when the Bay <strong>of</strong> Bengal depressionwas slowly progressing westward across central India.Soundings at 1800 (prior to event) <strong>and</strong> 2100 UTC (duringevent) contained 2051 <strong>and</strong> 2276 J kg 1 <strong>of</strong> CAPE,respectively, which is suggestive <strong>of</strong> intense convection(Bluestein 1993). Figure 10 shows rain rates spread outduring the night <strong>and</strong> into the early morning hours for
1418 MONTHLY WEATHER REVIEWVOLUME 131FIG. 10. Time series <strong>of</strong> rainfall at select network gauges for the nocturnal precipitation event <strong>of</strong> 13Jun 2001. The time <strong>of</strong> the TRMM overpass is noted by the vertical dotted–dashed black line.available network stations. (Also noted is the time <strong>of</strong>the TRMM overpass.) The Ganpokhara (central ridge)<strong>and</strong> Pasqam Ridge stations received the heaviest rainfall.However, rain rates remained less than 10 mm h 1 atmost gauges.Although the TRMM overpass occurred during a time<strong>of</strong> reduced rainfall at the network, there was still intenseconvection in the region (Fig. 11). In fact, during theentire 2100 UTC Besisahar flight, which matched thetiming <strong>of</strong> the TRMM overpass, observers noted light tomoderate rainfall. Two vertical cross sections are shownin Fig. 12: one through a core just east <strong>of</strong> Besisahar(bottom-left panel), <strong>and</strong> another through the bent line<strong>of</strong> convection to the SE (bottom-right panel). The Besisaharcell demonstrates the typical vertical structureexpected <strong>of</strong> electrified tropical convection (Petersen etal. 1996). Peak radar reflectivities exceed 45 dBZ, butthe highest reflectivities are situated mostly below thefreezing-level altitude (5.5 km MSL). However, reflectivitiesin excess <strong>of</strong> 30 dBZ do extend up to 10 km,well above the 10C layer altitude at 7 km. Thethreshold <strong>of</strong> 30 dBZ above the 10C layer altitude isgenerally regarded as sufficient for electrification (Petersenet al. 1996). Not surprisingly, frequent lightning<strong>and</strong> thunder were observed at Besisahar.The SE convective line is much more intense thanthe Besisahar cell, consistent with its larger size. Indeed,40 dBZ extends several kilometers above the freezinglevelaltitude. While a time history <strong>of</strong> reflectivity structureis not available, the bent nature <strong>of</strong> the convectiveline is suggestive <strong>of</strong> retarding effects on storm motionby the orography.Meteosat-5 infrared imagery (not shown) from thistime reveals a classic pattern <strong>of</strong> nocturnal convectionin the Himalayas that is <strong>of</strong>ten observed during the monsoon.Strong convection associated with the depression(cf. Fig. 5) is present over central India, while northernIndia is very clear. However, multiple cells are linedagainst the Himalayan Mountains, with clear conditionsover the Tibetan Plateau.This case study shows that intense <strong>and</strong> organized convectivesystems, isolated from the major monsoon systemsover India, can occur along the footslopes <strong>of</strong> theHimalayas during the monsoon. Such systems can bevertically developed <strong>and</strong> produce frequent lightning,reminiscent <strong>of</strong> monsoon break convective storms thathave been studied in other regions <strong>of</strong> the world [e.g.,northern Australia; Rutledge et al. (1992), Williams etal. (1992), Cifelli <strong>and</strong> Rutledge (1998)]. This is consistentwith a monsoon that is in its nascent stages, aswas the case on 13 June.6. Regional-scale variabilityCurrently, there are no other radiosonde stations inNepal, although there are several in northern India, withina few hundred kilometers <strong>of</strong> the project site. In addition,there are two active radiosonde stations in Tibet
JULY <strong>2003</strong> BARROS AND LANG1419FIG. 11. Horizontal <strong>and</strong> vertical cross sections <strong>of</strong> TRMM-measured radar reflectivity for the 13 Jun 2001 event.(see MB for a map <strong>of</strong> radiosonde stations in this region).However, soundings from these regions are well knownto be among the most error prone in the world (Collins2001). During our analysis, we found many clearly erroneouswinds <strong>and</strong> temperatures, but by far the largestproblem was with the humidity measurements. In thelower troposphere, the air <strong>of</strong>ten was measured to be nearsaturation in the Indian soundings, despite the presence<strong>of</strong> temperatures in the range 25–35C. This led to clearlyunrealistic mixing ratios greater than 25 g kg 1 .Wesuspect that wetting <strong>of</strong> the relative humidity sensor, particularlyduring rainstorms, is a chronic problem for theIndian flights. The other problem with the soundingswere the low frequency <strong>of</strong> flights (at best two per day;0000 <strong>and</strong> 1200 UTC) <strong>and</strong> frequent early terminationbefore reaching the tropopause, both <strong>of</strong> which hamperthe acquisition <strong>of</strong> statistically relevant numbers for comparisonwith the MOHPREX data.Therefore, in this study we decided to use the NationalCenters for Environmental Prediction–National Centerfor Atmospheric Research (NCEP–NCAR) reanalysis(Kalnay et al. 1996) for comparison with MOHPREX.Reanalysis data are available at 6-h intervals, 2.5 horizontalresolution, <strong>and</strong> 12 vertical levels in the range1000–100 hPa. The caveat is that over the Himalayas,the reanalysis data <strong>of</strong> interest (temperature, moisture,winds) are <strong>of</strong> course primarily derived from the aforementionedsoundings. However, this is after rigorouserror checking <strong>and</strong> balancing <strong>of</strong> any physically unrealisticvalues by the reanalysis model. The other advantage<strong>of</strong> using the reanalysis as a basis for comparisonis that the scientific community uses it extensively, <strong>and</strong>thus the MOHPREX data provide an excellent independentcheck on its ability to capture monsoon conditionsnear the extreme Himalayan barrier.Because <strong>of</strong> the coarse horizontal resolution <strong>of</strong> thereanalysis data (2.5), we do not expect good agreementwith the MOHPREX data below the local terrain envelope.The reanalysis cannot possibly resolve the steepmesoscale <strong>and</strong> microscale terrain features in the vicinity<strong>of</strong> the MOHPREX launch stations, which would havestrong effects on the MOHPREX winds through slopeflows <strong>and</strong> blocking. For example, ridges in excess <strong>of</strong>2000–3000 m MSL are located near the valley Besisaharsite. Tansen is more exposed near a hilltop, but ridgeson the order <strong>of</strong> 1000–2000 m MSL are nearby. However,above 700 hPa (3000 m MSL; the local terrain envelope)there is a better basis to compare the NCEP <strong>and</strong>MOHPREX data, since local terrain would have less <strong>of</strong>an effect on the dominant large-scale flow at these altitudes.Thus, we place most <strong>of</strong> our focus on middle<strong>and</strong>upper-tropospheric data <strong>and</strong> determine how well thereanalysis matches the large-scale environment in theHimalayas.The first step is to compare the Besisahar <strong>and</strong> Tansensoundings themselves, to underst<strong>and</strong> variability on the
1420 MONTHLY WEATHER REVIEWVOLUME 131FIG. 12. Vertical pr<strong>of</strong>iles <strong>of</strong> mean temperature, mixing ratio, <strong>and</strong> wind differences between Besisahar<strong>and</strong> Tansen.mesoscale (physical separation <strong>of</strong> the sites is 90 km).For all comparisons in this section soundings were firstinterpolated to a vertical grid with 5-hPa spacing. Figure12 shows the mean pr<strong>of</strong>ile differences between the twosites for all relevant parameters. The sites had 22 soundingsin common with one another. On the whole, agreementis fairly good, suggesting not much atmosphericvariability is occurring on the mesoscale near the mountains.There is a tendency for the Besisahar pr<strong>of</strong>ile tobe slightly cooler (1C difference) than Tansen.Tansen saw greater moisture in the lower troposphere,possibly due to the presence <strong>of</strong> surface vegetation at theelevated launch site (850 hPa altitude). However, therewas significantly more moisture (2 gkg 1 difference)in the midtroposphere above Besisahar. One reason forthis may have been the larger percentage <strong>of</strong> rain flightsTABLE 3. Specifics <strong>of</strong> the NCEP–NCAR reanalysis grid points usedin the analyses. Note that the elevation is for model topography only,<strong>and</strong> does not necessarily match the true elevation at that location onEarth.Letter Lat (N) Lon (E) Elev (MSL, m) DescriptionABCDE30.030.027.527.525.082.585.082.585.085.0435153978581966115PlateauPlateauHimalayasHimalayasPlainsat Besisahar, leading to its sondes traveling throughmore cloud layers. However, another possibility couldbe enhanced moisture convergence at midlevels due tothe blocking effects <strong>of</strong> the Himalayan range. At Besisaharthere is a tendency for stronger low-level easterlywinds, as well as more southerly flow throughout thetroposphere (except near the surface). The low-levelwind effects are most likely the result <strong>of</strong> the Besisaharvalley wind.In comparing the NCEP–NCAR reanalysis to MOH-PREX, we decided on five grid points for this intercomparison(Fig. 1; Table 3): two at 30.0N in the TibetanPlateau (points A <strong>and</strong> B), to the NW <strong>and</strong> NE; twoalong the Himalayas at 27.5N (points C <strong>and</strong> D), to theeast <strong>and</strong> west <strong>of</strong> the launch sites; plus one at 25.0N onthe Indian plains SE <strong>of</strong> the project site (point E). Table3 shows the relevant information for these grid points.There is good agreement in the wind time series athigh levels in the atmosphere (Fig. 13a). At 500 hPa(Fig. 13b), above the tips <strong>of</strong> the ridges by Besisahar, Uwinds match well with nearby grid points (points C <strong>and</strong>D). However, the reanalysis shows more variability thanthe MOHPREX data. Note how the late June increasein V wind at Besisahar is not captured as well by thereanalysis. Perhaps the best agreement between MOH-PREX <strong>and</strong> the reanalysis is seen at 200 hPa (Fig. 13b),well above the tallest ridges. Here the changes at Be-
JULY <strong>2003</strong> BARROS AND LANG1421FIG. 13. (a) Time series <strong>of</strong> 500-hPa winds for Besisahar, Tansen, <strong>and</strong> five surrounding NCEP–NCARreanalysis grid points (Table 3). (b) Same as in (a) but for 200 hPa.
1422 MONTHLY WEATHER REVIEWVOLUME 131sisahar <strong>and</strong> Tansen reflected the large-scale variabilityoccurring in the NCEP data. In particular, note how oncethe monsoon was fully established after 15 June, differencesin the U data occurred among the grid points.A reintensification <strong>of</strong> the westerlies occurs in the TibetanPlateau, while in northern India upper-level easterlieswere dominant. This pattern is indicative <strong>of</strong> thefamiliar upper-level monsoon high over the plateau(Murakami 1987). In between, weak E–W flow becomesestablished in the Himalayan grid points (C <strong>and</strong> D) <strong>and</strong>Besisahar.Mean differences in temperature, moisture, <strong>and</strong> windpr<strong>of</strong>iles are shown in Fig. 14a (Besisahar-NCEP) <strong>and</strong>Fig. 14b (Tansen-NCEP). We display characteristic terrainelevations in these plots to assist in underst<strong>and</strong>ingterrain influences. Most ridges in the immediate vicinity<strong>of</strong> the MOHPREX radiosonde sites do not exceed 2000–3000 m MSL, although 4000–5000 m are common elevationsin the nearby high Himalayas <strong>and</strong> Tibetan Plateau.Note how both Besisahar <strong>and</strong> Tansen tended tohave more midlevel moisture than the NCEP grid points.In addition, temperature pr<strong>of</strong>iles disagreed the most forthe Tibetan grid points as expected since the plateau isan elevated heat source relative to the surrounding atmosphere(e.g., Ye 1981). As seen in the wind timeseries, the best agreement between MOHPREX <strong>and</strong> thereanalysis occurred for the Himalayan grid points. However,there still tended to be stronger southerly flow atBesisahar, throughout much <strong>of</strong> the troposphere. Thiscould have been due to the N–S valley in which the sitewas located. Flow in the N–S plane through this valleywould be less obstructed than flow over the coarse reanalysistopography. There also could have been somechanneling <strong>of</strong> the flow by the narrow valley, increasingwind speeds. This would increase moisture advection<strong>and</strong> may be a partial cause <strong>of</strong> the observed large differencesin midlevel moisture.The midlevel moisture differences have pr<strong>of</strong>ound impactson total column moisture. Figure 15 shows timesseries <strong>of</strong> precipitable water for the reanalysis points <strong>and</strong>for MOHPREX (cf. Fig. 4a). While PW at Tansen agreesrelatively well (within 25%) with the moistureamounts at the closest NCEP grid point (point C), Besisaharhas much more moisture, at times even exceedingthe precipitable water at the upstream NCEP gridpoint over northern India (point E). Most NCEP pr<strong>of</strong>ilescapture the decreasing moisture in early June, but theincrease associated with monsoon onset comes up to 4days later than during MOHPREX. In addition, there isa late June moisture decrease in most <strong>of</strong> the NCEP datathat was not observed at Besisahar. Finally, despite havingfour time points per day the NCEP data show adiurnal cycle that is extremely weak compared to theone observed at Besisahar. Overall, there appear to bepr<strong>of</strong>ound disagreements between the MOHPREX <strong>and</strong>reanalysis data in terms <strong>of</strong> atmospheric moisture.According to the reanalysis, average June 2001 dailyrainfall in the vicinity <strong>of</strong> the Marsy<strong>and</strong>i network (usingpoint D) was 12.3 mm, compared to the 17–19 mmobserved on an average day at the network proper. Indeed,the observed range <strong>of</strong> rainfall totals at the networkis comparable to reanalysis-predicted rainfall on the outskirts<strong>of</strong> the Bay <strong>of</strong> Bengal. This is also true for precipitablewater values. Clearly, significantly more moistureexists along the Himalayas than previously estimated.7. ConclusionsThe MOHPREX project has been described, <strong>and</strong> majorresults shown. The project was a great success consideringthe difficulties experienced. Good coverage <strong>of</strong>the diurnal cycle <strong>of</strong> the atmosphere (temperature, moisture,winds), as well as the onset <strong>and</strong> development <strong>of</strong>the early monsoon, were obtained for two sites alongthe Himalayas in central Nepal.The onset <strong>of</strong> the monsoon manifested itself as a gradualincrease in total column moisture <strong>and</strong> convectiveinstability, <strong>and</strong> a weakening <strong>of</strong> middle- <strong>and</strong> upper-troposphericwesterly winds. The lower-level winds weremore strongly affected by the diurnal cycle <strong>of</strong> slope <strong>and</strong>valley winds. However, daytime upslope/upvalley windswere more intense than their nocturnal downslope/downvalley counterparts. This result is consistent withobservations in other parts <strong>of</strong> the Himalayas (Egger etal. 2000; Ueno et al. 2001; Bollasina et al. 2002) <strong>and</strong>supports the theory <strong>of</strong> diurnal winds along tropicalslopes in opposing flows (Fitzjarrald 1984). In this case,the opposing flow is the monsoon winds. Also, the observationsare consistent with the presence <strong>of</strong> the Tibetansurface low pressure (Murakami 1987), whichwould tend to favor upslope flow over downslope (Zänglet al. 2001).The diurnal cycles <strong>of</strong> moisture <strong>and</strong> instability supportthe observations <strong>of</strong> a postmidnight maximum in rainfallin this region. A case study <strong>of</strong> a nocturnal storm wasshown, with intense vertical structure as revealed byTRMM. The data suggest that vertically intense breakconvection was prevalent during the early monsoon,consistent with a monsoon flow that had not fully establisheditself by the end <strong>of</strong> the project in late June.Based on the results <strong>of</strong> the MOHPREX project, apossible mechanism to explain the nocturnal peak inrainfall is shown in Fig. 16. Large-scale monsoon flowis presumed to be roughly constant during the day <strong>and</strong>night, though it is <strong>of</strong> course subject to the variability inthe monsoon trough over northern India <strong>and</strong> the appearance<strong>of</strong> monsoon depressions in the Bay <strong>of</strong> Bengal.The Besisahar wind data show weak diurnal variationwell above the surface, which supports this assumption.However, the mountains provide a huge barrier to theseflows, tending to block them <strong>and</strong> cause convergence,particularly at low levels. This convergence is reducedduring the daytime because diurnally forced upslope <strong>and</strong>upvalley flow reduce the spatial gradients in wind velocities.The upslope flow aids the formation <strong>of</strong> con-
JULY <strong>2003</strong> BARROS AND LANG1423FIG. 14. (a) Vertical pr<strong>of</strong>iles <strong>of</strong> mean temperature, mixing ratio, <strong>and</strong> wind differences between Besisahar<strong>and</strong> five surrounding NCEP–NCAR reanalysis grid points. (b) Same as in (a) but for Tansen <strong>and</strong> the reanalysisgrid points. The horizontal dotted lines note the pressure-coordinate heights <strong>of</strong> characteristic terrain elevationsnear Besisahar <strong>and</strong> Tansen (2000–5000 m MSL).
1424 MONTHLY WEATHER REVIEWVOLUME 131FIG. 15. Time series <strong>of</strong> precipitable water for Besisahar, Tansen, <strong>and</strong> five surrounding NCEP–NCAR reanalysis grid points.FIG. 16. Schematic diagram <strong>of</strong> the proposed mechanism to explainnocturnal rainfall in the Himalayas.vection at higher elevations, leading to the observedsecondary peak in rainfall there.At night, however, wind speeds become relativelyweak near the surface, even reversing direction in valleyssuch as the Marsy<strong>and</strong>i. Thus, near-surface windconvergence increases, leading to upward motion thatcan force convection. This convection is aided by thesteady increase <strong>of</strong> moisture during the day from advectionby the monsoon flow. In addition, atmospheric instabilityis maximized during nocturnal hours, due tointeraction between the steady increase in surface moisture<strong>and</strong> diurnal heating <strong>and</strong> cooling <strong>of</strong> the atmosphere.The near-coincident availability <strong>of</strong> moisture, instability,<strong>and</strong> surface forcing leads to the nocturnal peak in rainfall.This peak will be strongest at low elevations whereblocking <strong>of</strong> flow is most active, as observed.This is qualitatively similar to the processes that causepredominantly nocturnal rainfall over tropical isl<strong>and</strong>s,such as Hawaii (Chen <strong>and</strong> Nash 1994). On tropical isl<strong>and</strong>s<strong>and</strong> in the Himalayas, the thermally forced diurnalflow interacts with the predominant environmental flow(trade winds in the case <strong>of</strong> Hawaii, the monsoon flowfor the Himalayas), causing nocturnal convergence <strong>and</strong>subsequent precipitation.The nocturnal convergence could be aided by the interactionbetween mountain-forced gravity waves <strong>and</strong>the thermodynamics <strong>of</strong> the Himalayan atmosphere,which MOHPREX shows is most favorable for noctur-
JULY <strong>2003</strong> BARROS AND LANG1425nal convection. In a numerical simulation <strong>of</strong> monsoononset in this region, <strong>Barros</strong> <strong>and</strong> <strong>Lang</strong> (<strong>2003</strong>) showedthat spatially fixed gravity waves form over the terrain,with downward motion strongest over ridges <strong>and</strong> upwardmotion strongest between ridges. Under normalmonsoon conditions, the SE flow that creates this gravitywave pattern is not as strong, but it should be enoughto force some waves. The waves occur as long as theforcing flow holds, <strong>and</strong> the upward-moving antinodesshould fire <strong>of</strong>f convection when the thermodynamics arefavorable (near midnight).In summary, the proposed mechanism suggests a robustatmospheric system that strongly favors nocturnalconvection <strong>and</strong> rainfall. It also explains why this nocturnalpeak does not occur elsewhere, such as the TibetanPlateau or the northern Indian plains, <strong>and</strong> whythis nocturnal peak only occurs during the monsoon.The interaction <strong>of</strong> the ambient monsoon flow with thesouth slopes <strong>of</strong> the Himalayas, modulated by the diurnalvariability <strong>of</strong> atmospheric state, is the primary cause <strong>of</strong>the nocturnal peak. Future numerical modeling work isplanned to provide more support for this hypothesis.This hypothesis has advantages over one based on alow-level jet (LLJ), which is used to explain nocturnalconvection in the high plains <strong>of</strong> the United States (e.g.,Bluestein 1993). Although LLJs are expected to occurnear large mountain barriers at latitudes characteristic<strong>of</strong> the Himalayas (30), we find no evidence for diurnallyvariable barrier jets in either the MOHPREX orNCEP–NCAR reanalysis data. The Himalayas are adata-poor region, but strong LLJs may be preventedfrom forming in the vicinity <strong>of</strong> the Marsy<strong>and</strong>i network(<strong>and</strong> other portions <strong>of</strong> the middle Himalayas) due to thesteep <strong>and</strong> variable topography in this region. In addition,the long-term presence <strong>of</strong> the monsoon trough overnorthern India may play a role in preventing or alteringLLJs. Synoptically forced barrier jets, however, can beimportant for moisture <strong>and</strong> precipitation when monsoondepressions approach the Himalayas (Fig. 5; also <strong>Lang</strong><strong>and</strong> <strong>Barros</strong> 2002). However, under these conditions thelarge-scale flow tends to overwhelm any terrain-forceddiurnal effects (<strong>Lang</strong> <strong>and</strong> <strong>Barros</strong> 2002).The MOHPREX data provided an excellent independentcheck on the performance <strong>of</strong> the NCEP–NCARreanalysis in this normally data-poor region. Overall,the reanalysis data captured well upper-level winds thatwould not be as affected by the steep topography thatthe model is too coarse to resolve. However, moisturewas consistently underestimated by the reanalysis, havingpr<strong>of</strong>ound impacts on simulated rainfall amounts,which undercut observed values by about one-third. Thelow model resolution <strong>and</strong> lack <strong>of</strong> reliable observationsin this region are the most likely c<strong>and</strong>idates to explainthis underestimation <strong>of</strong> moisture.Overall, it appears that the south slopes <strong>of</strong> the Himalayasstill are not well resolved by existing datasets,despite the presence <strong>of</strong> prodigious monsoon rainfall <strong>and</strong>latent heating. The results <strong>of</strong> MOHPREX <strong>and</strong> from theMarsy<strong>and</strong>i network in general should go a long waytoward addressing these concerns. These data are beingused currently to evaluate simulations produced by acloud-resolving atmospheric model under typical monsoononset conditions in the central Himalayas. Theobjective is to elucidate the orographic effects on thespatial distribution <strong>of</strong> winds <strong>and</strong> rainfall, <strong>and</strong> to characterizeorography–convection interactions <strong>and</strong> theirimpact on the diurnal cycle <strong>of</strong> rainfall in the Himalayas.Acknowledgments. NSF provided funding for MOH-PREX under Grant EAR-9909498. Several participantswere also funded by NASA/TRMM under Grant NAG5-7781. Dr. Ana <strong>Barros</strong> was the principal investigator forMOHPREX. Dr. Timothy <strong>Lang</strong> was the lead scientistin the field during the project. The authors extend theirgratitude to the Nepal Department <strong>of</strong> Hydrology <strong>and</strong>Meteorology for the opportunity to conduct the MOH-PREX project. This project could not have been possiblewithout the dedicated efforts <strong>of</strong> Tank Ojha, our Nepaleseliaison, <strong>and</strong> his network <strong>of</strong> interpreters, porters, <strong>and</strong>drivers. Dr. Jaakko Putkonen <strong>of</strong> the <strong>University</strong> <strong>of</strong> Washingtonparticipated in the first 2 weeks <strong>of</strong> the field phase<strong>of</strong> MOHPREX, <strong>and</strong> manages the periodic collection <strong>of</strong>Marsy<strong>and</strong>i network data at other times. Timothy Lim<strong>of</strong> NCAR was the lead technician in the field for thefirst 2 weeks <strong>of</strong> the project, <strong>and</strong> was responsible fortraining project participants in the launching <strong>of</strong> radiosondes.We thank the graduate <strong>and</strong> undergraduate studentswho assisted in the field: Dr. Steve Nesbitt (<strong>University</strong><strong>of</strong> Utah) <strong>and</strong> Casey Brown (Harvard <strong>University</strong>),as well as Elizabeth Korb <strong>and</strong> Martha Fern<strong>and</strong>es (both<strong>of</strong> Tufts <strong>University</strong>). Dr. Rit Carbonne <strong>and</strong> Ned Chamberlain<strong>of</strong> NCAR, <strong>and</strong> Dr. Douglas Burbank <strong>and</strong> BethPratt <strong>of</strong> <strong>University</strong> <strong>of</strong> <strong>California</strong>, <strong>Santa</strong> <strong>Barbara</strong>, assistedin the planning <strong>of</strong> MOHPREX. Dr. Ramata Magagi <strong>of</strong>Harvard <strong>University</strong> provided a very useful Meteosat-5perspective via satellite phone during the project (satellitedata were obtained from the <strong>University</strong> <strong>of</strong> Wisconsin/SSEC).Dr. Edward Zipser <strong>of</strong> <strong>University</strong> <strong>of</strong> Utahgave excellent feedback <strong>and</strong> guidance in the interpretation<strong>of</strong> results. Finally, the staff <strong>and</strong> ownership <strong>of</strong> theHotel Sayapatri in Besisahar are commended for theirexceptional hospitality toward project workers.APPENDIX ASounding Data Quality ControlThe radiosonde system used was the National Centerfor Atmospheric Research (NCAR) GPS/Loran AtmosphericSounding System (GLASS). The radiosondemodel used was the Vaisala RS 80-15GH. Both <strong>of</strong> thesesystems are st<strong>and</strong>ards within the meteorological researchcommunity, <strong>and</strong> more information on them (includingspecifications <strong>and</strong> measurement accuracy) canbe found at the NCAR Atmospheric Technology DivisionWeb site (http://www.atd.ucar.edu/rtf/facilities/
1426 MONTHLY WEATHER REVIEWVOLUME 131class/class.html). The GLASS system provides excellentvertical resolution with a time resolution <strong>of</strong> 1 s. Windsare measured by the GPS method.There were 150 sondes originally supplied to theMOHPREX project. However, as is typical <strong>of</strong> similarfield projects, some attrition in the form <strong>of</strong> launch failures<strong>and</strong> data loss occurred. Nevertheless, launch failureswere typical to below average as compared to otherfield experiments with the NCAR GLASS system (T.Lim 2001, personal communication). Specifically,launch failures were about 10%–15% <strong>of</strong> all sondes, most<strong>of</strong> these being partial failures with some (<strong>of</strong>ten most)data available. There were 121 sounding flights <strong>of</strong> analyzablequality for Besisahar (117 with at least somewind data), <strong>and</strong> 22 for Tansen (21 with at least somewind data; Table 2). Corrupted data were removed bya combination <strong>of</strong> st<strong>and</strong>ard hydrostatic checks <strong>and</strong> checkson erratic raw data at the timescale <strong>of</strong> 1 s. Correctedpr<strong>of</strong>iles were carefully checked against less noisy flightsat similar times in order to confirm that the proper datawere retained. No obvious biases in observed fields werenoted.APPENDIX BDiurnal Cycle AnalysisThere were not enough soundings to compute a diurnalcycle at Tansen with acceptable statistical confidencein the results. Diurnal cycles for Besisahar soundingswere calculated in the following way. First, the dayin local time was split up into eight 3-h bins (0000,0300, 0600, 0900, 1200, 1500, 1800 <strong>and</strong> 2100 LNT).Then, soundings were placed in the appropriate bin ifthey occurred within 1.5 h <strong>of</strong> the bin time. Once allsoundings were distributed, mean values <strong>of</strong> all fieldswere calculated for each bin. Because Nepal is nearly6 h ahead <strong>of</strong> UTC <strong>and</strong> launches were based on UTCtime, flights did not deviate significantly from the center<strong>of</strong> the bin period except when they were adjusted tomatch TRMM overpasses. Note from Table 2 that only11 <strong>of</strong> 23 project days had more than five launches, <strong>and</strong>only 6 days had seven or more launches. The most common<strong>of</strong>f hours were 0900, 1500, <strong>and</strong> 2100 LNT, soresults from these time periods should be viewed withextra caution, as fewer flights were available for analysis.Diurnal cycle analyses do not take into accountthe month-long evolution <strong>of</strong> the analyzed fields, whichwas discussed in section 3.Daily cycles <strong>of</strong> vertical pr<strong>of</strong>iles were calculated byfirst dividing up each vertical pr<strong>of</strong>ile into 11 segments.Resolution <strong>of</strong> each segment was 50 hPa between 900<strong>and</strong> 700 hPa, <strong>and</strong> 100-hPa resolution above this layerup to 100 hPa. For any specific flight, all data withineach segment were averaged together. Then, each segmentwas binned in time <strong>and</strong> the daily cycle calculatedin the manner discussed above.In order to determine the extent to which the presence<strong>of</strong> rain affected results, rain <strong>and</strong> no-rain flights also weredefined. Rain flights were those that occurred with rainfallobserved at the surface, either at the time <strong>of</strong> launch,up to 1 h prior to launch, or within 15 min after launch.The main purpose was to identify soundings that occurredwhen the lower troposphere was potentially rainsaturated, which could significantly affect low-levelmoisture measurements (<strong>and</strong> throw <strong>of</strong>f estimates <strong>of</strong>CAPE <strong>and</strong> PW).REFERENCESBanta, R. M., 1990: The role <strong>of</strong> mountain flows in making clouds.Atmospheric Processes over Complex Terrain, Meteor. Monogr.,No. 45, Amer. Meteor. Soc., 229–283.<strong>Barros</strong>, A. P., <strong>and</strong> T. J. <strong>Lang</strong>, <strong>2003</strong>: Exploring spatial modes <strong>of</strong> variability<strong>of</strong> terrain–atmosphere interactions in the Himalayas duringmonsoon onset. Hydrosciences Rep. Series 03-001, Division<strong>of</strong> Engineering <strong>and</strong> Applied Sciences, Harvard <strong>University</strong>, 51pp.——, M. Joshi, J. Putkonen, <strong>and</strong> D. W. Burbank, 2000: A study <strong>of</strong>the 1999 monsoon rainfall in a mountainous region in centralNepal using TRMM products <strong>and</strong> rain gauge observations. Geophys.Res. Lett., 27, 3683–3686.Bluestein, H. B., 1993: Observations <strong>and</strong> Theory <strong>of</strong> Weather Systems.Vol. II. Synoptic–Dynamic Meteorology in Midlatitudes, Oxford<strong>University</strong> Press, 594 pp.Bollasina, M., L. Bertolani, <strong>and</strong> G. Tartari, 2002: Meteorologicalobservations at high altitude in the Khumbu Valley, Nepal Himalayas,1994–1999. Bull. Glaciol. Res., 19, 1–11.Burbank, D. W., <strong>and</strong> N. Pinter, 1999: L<strong>and</strong>scape evolution: The interactions<strong>of</strong> tectonics <strong>and</strong> surface processes. Basin Res., 11, 1–6.Chen, L., E. R. Reiter, <strong>and</strong> Z. Feng, 1985: The atmospheric heatsource over the Tibetan Plateau: May–August 1979. Mon. Wea.Rev., 113, 1771–1790.Chen, Y.-L., <strong>and</strong> A. J. Nash, 1994: Diurnal variation <strong>of</strong> surface airflow<strong>and</strong> rainfall frequencies on the isl<strong>and</strong> <strong>of</strong> Hawaii. Mon. Wea. Rev.,122, 34–56.Cifelli, R., <strong>and</strong> S. A. Rutledge, 1998: Vertical motion, diabatic heating,<strong>and</strong> rainfall characteristics in north Australia convectivesystems. Quart. J. Roy. Meteor. Soc., 124, 1133–1162.Collins, W. G., 2001: The operational complex quality control <strong>of</strong>radiosonde heights <strong>and</strong> temperatures at the National Centers forEnvironmental Prediction. Part II: Examples <strong>of</strong> error diagnosis<strong>and</strong> correction from operational use. J. Appl. Meteor., 40, 152–168.Egger, J., S. Bajrachaya, U. Egger, R. Heinrich, J. Reuder, P. Shayka,H. Wendt, <strong>and</strong> V. Wirth, 2000: Diurnal winds in the HimalayanKali G<strong>and</strong>aki valley. Part I: Observations. Mon. Wea. Rev., 128,1106–1122.EUMETSAT, 2000: The Meteosat System. EUM TD 05, EuropeanOrganisation for the Exploitation <strong>of</strong> Meteorological Satellites.Fitzjarrald, D. R., 1984: Katabatic wind in opposing flow. J. Atmos.Sci., 41, 1143–1158.He, H., J. W. McGinnis, Z. Song, <strong>and</strong> M. Yanai, 1987: Onset <strong>of</strong> theAsian monsoon in 1979 <strong>and</strong> the effect <strong>of</strong> the Tibetan Plateau.Mon. Wea. Rev., 115, 1966–1995.Kalnay, E., <strong>and</strong> Coauthors, 1996: The NCEP/NCAR 40-Year ReanalysisProject. Bull. Amer. Meteor. Soc., 77, 437–471.Krishnamurti, T. N., <strong>and</strong> C. M. Kishtawal, 2000: A pronounced continental-scalediurnal mode <strong>of</strong> the Asian summer monsoon. Mon.Wea. Rev., 128, 462–473.Kummerow, C., W. Barnes, T. Kozu, J. Shiue, <strong>and</strong> J. Simpson, 1998:The Tropical Rainfall Measuring Mission (TRMM) sensor package.J. Atmos. Oceanic Technol., 15, 809–816.Kuo, H. L., <strong>and</strong> Y. F. Qian, 1981: Influence <strong>of</strong> the Tibetan Plateauon cumulative <strong>and</strong> diurnal changes <strong>of</strong> weather <strong>and</strong> climate insummer. Mon. Wea. Rev., 119, 2337–2356.
JULY <strong>2003</strong> BARROS AND LANG1427<strong>Lang</strong>, T. J., <strong>and</strong> A. P. <strong>Barros</strong>, 2002: An investigation <strong>of</strong> the onsets <strong>of</strong>the 1999 <strong>and</strong> 2000 monsoons in central Nepal. Mon. Wea. Rev.,130, 1299–1316.Li, C., <strong>and</strong> M. Yanai, 1996: The onset <strong>and</strong> interannual variability <strong>of</strong>the Asian summer monsoon in relation to l<strong>and</strong>–sea thermal contrast.J. Climate, 9, 358–375.Luo, H., <strong>and</strong> M. Yanai, 1983: The large-scale circulation <strong>and</strong> heatsources over the Tibetan Plateau <strong>and</strong> surrounding areas duringthe early summer <strong>of</strong> 1979. Part I: Precipitation <strong>and</strong> kinematicanalyses. Mon. Wea. Rev., 111, 922–944.——, <strong>and</strong> ——, 1984: The large-scale circulation <strong>and</strong> heat sourcesover the Tibetan Plateau <strong>and</strong> surrounding areas during the earlysummer <strong>of</strong> 1979. Part II: Heat <strong>and</strong> moisture budgets. Mon. Wea.Rev., 112, 966–989.Magagi, R., <strong>and</strong> A. P. <strong>Barros</strong>, <strong>2003</strong>: Latent heating <strong>of</strong> rainfall duringthe onset <strong>of</strong> the Indian Monsoon using TRMM-PR <strong>and</strong> radiosondedata. Hydrosciences Rep. Series 03-002, Division <strong>of</strong> Engineering<strong>and</strong> Applied Sciences, Harvard <strong>University</strong>, 56 pp.Moncrieff, M. W., <strong>and</strong> M. J. Miller, 1976: The dynamics <strong>and</strong> simulation<strong>of</strong> tropical cumulonimbus <strong>and</strong> squall lines. Quart. J. Roy.Meteor. Soc., 102, 373–394.Murakami, T., 1987: Orography <strong>and</strong> monsoons. Monsoons, J. S. Fein<strong>and</strong> P. L. Stephens, Eds., John Wiley <strong>and</strong> Sons, 331–364.Ohsawa, T., H. Ueda, T. Hayashi, A. Watanabe, <strong>and</strong> J. Matsumoto,2001: Diurnal variations <strong>of</strong> convective activity <strong>and</strong> rainfall intropical Asia. J. Meteor. Soc. Japan, 79, 333–352.Peixoto, J. P., <strong>and</strong> A. H. Oort, 1992: Physics <strong>of</strong> Climate. AmericanInstitute <strong>of</strong> Physics, 520 pp.Petersen, W. A., S. A. Rutledge, <strong>and</strong> R. E. Orville, 1996: Cloud-togroundlightning observations from TOGA COARE: Selectedresults <strong>and</strong> lightning location algorithms. Mon. Wea. Rev., 124,602–620.Rutledge, S. A., E. R. Williams, <strong>and</strong> T. D. Keenan, 1992: The DownUnder Doppler <strong>and</strong> Electricity Experiment (DUNDEE): Overview<strong>and</strong> preliminary results. Bull. Amer. Meteor. Soc., 73, 3–16.Shrestha, A. B., C. P. Wake, J. E. Dibb, <strong>and</strong> P. A. Mayewski, 2000:Precipitation fluctuations in the Nepal Himalaya <strong>and</strong> its vicinity<strong>and</strong> relationship with some large scale climatological parameters.Int. J. Climatol., 20, 317–327.Shrestha, M. L., 2000: Interannual variation <strong>of</strong> summer monsoonrainfall over Nepal <strong>and</strong> its relation to the Southern Oscillationindex. Meteor. Atmos. Phys., 75, 21–28.Steiner, M., O. Bousquet, R. A. Houze Jr., B. F. Smull, <strong>and</strong> M. Mancini,<strong>2003</strong>: Airflow within major alpine river valleys under heavyrainfall. Quart. J. Roy. Meteor. Soc., 129, 411–432.Ueno, K., <strong>and</strong> Coauthors, 2001: Meteorological observations during1994–2000 at the Automatic Weather Station (GEN-AWS) inKhumbu region, Nepal Himalayas. Bull. Glaciol. Res., 18, 23–30.Williams, E. R., S. A. Rutledge, S. C. Geotis, N. Renno, E. Rasmussen,<strong>and</strong> T. Rickenbach, 1992: A radar <strong>and</strong> electrical study<strong>of</strong> tropical hot towers. J. Atmos. Sci., 49, 1386–1395.Wu, G., <strong>and</strong> Y. Zhang, 1998: Tibetan Plateau forcing <strong>and</strong> the timing<strong>of</strong> the monsoon onset over south Asia <strong>and</strong> the South China Sea.Mon. Wea. Rev., 126, 913–927.Yatagai, A., 2001: Three-dimensional features <strong>of</strong> summer monsoonprecipitation seen from TRMM/PR <strong>and</strong> latent heat release oversouth Asia. Albuquerque, NM, Amer. Meteor. Soc., Preprints,Symp. on Precipitation Extremes: Prediction, Impacts, <strong>and</strong> Responses,Albuquerque, NM, Amer. Meteor. Soc., 195–198.Ye, D., 1981: Some characteristics <strong>of</strong> the summer circulation overthe Qinghai-Xizang (Tibet) Plateau <strong>and</strong> its neighborhood. Bull.Amer. Meteor. Soc., 62, 14–19.Zängl, G., J. Egger, <strong>and</strong> V. Wirth, 2001: Diurnal winds in the HimalayanKali G<strong>and</strong>aki valley. Part II: Modeling. Mon. Wea. Rev.,129, 1062–1080.