Blood Glucose Metabolism Instructor's Guide
Blood Glucose Metabolism Instructor's Guide
Blood Glucose Metabolism Instructor's Guide
- No tags were found...

Create successful ePaper yourself
Turn your PDF publications into a flip-book with our unique Google optimized e-Paper software.
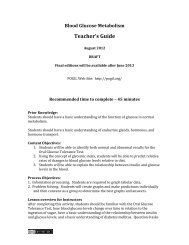
<strong>Blood</strong> <strong>Glucose</strong> <strong>Metabolism</strong>Instructor’s <strong>Guide</strong>Time to CompleteRecommended time to complete – 45-60 minutesPrior Knowledge• Students should have a basic understanding of the function of glucose innormal metabolism.• Students should have a basic understanding of endocrine glands,hormones, and hormone transport.Content Objectives• Students will be able to identify both normal and abnormal results for theOral <strong>Glucose</strong> Tolerance Test.• Students will be able to explain the relationship between insulin andglucose levels in the blood.• Using the concept of glycemic index, students will be able to predictrelative rates of changes in blood glucose levels relative to diet.Process Objectives• Information processing: Students are required to graph tabular data.Implementation Notes for InstructorsAfter completing this activity, students should be familiar with the Oral <strong>Glucose</strong>Tolerance Test, be familiar with how blood glucose levels change over time inrelation to the ingestion of sugar, develop a basic understanding of therelationship between insulin and glucose levels, and a basic understanding ofdiabetes mellitus. Question 8 asks students to brainstorm what they know aboutdiabetes, and it should be expected that some students give inaccurateinformation. Instructors may want to refer back to this question during the end ofclass discussion, e.g., “what did you write down for question 8?”(Note: the activity does not include the mechanism of action for insulin.)The activity sets the stage for an end-of-class discussion, or instructor-ledpresentation, on diabetes mellitus. Optional challenge questions are included atthe end of this activity that can be used to extend the activity either in class or ashomework. 1
Student Roles(The following roles are standard for most POGIL lessons)• Reader: reads the text of the activity (directions, questions, etc.) out loudso all members of the group can hear and follow along. Note: the readershould attempt to verbalize what is seen / communicated in graphs anddata tables.• Recorder: makes final decisions as to what is written down for finalanswers. The goal of the recorder is to determine final language of eachanswer and to provide the official text. A group often has different ideas asto what a final answer should be. The recorder is responsible fordetermining this final answer, taking into account the group’s ideas.• Taskmaster: in charge of making sure the group completes the activity ontime and keeps group members focused. Frequently says, “Are we sureabout this?” “Are we ready to move on?” and even “Put away your phone -we need to get back on task.” The taskmaster is often called upon to bethe spokesperson for the group at the end of the class and report answersto the class. 2
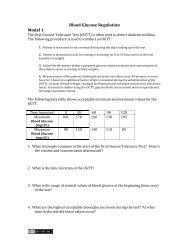
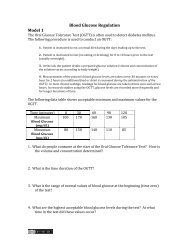
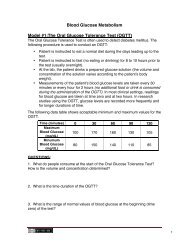
<strong>Blood</strong> <strong>Glucose</strong> RegulationModel #1:The Oral <strong>Glucose</strong> Tolerance Test (OGTT)The Oral <strong>Glucose</strong> Tolerance Test is often used to detect diabetes mellitus. Thefollowing procedure is used to conduct an OGTT:• Patient is instructed to eat a normal diet during the days leading up to thetest.• Patient is instructed to fast (no eating or drinking) for 8 to 10 hours prior tothe test (usually overnight).• At the lab, the patient drinks a prepared glucose solution (the volume andconcentration of the solution varies according to the patient’s bodyweight).• Measurements of the patient’s blood glucose levels are taken every 30minutes or every hour for 2 hours (no additional food or drink is consumedduring the administration of the OGTT). In most clinical settings, readingsfor blood glucose are taken at time zero and at two hours. In researchstudies using the OGTT, glucose levels are recorded more frequently andfor longer durations of time.The following data table shows acceptable minimum and maximum values for theOGTT.Time (minutes) 0 30 60 90 120Maximum<strong>Blood</strong> <strong>Glucose</strong> 100 170 160 130 105(mg/dL)Minumum<strong>Blood</strong> <strong>Glucose</strong>(mg/dL)80 150 140 110 85QUESTIONS:1. What do people consume at the start of the Oral <strong>Glucose</strong> Tolerance Test?How is the volume and concentration determined?A glucose solution - volume and concentration vary according to bodyweight2. What is the time duration of the OGTT?120 minutes or 2 hours3. What is the range of normal values of blood glucose at the beginning (timezero) of the test?80 mg/dL to 100 mg / dL4. What are the highest acceptable blood glucose levels during the test? At whattime in the test do these values occur? 3
170 mg/dL – at the 30 minute mark.5. What is the range of normal values of blood glucose at the end of the OGTT?85 to 105 mg / dL at the end of the test – 120 minutes6. Two individuals (Maria and Laura) both complain to their doctor of frequentthirst and frequent urination. Maria has the additional symptom of blurry visionand a “tingling sensation” in her fingers and toes. The doctor suspects diabetesmellitus, a disease in which blood glucose metabolism does not stay withinnormal ranges. The doctor orders both to undergo an Oral <strong>Glucose</strong> ToleranceTest to test this prediction. Below are the results of the OGTT.Measurements recorded during OGTTTime (minutes) 0 30 60 90 120Maria:<strong>Blood</strong> <strong>Glucose</strong> (mg/dL)Laura:<strong>Blood</strong> <strong>Glucose</strong> (mg/dL)90 140 150 135 110110 170 220 270 300a) Which individual is more suspect of having diabetes mellitus?Laura is more likely to have diabetes.b) Justify your answer comparing each person’s OGTT data to data foundin Model 1.Her blood glucose values are out of range of the normal values. 4
Model #2: <strong>Blood</strong> <strong>Glucose</strong> and <strong>Blood</strong> Insulin LevelsInsulin is a protein hormone that is secreted into the blood by the pancreas.Clinicians rarely measure insulin levels, but the procedure is regularly done inresearch labs studying diabetes.The following data show blood insulin levels that correspond to the blood glucoselevels in the OGTT used in Model 1.Measurements recorded during OGTTTime (minutes) 0 30 60 90 120Maria<strong>Blood</strong> <strong>Glucose</strong> (mg/dL)Maria<strong>Blood</strong> Insulin (pmol / L)Laura<strong>Blood</strong> <strong>Glucose</strong> (mg/dL)Laura<strong>Blood</strong> Insulin (pmol / L)90 140 150 135 11045 140 200 220 150110 170 220 270 30025 60 80 85 90QUESTIONS:7. What units are used to measure blood glucose? What units are used tomeasure blood insulin?<strong>Blood</strong> glucose is measured in mg / dL (milligrams per deciliter)<strong>Blood</strong> Insulin is measured in pmol / L (picomole per liter)8. On your own, draw two graphs-- one showing Maria’s glucose and insulinlevels vs. time, and the second showing Laura’s glucose and insulin levels vs.time. After all individuals have completed drawing graphs, compare them withyour group members. (Use a separate piece of paper if you choose)Note to instructors: If time is short, you can provide suggestions or evenextra page that shows a blank graph but with labeled axes. It’s best,however, is students have to work together to generate their own graphson an empty page so as to figure out what type of graph to use, and in thiscase, how to put both blood glucose and blood insulin on the same graph.Graphs will vary in many ways. Many students will have difficulty with theunits required on the y-axis: glucose (mg/dL) and insulin (pmol / L) usedifferent units and can be accommodated by labeling the y-axis on theright and left sides of the graph. 5
9. Which individual above (Maria or Laura) had the greater pancreatic responseto the OGTT? How do you know?Maria had a greater pancreatic response. The data in Model 2 showMaria’s levels of insulin to be higher than Laura’s.10. On your own, write a grammatically correct sentence describing therelationship between blood glucose and blood insulin levels. After each individualis finished, compare sentences and, as a group, decide on the most accuratesentence.Example response (student answers will vary): As blood glucose rises,the body responds by releasing insulin. Insulin enters the blood andcauses blood glucose levels to fall. Insulin causes a reduction in bloodglucose levels.Note – student response should not make reference to “how” insulinfunctions. That level of detail is not present in the model.11. Diabetics are often required to monitor their blood glucose levels to determineif/when they require a shot of insulin. Under what conditions should diabeticindividuals give themselves a shot of insulin?Example response (student answers will vary): A shot ofinsulin may be needed if blood glucose levels are toohigh (hyperglycemia), or if a diabetic is about to consumefoods that have a high glycemic index, e.g., have a highamount of simple sugars. 6
Model 3: Glycemic index and changes in blood glucoseThree college students (Carter, Linden, and Miriam) have their blood glucoselevels measured for six hours. All three recorded what they ate for breakfast at7:30 am, but did not record any other intake of food.Carter’s Breakfast: Orange juice, high fiber regular oatmeal, and abanana.Linden’s breakfast: Sugar soda pop, Chocolate Frosted Sugar bombs, andtwo cups of coffee (with sugar).Miriam’s breakfast: Bacon, eggs, and two cups of black coffee.Student <strong>Blood</strong> <strong>Glucose</strong> LevelsTime of Day 7 AM 8 AM 9AM 10 AM 11 AM Noon 1 PMCarter<strong>Blood</strong> <strong>Glucose</strong> 70 140 140 80 80 80 115(mg/dL)Linden<strong>Blood</strong> <strong>Glucose</strong> 70 170 55 170 55 160 55(mg/dL)Miriam<strong>Blood</strong> <strong>Glucose</strong>(mg/dL)70 80 80 80 70 70 90QUESTIONS:12. Construct one graph that documents how each student’s blood glucoselevels changed over the time period shown. (You may choose to use a separatepiece of paper)Carter’s line should show a gradual rise and fall, with a slight rise at theend.Linden’s line should show rapid rises and falls – three peaks.Miriam’s line does not rise past 100 .. pretty flat. 7
13. How many times do you think each person ate during the 6-hour span? Howdo you know?Carter – probably twice.Linden – probably three times.Miriam – probably twice.Important: look for increases in blood sugar levels.If a food with no sugaris consumed, the blood sugar levels might not rise.14. What types of foods are associated with the most rapid changes in bloodglucose levels?Foods that contain large quantities of simple sugars, such as fructose.15: Glycemic Index (GI) is a numeric scale (ranging from 1 to 100) that serves asan indicator of how rapidly a food causes an increase in blood glucose levels.Carbohydrates that cause a rapid increase in blood glucose have high numbers,whereas carbohydrates that cause a gradual increase in blood glucose havelower numbers.a) Using the term “glycemic index,” describe Carter, Linden, and Miriam’sbreakfasts.Carter: Consumed foods that had a “medium” glycemic index numbercompared to the other two.Linden: Consumed foods that had a “high” glycemic index numbercompared to the other two.Miriam: Consumed foods with the lowest glycemic index numbercompared to the other two.b) Which breakfast had the highest glycemic index?Linden’s breakfastc) Which breakfast had the lowest glycemic index?Miriam breakfast16. Using the term “glycemic index,” write one or two sentences that describethe components of a healthy breakfast; one that would not cause a rapid changein blood glucose.A healthy breakfast should involve foods with a moderate glycemic index,which would lead to a gradual increase in blood glucose levels. 8
CHALLENGE QUESTIONS:17. It is sometimes very dangerous to give someone a shot of insulin. Underwhat conditions should insulin never be administered?Example response (student answers will vary): A shot of insulin couldcause unconsciousness or even death if given to someone who is alreadyhypoglycemic.18. Explain how a disease of the pancreas might cause problems with glucosemetabolism:Example response (student answers will vary): The inability of thepancreas to release insulin would lead to problems with glucoseregulation. More specifically, blood sugar levels would rise after eating,and would be very slow to return (or would not return at all) to regularlevels.The next question will address the condition of a hyperactive pancreas,resulting in lower than desired blood glucose levels.19. Using your knowledge of medical terminology, define the termhyperinsulinemic hypoglycemia. What might cause this condition?Example response (student answers will vary): Too much insulin leadingto low levels of blood glucose. One disease that could cause thiscondition is cancer of the pancreas.20. Many people have preconceptions about diabetes mellitus. Not all of themare correct. As a group, brainstorm what you think you know about diabetesmellitus. For example, what do you think causes diabetes mellitus? What are thelong-term effects of diabetes? Can diabetes kill you? If so, what is the COD(Cause of Death)?Answers will vary greatly – most like to be associated with overeatingand inactivity – genetics, etc… It is unlikely students will know much ofthe difference between Type 1 or Type 2 – and that distinction is NOTmade in this activity. 9