Orange County Basin - Metropolitan Water District of Southern ...
Orange County Basin - Metropolitan Water District of Southern ...
Orange County Basin - Metropolitan Water District of Southern ...

Create successful ePaper yourself
Turn your PDF publications into a flip-book with our unique Google optimized e-Paper software.
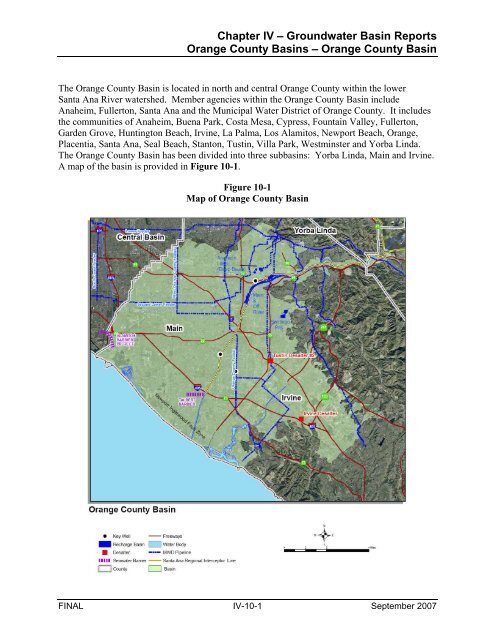
Chapter IV – Groundwater <strong>Basin</strong> Reports<br />
<strong>Orange</strong> <strong>County</strong> <strong>Basin</strong>s – <strong>Orange</strong> <strong>County</strong> <strong>Basin</strong><br />
The <strong>Orange</strong> <strong>County</strong> <strong>Basin</strong> is located in north and central <strong>Orange</strong> <strong>County</strong> within the lower<br />
Santa Ana River watershed. Member agencies within the <strong>Orange</strong> <strong>County</strong> <strong>Basin</strong> include<br />
Anaheim, Fullerton, Santa Ana and the Municipal <strong>Water</strong> <strong>District</strong> <strong>of</strong> <strong>Orange</strong> <strong>County</strong>. It includes<br />
the communities <strong>of</strong> Anaheim, Buena Park, Costa Mesa, Cypress, Fountain Valley, Fullerton,<br />
Garden Grove, Huntington Beach, Irvine, La Palma, Los Alamitos, Newport Beach, <strong>Orange</strong>,<br />
Placentia, Santa Ana, Seal Beach, Stanton, Tustin, Villa Park, Westminster and Yorba Linda.<br />
The <strong>Orange</strong> <strong>County</strong> <strong>Basin</strong> has been divided into three subbasins: Yorba Linda, Main and Irvine.<br />
A map <strong>of</strong> the basin is provided in Figure 10-1.<br />
Figure 10-1<br />
Map <strong>of</strong> <strong>Orange</strong> <strong>County</strong> <strong>Basin</strong><br />
FINAL IV-10-1 September 2007
Chapter IV – Groundwater <strong>Basin</strong> Reports<br />
<strong>Orange</strong> <strong>County</strong> <strong>Basin</strong>s<br />
BASIN CHARACTERIZATION<br />
The following section provides a physical description <strong>of</strong> the <strong>Orange</strong> <strong>County</strong> <strong>Basin</strong> including its<br />
geographic location and hydrogeologic character.<br />
<strong>Basin</strong> Producing Zones and Storage Capacity<br />
The <strong>Orange</strong> <strong>County</strong> <strong>Basin</strong> is bounded by the Coyote and Chino Hills on the north, the Santa Ana<br />
Mountains on the northeast, the San Joaquin Hills on the south, and the Pacific Ocean and the<br />
Newport-Inglewood fault zone on the southwest (OCWD, 2004). The <strong>Orange</strong> <strong>County</strong> <strong>Basin</strong> is<br />
separated from the Central <strong>Basin</strong> along Coyote Creek and the <strong>County</strong> line, although there is no<br />
physical barrier between the two basins. The Newport-Inglewood fault zone acts as a complete<br />
barrier to flow from the ocean along most <strong>of</strong> its length in <strong>Orange</strong> <strong>County</strong> except at ancient<br />
river-crossing gaps, most notably the Alamitos Gap along the Los Angeles <strong>County</strong> line and the<br />
Talbert Gap in Huntington Beach and Costa Mesa. At these two locations, permeable river<br />
deposits cross the fault barrier providing the opportunity for seawater to flow into the<br />
<strong>Orange</strong> <strong>County</strong> <strong>Basin</strong>. As discussed in more detail below, a series <strong>of</strong> injection wells are utilized<br />
to halt the seawater intrusion at these locations.<br />
As discussed above, the <strong>Orange</strong> <strong>County</strong> <strong>Basin</strong> includes three subbasins: Yorba Linda, Main and<br />
Irvine. These subbasins are managed by OCWD as a whole and are described herein for<br />
informational purposes.<br />
The Yorba Linda subbasin is located north <strong>of</strong> the Anaheim Forebay recharge area, within the<br />
cities <strong>of</strong> Yorba Linda and Placentia. It is part <strong>of</strong> the basin, but currently has little groundwater<br />
pumping due to its low transmissivity and high TDS concentrations (Mills, 1987). Groundwater<br />
from the Yorba Linda subbasin flows southward into the Main <strong>Basin</strong> since the limited<br />
groundwater production is less than the natural replenishment from the adjacent Chino Hills.<br />
The Irvine subbasin, bounded by the Santa Ana Mountains and the San Joaquin Hills, forms the<br />
southern-most portion <strong>of</strong> the basin. The Costa Mesa Freeway and Newport Boulevard<br />
approximate the subbasin’s boundary with the Main <strong>Basin</strong>. Irvine-area aquifers are thinner and<br />
contain more clay and silt deposits than aquifers in the main portion <strong>of</strong> the basin. Groundwater<br />
typically flows out <strong>of</strong> the Irvine subbasin westerly into the Main <strong>Basin</strong>.<br />
The hydrogeology <strong>of</strong> the <strong>Orange</strong> <strong>County</strong> <strong>Basin</strong> is characterized by a deep structural alluvial<br />
basin containing a thick accumulation <strong>of</strong> interbedded sand, silt and clay. Table 10-1 provides a<br />
summary <strong>of</strong> hydrogeologic parameters for the <strong>Orange</strong> <strong>County</strong> <strong>Basin</strong>. The <strong>Orange</strong> <strong>County</strong> <strong>Basin</strong><br />
contains three defined aquifer units: the Upper, Principal (or Middle) and Lower aquifers. In the<br />
northern portions <strong>of</strong> the <strong>Orange</strong> <strong>County</strong> <strong>Basin</strong>, referred to as the Forebay area, many <strong>of</strong> these<br />
aquifers are merged and allow for direct recharge into the deeper aquifers. In the area referred to<br />
as the Pressure Area, these aquifers are less hydraulically connected and create confined aquifer<br />
conditions. A conceptual geologic cross section across the <strong>Orange</strong> <strong>County</strong> <strong>Basin</strong> is provided in<br />
Figure 10-2.<br />
FINAL IV-10-2 September 2007
Chapter IV – Groundwater <strong>Basin</strong> Reports<br />
<strong>Orange</strong> <strong>County</strong> <strong>Basin</strong><br />
Table 10-1<br />
Summary <strong>of</strong> Hydrogeologic Parameters <strong>of</strong> <strong>Orange</strong> <strong>County</strong> <strong>Basin</strong><br />
Parameter Description<br />
Structure<br />
Aquifer(s)<br />
Depth <strong>of</strong> groundwater basin > 2,000 feet<br />
Forebay areas (unconfined)<br />
Pressure areas (confined)<br />
• Upper aquifer system<br />
• Principal aquifer system<br />
• Lower aquifer system<br />
Depth <strong>of</strong> producing zones or screen intervals 200 to ~2,000 feet<br />
Thickness <strong>of</strong> water-bearing units<br />
Yield and Storage<br />
Natural Safe Yield<br />
(Natural Incidental Recharge) 1<br />
<strong>Basin</strong> Production Percentage<br />
(2005/06) 2<br />
Total Storage<br />
Upper aquifer: Up to 300 feet<br />
(average ~200 feet)<br />
Principal aquifer: 500 to > 1,600 feet (average<br />
~ 1,000 feet)<br />
Lower aquifer: ~300 to 1,000 feet<br />
70,500 AFY<br />
64 percent<br />
Upper aquifer: 5 million AF<br />
Principal aquifer: 32.9 million AF<br />
Lower aquifer: 25.1 million AF<br />
Aquitards: 3 million AF<br />
66 million AF<br />
Unused Storage Space Data not available<br />
Portion <strong>of</strong> Unused Storage Space Available<br />
for Storage (June 2006) 3<br />
100,000 AF (reserved for wet year stormwater)<br />
35,000 AF<br />
135,000 AF total available<br />
Source: DWR, 2004; OCWD, 2004<br />
1. Natural safe yield includes infiltrated precipitation, irrigation, and other incidental recharge. Referred<br />
incidental recharge by OCWD.<br />
2. <strong>Basin</strong> Production Percentage (BPP) is percentage <strong>of</strong> groundwater production out <strong>of</strong> the total water<br />
demand. BPP is set annually by OCWD. Historically, BPP has ranged from 64 to 80 percent.<br />
3. Use <strong>of</strong> storage space is subject to approval by OCWD consistent with objectives for basin management<br />
FINAL IV-10-3 September 2007
Chapter IV – Groundwater <strong>Basin</strong> Reports<br />
<strong>Orange</strong> <strong>County</strong> <strong>Basin</strong>s<br />
SOUTHWEST<br />
ELEVATION (FEET MEAN SEA LEVEL)<br />
200<br />
-200<br />
-400<br />
-600<br />
-800<br />
-1000<br />
-1200<br />
-1400<br />
-1600<br />
-1800<br />
-2000<br />
-2200<br />
-2400<br />
-2600<br />
-2800<br />
-3000<br />
A<br />
PACIFIC OCEAN<br />
0<br />
Figure 10-2<br />
Hydrogeologic Cross Section <strong>of</strong> the <strong>Orange</strong> <strong>County</strong> <strong>Basin</strong><br />
HUNTINGTON BEACH<br />
Talbert<br />
Barrier<br />
NEWPORT-INGLEWOOD<br />
FAULT ZONE<br />
FOUNTAIN VALLEY<br />
SANTA ANA<br />
EXPLANATION<br />
SILTS, CLAYS<br />
BURRIS PIT<br />
PERCOLATION BASIN<br />
SANDS, GRAVELS<br />
COLORED WATER<br />
CONSOLIDATED,<br />
NON-WATERBEARING<br />
FORMATIONS<br />
WATER TABLE<br />
OCWD AQUIFER RECHARGE AREA<br />
ANAHEIM<br />
CONROCK AND WARNER<br />
PERCOLATION BASINS<br />
NORTHEAST<br />
FINAL IV-10-4 September 2007<br />
SEA WATER<br />
A<br />
A'<br />
A'<br />
SANTA ANA RIVER<br />
The Upper aquifer system, which averages approximately 200 feet in thickness, consists <strong>of</strong><br />
alluvial sediments and includes the Talbert aquifer and recent alluvium. The total storage <strong>of</strong> this<br />
aquifer system is estimated to be approximately five million AF (OCWD, 2004). However, only<br />
about five percent <strong>of</strong> the total basin production comes from this aquifer because <strong>of</strong> lower<br />
production rates and poorer water quality than the underlying aquifers.<br />
The Principal aquifer system averages approximately 1,000 feet in thickness and is the primary<br />
source <strong>of</strong> production in the <strong>Orange</strong> <strong>County</strong> <strong>Basin</strong>. The principal aquifers are located<br />
approximately 200 to 1,200 feet below ground surface (fbgs). This aquifer is correlative with<br />
portions <strong>of</strong> the Lakewood Formation and the San Pedro Formation <strong>of</strong> the Central and West Coast<br />
<strong>Basin</strong>s in Los Angeles <strong>County</strong>. <strong>Orange</strong> <strong>County</strong> <strong>Water</strong> <strong>District</strong> (OCWD) estimates the total<br />
storage in this aquifer system is approximately 32.9 million AF (OCWD, 2004).<br />
Deeper aquifers below the principal aquifer system comprise the Lower aquifer system (DWR,<br />
2004), with a thickness <strong>of</strong> about 300 to 1,000 feet. Few wells produce from this aquifer because<br />
<strong>of</strong> the increased depth and the potential presence <strong>of</strong> colored water.<br />
The total estimated volume <strong>of</strong> fresh groundwater capable <strong>of</strong> being stored in the <strong>Orange</strong> <strong>County</strong><br />
<strong>Basin</strong> when it is completely full is estimated to be approximately 66 MAF by OCWD (2004).<br />
Based upon review <strong>of</strong> historical data, OCWD has established basin water contour levels, which<br />
represent a full basin. Volume in storage indicates how much storage space is available for use<br />
(defined as accumulated overdraft) within the <strong>Orange</strong> <strong>County</strong> <strong>Basin</strong>. OCWD estimates that<br />
between 400,000 and 500,000 AF <strong>of</strong> the total basin storage is actually usable (OCWD, 2004) in<br />
terms <strong>of</strong> emptying and filling operations. If groundwater levels are allowed to drop below the
Chapter IV – Groundwater <strong>Basin</strong> Reports<br />
<strong>Orange</strong> <strong>County</strong> <strong>Basin</strong><br />
lower limit (i.e. >400,000 AF <strong>of</strong> accumulated overdraft) there is an increased potential for<br />
seawater intrusion, increased potential for colored water upwelling, and increased potential for<br />
subsidence. However, the basin can be operated on a short-term emergency basis with an<br />
accumulated overdraft up to approximately 500,000 AF without causing irreversible seawater<br />
intrusion or land subsidence (OCWD, 2004 and 2006). If groundwater levels are allowed to rise<br />
to near-full conditions, outflow to the Central <strong>Basin</strong> can increase, local near-surface groundwater<br />
levels may occur, and there would be a decreased potential for capturing large amounts <strong>of</strong><br />
recharge if it were to become available. Historical data are shown in Figure 10-3. As shown in<br />
Figure 10-3, the accumulated overdraft increased more than 100,000 AF between 2000 and 2004<br />
to more than 400,000 AF as a result <strong>of</strong> a six-year drought on the Santa Ana River. Due to recent<br />
heavy rains and basin management activities, as <strong>of</strong> June 2006, the accumulated overdraft or<br />
available storage space was 135,000 AF. Of this amount, 100,000 AF is kept in reserve for<br />
capture <strong>of</strong> stormwater run<strong>of</strong>f during a potentially wet year and 35,000 AF would be available for<br />
other storage purposes. It is also important to note that storage varies substantially from year to<br />
year in the <strong>Orange</strong> <strong>County</strong> <strong>Basin</strong>.<br />
Available Storage Space (AF)<br />
0<br />
100,000<br />
200,000<br />
300,000<br />
400,000<br />
500,000<br />
600,000<br />
Figure 10-3<br />
Historical Available Storage Space in <strong>Orange</strong> <strong>County</strong> <strong>Basin</strong><br />
1986<br />
1985<br />
1988<br />
1987<br />
Source: OCWD 2004, 2005<br />
Lower limit (500,000 AF) <strong>of</strong> accumulated overdraft<br />
1990<br />
1989<br />
1992<br />
1991<br />
1994<br />
1993<br />
1996<br />
1995<br />
Fiscal Year<br />
Safe Yield/Long-Term Balance <strong>of</strong> Recharge and Discharge<br />
1998<br />
1997<br />
2000<br />
1999<br />
2002<br />
2001<br />
2004<br />
2003<br />
Recharge to the <strong>Orange</strong> <strong>County</strong> <strong>Basin</strong> is primarily by direct percolation <strong>of</strong> Santa Ana River<br />
water through highly permeable sands and gravels within the forebay areas. Recharge also<br />
occurs as a result <strong>of</strong> injection through wells at the Talbert and Alamitos seawater barriers, use <strong>of</strong><br />
imported water for groundwater replenishment, wastewater reclamation and other water<br />
conservation practices. The natural yield <strong>of</strong> the <strong>Orange</strong> <strong>County</strong> <strong>Basin</strong>, which includes infiltrated<br />
precipitation, irrigation, and other native incidental recharge, has been estimated to be<br />
FINAL IV-10-5 September 2007<br />
2005
Chapter IV – Groundwater <strong>Basin</strong> Reports<br />
<strong>Orange</strong> <strong>County</strong> <strong>Basin</strong>s<br />
approximately 70,500 AFY (OCWD, 2004). Active recharge in the <strong>Orange</strong> <strong>County</strong> <strong>Basin</strong><br />
significantly increases the yield <strong>of</strong> the basin. For example, total recharge amounts (inclusive <strong>of</strong><br />
natural incidental recharge and all active recharge) to the basin can vary between 300,000 AFY<br />
to 400,000 AFY and change annually depending upon the hydrology <strong>of</strong> the Santa Ana River, the<br />
amount <strong>of</strong> imported <strong>Metropolitan</strong> replenishment water that is purchased, the amount <strong>of</strong> water<br />
injected into the seawater barriers, and other incidental recharge. It is important to note that the<br />
<strong>Orange</strong> <strong>County</strong> <strong>Basin</strong> is not managed on a safe yield basis every year, but rather, as discussed<br />
below, is managed to maintain basin balance over the long-term.<br />
Precipitation falling on the watershed contributing recharge to the <strong>Orange</strong> <strong>County</strong> <strong>Basin</strong> varies<br />
between the low lands and the flanking mountains depending on elevation. As measured at the<br />
Santa Ana Fire Station, approximately in the center <strong>of</strong> the basin, the average yearly precipitation<br />
over the 1985 through 2005 period is about 14 inches. Figure 10-4 provides the historical<br />
precipitation data from the Santa Ana Fire Station over that period.<br />
Precipitation (inches)<br />
35<br />
30<br />
25<br />
20<br />
15<br />
10<br />
5<br />
0<br />
1985/86<br />
1986/87<br />
Figure 10-4<br />
Historical Precipitation in the <strong>Orange</strong> <strong>County</strong> <strong>Basin</strong><br />
Average = 14.0 inches<br />
1987/88<br />
1988/89<br />
1989/90<br />
1990/91<br />
1991/92<br />
UC IPM, 2006 (SantaAna.C Station)<br />
1992/93<br />
1993/94<br />
1994/95<br />
FINAL IV-10-6 September 2007<br />
1995/96<br />
Fiscal Year<br />
Groundwater pumping is the primary outflow from the basin. Groundwater production from the<br />
basin is managed by OCWD. As described below, the amount <strong>of</strong> groundwater producers can use<br />
is set annually and changes depending upon the management goals at that time. In fiscal year<br />
2006/07, pumping is expected to be about 330,000 AFY. Annual pumping is expected to<br />
increase with the development <strong>of</strong> the Groundwater Replenishment System to 380,000 to<br />
400,000 AFY.<br />
1996/97<br />
1997/98<br />
1998/99<br />
1999/00<br />
2000/01<br />
2001/02<br />
2002/03<br />
2003/04<br />
2004/05
GROUNDWATER MANAGEMENT<br />
Chapter IV – Groundwater <strong>Basin</strong> Reports<br />
<strong>Orange</strong> <strong>County</strong> <strong>Basin</strong><br />
The following section describes how the <strong>Orange</strong> <strong>County</strong> <strong>Basin</strong> is currently managed. It includes<br />
a discussion <strong>of</strong> the governing structure within the basin and relationships with other adjoining<br />
basins.<br />
<strong>Basin</strong> Management<br />
The <strong>Orange</strong> <strong>County</strong> <strong>Basin</strong> is a managed basin. OCWD has managed the <strong>Orange</strong> <strong>County</strong> <strong>Basin</strong><br />
since 1933 pursuant to a special act <strong>of</strong> the State legislature (West’s Annotated California Codes,<br />
<strong>Water</strong> Code Appendix Chapter 50 as amended and Deering’s California Codes Annotated <strong>Water</strong><br />
Uncodified Acts.Act 5683). OCWD has managed the basin based upon the principle <strong>of</strong> seeking<br />
to increase supply rather than restricting access and to provide for uniformity <strong>of</strong> cost.<br />
Table 10-2 provides a list <strong>of</strong> other agencies that OCWD may interact with in carrying out its<br />
mission.<br />
The basin groundwater pumping is not operated on a safe-yield basis each year. Rather, the goal<br />
is to maintain an approximate balance over a period <strong>of</strong> several years. The amount <strong>of</strong> production<br />
from the basin is governed through financial incentives based on establishing an annual <strong>Basin</strong><br />
Production Percentage (BPP), which is the percentage <strong>of</strong> groundwater production out <strong>of</strong> the total<br />
water demand for the <strong>Orange</strong> <strong>County</strong> <strong>Basin</strong>. Pumping up to the BPP is charged a fee on a<br />
per AF basis, i.e., the Replenishment Assessment (RA). Groundwater production above the BPP<br />
is charged the RA plus the <strong>Basin</strong> Equity Assessment (BEA). The BEA is typically set so that the<br />
cost <strong>of</strong> groundwater production above the BPP is similar to the cost <strong>of</strong> purchasing alternative<br />
supplies. Pumping agencies do not accrue individual storage rights if they pump less than the<br />
BPP, which is a major difference compared to most adjudicated basins. Additionally, agencies<br />
cannot transfer groundwater-pumping rights.<br />
The basin is managed to provide approximately three years <strong>of</strong> drought supplies for the region.<br />
The accumulated overdraft target <strong>of</strong> 100,000 AF was in part set to meet this goal. If Santa Ana<br />
River supplies decline and/or <strong>Metropolitan</strong> replenishment water is not available, OCWD can<br />
generally sustain high pumping rates by overdrafting the groundwater basin for a three-year<br />
period down to an accumulated overdraft <strong>of</strong> 400,000 to 500,000 AF. The 100,000 AF target also<br />
provides sufficient storage space to capture excess water supplies that become available during<br />
very wet winters.<br />
Figure 10-5 shows the historical BPP between 1985/86 and 2004/05. During this period, the<br />
BPP ranged from 66 percent to 80 percent. For the last 6 years <strong>of</strong> this period, Santa Ana River<br />
flows were significantly less than average. For the first four years <strong>of</strong> the drought (1998/99<br />
through 2002/03) the BPP was maintained at 75 percent, which allowed for normal pumping<br />
levels. However, groundwater storage was reduced by approximately 230,000 AF during this<br />
period. Due to the continued drought conditions and seawater intrusion concerns, the BPP was<br />
reduced in fiscal year 2003/04 to 66 percent for two years and then lowered to 64 percent in<br />
fiscal year 2005/06. This lower BPP and heavy rainfall over the past few years has refilled the<br />
basin. As such, the BPP was raised to 69 percent for fiscal year 2006/07 and will be raised to<br />
74 percent in fiscal year 2007/08.<br />
FINAL IV-10-7 September 2007
Chapter IV – Groundwater <strong>Basin</strong> Reports<br />
<strong>Orange</strong> <strong>County</strong> <strong>Basin</strong>s<br />
Table 10-2<br />
Summary <strong>of</strong> <strong>Water</strong>-Related Agencies in the <strong>Orange</strong> <strong>County</strong> <strong>Basin</strong><br />
Agency Role<br />
<strong>Orange</strong> <strong>County</strong> <strong>Water</strong> <strong>District</strong><br />
Santa Ana <strong>Water</strong> Project Authority (SAWPA)<br />
Municipal <strong>Water</strong> <strong>District</strong> <strong>of</strong> <strong>Orange</strong> <strong>County</strong><br />
(MWDOC)<br />
<strong>Orange</strong> <strong>County</strong> Sanitation <strong>District</strong><br />
Santa Ana River <strong>Water</strong>master<br />
<strong>Orange</strong> <strong>County</strong> Resources Development and<br />
Management Department<br />
Los Angeles <strong>County</strong> Department <strong>of</strong> Public<br />
Works (LACDPW)<br />
<strong>Basin</strong> Manager.<br />
Establishes and assesses production fees<br />
Monitors water levels and quality.<br />
Oversees recharge and seawater barriers<br />
operations.<br />
Joint Powers Authority established to plan<br />
and build facilities to protect the water quality<br />
<strong>of</strong> the Santa Ana River <strong>Water</strong>shed.<br />
Provides imported water for direct recharge.<br />
Regional planning agency.<br />
Provides recycled water for injection at<br />
Talbert Barrier and spreading at the forebay<br />
Court-appointed oversight <strong>of</strong> 1969 Judgment<br />
governing Santa Ana River flows<br />
Operation <strong>of</strong> Placentia and Raymond recharge<br />
basins<br />
Coordinates operation <strong>of</strong> Santa Ana River<br />
Operation <strong>of</strong> Alamitos Barrier Project<br />
United States Army Corps <strong>of</strong> Engineers Operation <strong>of</strong> Prado Dam<br />
California Regional <strong>Water</strong> Quality Control<br />
Board – Santa Ana Region (Regional Board)<br />
Sets and enforces <strong>Basin</strong> <strong>Water</strong> Quality<br />
Objectives.<br />
Issues permits for discharges to Santa Ana<br />
River.<br />
Oversees injection operations using recycled<br />
water.<br />
FINAL IV-10-8 September 2007
BPP (%)<br />
85%<br />
80%<br />
75%<br />
70%<br />
65%<br />
60%<br />
Chapter IV – Groundwater <strong>Basin</strong> Reports<br />
<strong>Orange</strong> <strong>County</strong> <strong>Basin</strong><br />
Figure 10-5<br />
Historical <strong>Basin</strong> Production Percentage in <strong>Orange</strong> <strong>County</strong> <strong>Basin</strong><br />
1985/86<br />
1986/87<br />
1987/88<br />
1988/89<br />
1989/90<br />
Interactions with Adjoining <strong>Basin</strong>s<br />
1990/91<br />
1991/92<br />
1992/93<br />
1993/94<br />
FINAL IV-10-9 September 2007<br />
1994/95<br />
1995/96<br />
Fiscal Year<br />
The <strong>Orange</strong> <strong>County</strong> <strong>Basin</strong> is downstream <strong>of</strong> Prado Dam in the Lower Santa Ana River area. On<br />
April 17, 1969, the <strong>Orange</strong> <strong>County</strong> Superior Court entered a Stipulated Judgment in<br />
Case No. 117628 involving the <strong>Orange</strong> <strong>County</strong> <strong>Water</strong> <strong>District</strong> vs. City <strong>of</strong> City <strong>of</strong> Chino et al.<br />
The Judgment, which became effective October 1, 1970, contains a declaration <strong>of</strong> rights <strong>of</strong> the<br />
entities in the lower Santa Ana River area (i.e. OCWD) versus those in the upper Santa Ana<br />
River area (i.e. San Bernardino Valley Municipal <strong>Water</strong> <strong>District</strong>, or SBVMWD, Chino <strong>Basin</strong><br />
MWD, now called IEUA, and Western MWD). The Judgment is administered by the Santa Ana<br />
River <strong>Water</strong>master, a committee <strong>of</strong> five members (one each from SBVMWD, IEUA and<br />
Western MWD and two from OCWD). Under this Judgment, purveyors upstream <strong>of</strong> Prado Dam<br />
have the right to use all surface and groundwater supplies originating above Prado Dam without<br />
interference from water purveyors downstream <strong>of</strong> Prado Dam, provided that the average adjusted<br />
base flow at Prado Dam is at least 42,000 AFY. Baseflows have ranged from approximately<br />
38,000 AFY in 1970 to approximately 170,000 AFY in 2002. (Santa Ana River <strong>Water</strong>master,<br />
2003). SBVMWD has an obligation to ensure an average annual adjusted base flow <strong>of</strong><br />
15,250 AFY at Riverside Narrows. IEUA and Western MWD have a joint obligation to ensure<br />
average annual adjusted base flow <strong>of</strong> 42,000 AFY at Prado Dam. OCWD is allocated all other<br />
flows reaching Prado Dam in addition to the average annual adjusted base flow <strong>of</strong> 42,000 AFY.<br />
Further, SBVMWD, IEUA and Western MWD are prohibited from exporting water from the<br />
lower area to the upper area while OCWD is prohibited from exporting water or causing water to<br />
flow from the upper area to the lower area (Santa Ana River <strong>Water</strong>master, 2003).<br />
1996/97<br />
1997/98<br />
1998/99<br />
1999/00<br />
2000/01<br />
2001/02<br />
2002/03<br />
2003/04<br />
2004/05
Chapter IV – Groundwater <strong>Basin</strong> Reports<br />
<strong>Orange</strong> <strong>County</strong> <strong>Basin</strong>s<br />
Approximately 1,000 to 14,000 AFY underflow or outflow from the <strong>Orange</strong> <strong>County</strong> <strong>Basin</strong> can<br />
occur northwestward across political boundaries into the Central <strong>Basin</strong> in Los Angeles <strong>County</strong><br />
depending on the groundwater elevations on either side <strong>of</strong> the political line. Modeling by<br />
OCWD indicated that, assuming groundwater elevations in the Central <strong>Basin</strong> remain constant,<br />
underflow to Los Angeles <strong>County</strong> increases approximately 7,500 AFY for every 100,000 AF <strong>of</strong><br />
increased groundwater storage in the <strong>Orange</strong> <strong>County</strong> <strong>Basin</strong>.<br />
OCWD has purchased water from the area <strong>of</strong> high groundwater in Bunker Hill <strong>Basin</strong> from<br />
San Bernardino Valley Municipal <strong>Water</strong> <strong>District</strong>. This water is spread in the recharge facilities<br />
along the Santa Ana River. A total <strong>of</strong> 7,084 AF <strong>of</strong> this water has been recharged since 2000.<br />
OCWD also purchases water from the Arlington Desalter in the Arlington <strong>Basin</strong> for groundwater<br />
recharge in the <strong>Orange</strong> <strong>County</strong> <strong>Basin</strong>. This water is spread in the recharge facilities along the<br />
Santa Ana River. An average <strong>of</strong> approximately 3,800 AFY has been recharged since the<br />
Arlington Desalter came online in 1990. As demands increase in the Riverside and Norco areas,<br />
this supply source is likely to decline in the future. Brine from the Arlington Desalter is also<br />
delivered to the <strong>Orange</strong> <strong>County</strong> Sanitation <strong>District</strong> treatment facilities via the Santa Ana<br />
Regional Interceptor (SARI) line for treatment and discharge to the ocean.<br />
OCWD has worked extensively with the United States Army Corps <strong>of</strong> Engineers (USACE)<br />
regarding the operations <strong>of</strong> Prado Dam to conserve Santa Ana River storm flows. During the<br />
winter storm season, the USACE will store water up to elevation 498 feet MSL, which creates a<br />
pool <strong>of</strong> approximately 13,000 AF. Beginning on March 15 th <strong>of</strong> every year the USACE will store<br />
water up to elevation 505 feet MSL, which creates a pool <strong>of</strong> approximately 26,000 AF. The<br />
OCWD coordinates its recharge operations to empty these pools as quickly as possible without<br />
losing water to the Pacific Ocean to create storage space for future storms.<br />
WATER SUPPLY FACILITIES AND OPERATIONS<br />
The following section describes the water supply facilities within the <strong>Orange</strong> <strong>County</strong> <strong>Basin</strong>.<br />
Facilities include nearly 500 production wells, 800 monitoring wells, more than 1,000 acres <strong>of</strong><br />
recharge ponds in the Forebay areas, two seawater intrusion barriers, three desalters, the<br />
Groundwater Replenishment System, the Prado wetlands and Prado Dam. OCWD has<br />
constructed numerous projects to support increases in basin pumping. These investments have<br />
resulted in a doubling <strong>of</strong> the basin’s yield over the past 30 years.<br />
Active Production Wells<br />
Groundwater extraction from the <strong>Orange</strong> <strong>County</strong> <strong>Basin</strong> occurs from nearly 500 production wells.<br />
Average production in the <strong>Orange</strong> <strong>County</strong> <strong>Basin</strong> for the past 20 years was nearly 294,000 AFY.<br />
Approximately 97 percent <strong>of</strong> the production is municipal water supplied through approximately<br />
200 large capacity wells. For example, groundwater production (excluding <strong>Metropolitan</strong> in-lieu<br />
supplies received) totaled 244,370 AF for the 2004/05 water year; <strong>of</strong> that amount 240,978 AF<br />
was for non-irrigation use. These data are summarized in Table 10-3.<br />
FINAL IV-10-10 September 2007
Category<br />
Non-Irrigation Wells<br />
(large and small<br />
capacity)<br />
Chapter IV – Groundwater <strong>Basin</strong> Reports<br />
<strong>Orange</strong> <strong>County</strong> <strong>Basin</strong><br />
Table 10-3<br />
Summary <strong>of</strong> Production Wells in the <strong>Orange</strong> <strong>County</strong> <strong>Basin</strong><br />
Number <strong>of</strong><br />
Active Wells<br />
~300<br />
Irrigation Wells ~200<br />
Total ~500<br />
Estimated<br />
Production<br />
Capacity 1<br />
(AFY)<br />
420,000 to<br />
440,000<br />
Source: OCWD, 2005 and Herndon, 2006<br />
1. Based on analysis and estimates by MWDOC<br />
2. Excludes <strong>Metropolitan</strong> long-term in-lieu replenishment water deliveries<br />
Average<br />
Production<br />
1985/86-2004/05 2<br />
(AFY)<br />
293,645<br />
Well<br />
Operation<br />
Cost<br />
($/AF)<br />
O&M<br />
$65<br />
Energy<br />
$56<br />
Total<br />
$111<br />
Figure 10-6 shows historical production in the <strong>Orange</strong> <strong>County</strong> <strong>Basin</strong>. In the five-year period<br />
between 2000/01 and 2004/05, groundwater production declined from about 350,000 AFY in<br />
fiscal year 2000/01 to less than 245,000 AFY because, as discussed above, the BPP was adjusted<br />
to increase the amount <strong>of</strong> water stored in the basin (see Figure 10-5).<br />
<strong>Orange</strong> <strong>County</strong> <strong>Basin</strong> producers participate in a variety <strong>of</strong> in-lieu groundwater storage programs<br />
whereby they receive imported water from <strong>Metropolitan</strong> in lieu <strong>of</strong> pumping groundwater.<br />
Historically, these programs have included <strong>Metropolitan</strong>’s, short-term shift (seasonal), cyclic<br />
water, replenishment water and conjunctive use programs. The long-term in-lieu storage (cyclic,<br />
replenishment or conjunctive use programs) amounts are included in Figure 10-5. Short-term<br />
shift totals, since they are seasonal in nature, are not shown in this figure. Between fiscal years<br />
1985/86 and 2004/05, on average, about 28,000 AFY was stored via long-term in-lieu. These<br />
and other storage programs are discussed in more detail below.<br />
Other Production<br />
The primary groundwater production in the <strong>Orange</strong> <strong>County</strong> <strong>Basin</strong>, other than municipal usage, is<br />
for agricultural irrigation as summarized in Table 10-3. The volume <strong>of</strong> agricultural production<br />
has been steadily declining with increasing urban development <strong>of</strong> agricultural lands.<br />
FINAL IV-10-11 September 2007
Chapter IV – Groundwater <strong>Basin</strong> Reports<br />
<strong>Orange</strong> <strong>County</strong> <strong>Basin</strong>s<br />
ASR Wells<br />
There currently are no ASR wells in the <strong>Orange</strong> <strong>County</strong> <strong>Basin</strong>.<br />
Production (AFY)<br />
500,000<br />
450,000<br />
400,000<br />
350,000<br />
300,000<br />
250,000<br />
200,000<br />
150,000<br />
100,000<br />
50,000<br />
0<br />
Figure 10-6<br />
Historical Groundwater Production in the <strong>Orange</strong> <strong>County</strong> <strong>Basin</strong><br />
1986/87<br />
1985/86<br />
1988/89<br />
1987/88<br />
Source: OCWD 2004, 2006<br />
Spreading <strong>Basin</strong>s<br />
Average Production = 293,600 AFY<br />
1990/91<br />
1989/90<br />
Production In-lieu Program<br />
1992/93<br />
1991/92<br />
1994/95<br />
1993/94<br />
1996/97<br />
1995/96<br />
FiscalYear<br />
1998/99<br />
1997/98<br />
2000/01<br />
1999/00<br />
2002/03<br />
2001/02<br />
2004/05<br />
2003/04<br />
The OCWD currently owns and operates more than 1,000 acres <strong>of</strong> ponds in and adjacent to the<br />
Santa Ana River and Santiago Creek, as shown on Figure 10-1. Table 10-4 provides details <strong>of</strong><br />
the recharge basins size and spreading capacity, which can vary significantly depending upon<br />
their cleanliness. Over a few months, the bottom <strong>of</strong> the recharge basins can become clogged<br />
with fine silts, which greatly diminishes their spreading capacity. These facilities currently<br />
provide for the infiltration <strong>of</strong> approximately 250,000 AFY (OCWD, 2004). <strong>Water</strong> sources used<br />
for recharge include Santa Ana River baseflow and stormflow, Santiago Creek flows, imported<br />
water from <strong>Metropolitan</strong> and from the upper Santa Ana River <strong>Water</strong>shed, and previously treated<br />
water from OCWD’s <strong>Water</strong> Factory 21 and now the Groundwater Replenishment (GWR)<br />
System. Figure 10-7 shows historical groundwater recharge in the <strong>Orange</strong> <strong>County</strong> <strong>Basin</strong>.<br />
OCWD spread an average <strong>of</strong> approximately 217,000 AFY between fiscal years 1985/86 and<br />
2004/05.<br />
Wetlands<br />
OCWD owns 1,400 acres <strong>of</strong> land behind Prado Dam. Approximately 400 acres have been<br />
developed into wetlands. About 50 percent <strong>of</strong> the Santa Ana River base flows (up to 120 cfs) are<br />
diverted through the wetlands where they receive natural treatment that significantly reduces<br />
FINAL IV-10-12 September 2007
Chapter IV – Groundwater <strong>Basin</strong> Reports<br />
<strong>Orange</strong> <strong>County</strong> <strong>Basin</strong><br />
nitrate concentrations. These wetlands provide a significant water quality benefit to the<br />
<strong>Orange</strong> <strong>County</strong> <strong>Basin</strong>.<br />
Recharge <strong>Basin</strong>/System<br />
Table 10-4<br />
Summary <strong>of</strong> Spreading <strong>Basin</strong>s in the <strong>Orange</strong> <strong>County</strong> <strong>Basin</strong><br />
Area<br />
(acres)<br />
Recharge<br />
Capacity<br />
(cfs) 1<br />
Main Santa Ana River 245 80 to 130<br />
Off-River 126 15 to 40<br />
Deep <strong>Basin</strong> 285 90 to 390<br />
Burris Pits/ Santiago<br />
<strong>Basin</strong><br />
Total 1,034<br />
378 110 to 220<br />
313<br />
average 3<br />
Source water<br />
Run<strong>of</strong>f 2<br />
Imported<br />
Run<strong>of</strong>f 2<br />
Imported<br />
Run<strong>of</strong>f 2<br />
Imported<br />
Run<strong>of</strong>f 2<br />
Imported<br />
Owner<br />
OCWD<br />
OCWD<br />
OCWD and OC<br />
Resources Development<br />
and Management<br />
Department<br />
OCWD<br />
-- --<br />
Source: OCWD, 2004<br />
1<br />
Percolation rate range represents clogged and clean capacities<br />
2<br />
The primary source <strong>of</strong> recharge water enters the facilities from the Santa Ana River downstream <strong>of</strong> Prado<br />
Dam.<br />
3<br />
Average for period 1989 to 2005<br />
Seawater Barriers<br />
The portion <strong>of</strong> the basin within 5 miles <strong>of</strong> the coast, particularly in the geologic gaps previously<br />
discussed, is sensitive to seawater intrusion due to lower groundwater levels. To protect the<br />
fresh groundwater in the basin from seawater intrusion, OCWD injects water into the Talbert and<br />
Alamitos barriers, which are shown on Figure 10-1. Details <strong>of</strong> the barriers are provided in<br />
Table 10-5. The total annual volume <strong>of</strong> water injected into the barriers is included in<br />
Figure 10-7. During the 2004/05 fiscal year about 19,800 AF <strong>of</strong> water was injected into the<br />
barriers (OCWD, 2006). An average <strong>of</strong> approximately 11,500 AFY was injected into the<br />
barriers between fiscal years 1985/86 and 2004/05.<br />
The Talbert Barrier, in operation since 1975, is composed <strong>of</strong> a series <strong>of</strong> 26 injection wells that<br />
span the 2.5 mile wide Talbert Gap in Fountain Valley. Historically, a mixture <strong>of</strong> wastewater<br />
treated at <strong>Water</strong> Factory 21 and deep well water was pumped to the wells and injected into the<br />
shallow aquifer systems. Since 2003, imported water from <strong>Metropolitan</strong> has also been injected.<br />
FINAL IV-10-13 September 2007
Chapter IV – Groundwater <strong>Basin</strong> Reports<br />
<strong>Orange</strong> <strong>County</strong> <strong>Basin</strong>s<br />
<strong>Water</strong> Factory 21 was decommissioned in 2004 and is being replaced with the GWR System,<br />
which will include 12 new wells and increase the injection capacity to 40 MGD. The GWR<br />
System will produce a total <strong>of</strong> 72,000 AFY <strong>of</strong> new water supplies. Up to half <strong>of</strong> the water will<br />
be annually injected into the Talbert Barrier. The remaining supplies will be pumped to<br />
OCWD’s spreading facilities in Anaheim for recharge in the Forebay area (OCWD, 2004). The<br />
GWR System is expected to be constructed and fully on line by September 2007.<br />
Table 10-5<br />
Summary <strong>of</strong> Seawater Intrusion Barriers in the <strong>Orange</strong> <strong>County</strong> <strong>Basin</strong><br />
Seawater<br />
Barrier<br />
Number <strong>of</strong><br />
wells<br />
Injection<br />
capacity<br />
(AFY)<br />
Talbert Barrier 38 40,000<br />
Alamitos<br />
Barrier Project<br />
43 11,000<br />
Source water<br />
Recycled<br />
Groundwater<br />
Imported<br />
Recycled<br />
Imported<br />
Owner<br />
OCWD<br />
LACDPW<br />
OCWD<br />
Total 69 53,000 -- --<br />
Direct Groundwater Recharge (AFY)<br />
450,000<br />
400,000<br />
350,000<br />
300,000<br />
250,000<br />
200,000<br />
150,000<br />
100,000<br />
Figure 10-7<br />
Historical Groundwater Recharge in the <strong>Orange</strong> <strong>County</strong> <strong>Basin</strong><br />
50,000<br />
0<br />
1985/86<br />
1986/87<br />
Injection - Other<br />
Injection - Recycled<br />
Injection - Imported<br />
Spreading - Run<strong>of</strong>f<br />
Spreading - Imported<br />
1987/88<br />
1988/89<br />
1989/90<br />
1990/91<br />
1991/92<br />
1992/93<br />
FINAL IV-10-14 September 2007<br />
1993/94<br />
1994/95<br />
1995/96<br />
1996/97<br />
Fiscal Year<br />
Average spreading = 217,200<br />
AFY<br />
Average injection = 11,500 AFY<br />
1997/98<br />
1998/99<br />
1999/00<br />
2000/01<br />
2001/02<br />
2002/03<br />
2003/04<br />
2004/05
Chapter IV – Groundwater <strong>Basin</strong> Reports<br />
<strong>Orange</strong> <strong>County</strong> <strong>Basin</strong><br />
The Alamitos Barrier Project consists <strong>of</strong> 43 wells with a combined injection capacity <strong>of</strong> 15 cfs<br />
and 4 extraction wells in the Alamitos Gap in Long Beach and Seal Beach (DWR, 2005;WRD,<br />
2006d). The barrier straddles the political boundary between the Central and <strong>Orange</strong> <strong>County</strong><br />
basins and is operated by LACDPW in cooperation with OCWD and <strong>Water</strong> Replenishment<br />
<strong>District</strong> <strong>of</strong> <strong>Southern</strong> California (WRD). Up to 11,000 AFY could be injected. The barrier<br />
utilizes imported water purchased from the City <strong>of</strong> Long Beach or recycled water from WRD’s<br />
Leo J. Vander Lans Advanced <strong>Water</strong> Treatment Facility. Prior to 2005, recycled water was not<br />
injected in the Alamitos Barrier Project. WRD began delivering recycled water for injection in<br />
water year 2005/06.<br />
Desalters<br />
The Irvine Desalter is a joint groundwater quality restoration project by the Irvine Ranch <strong>Water</strong><br />
<strong>District</strong> (IRWD), OCWD, MWDOC, <strong>Metropolitan</strong>, and the United States Navy to employ two<br />
water purification plants to address a shallow plume <strong>of</strong> VOCs that exists beneath the former<br />
El Toro Marine Corp Air Station, which is moving toward the Main <strong>Orange</strong> <strong>County</strong> <strong>Basin</strong>. One<br />
plant removes TDS and VOCs from the contaminated groundwater and the treated water is used<br />
for irrigation and recycled water purposes (OCWD, 2004). The second plant removes TDS and<br />
nitrate from the shallow groundwater aquifer outside the former El Toro Marine Corps Air<br />
Station plume to provide a new drinking water source (OCWD, 2004).<br />
The Tustin Seventeenth Street Desalter is operated to reduce primarily shallow groundwater with<br />
high nitrate and TDS levels produced from the Seventeenth Street Wells Nos. 2, 4 and Tustin’s<br />
Newport Well. The treated water is blended back with produced native water producing up to<br />
3,000 AFY <strong>of</strong> potable water (OCWD, 2004).<br />
GROUNDWATER LEVELS<br />
Historically, groundwater flow in the <strong>Orange</strong> <strong>County</strong> <strong>Basin</strong> has been from the recharge areas in<br />
the north toward the Pacific Ocean. As shown in Figure 10-8, in November 2005,<br />
<strong>Orange</strong> <strong>County</strong> <strong>Basin</strong> water levels ranged from a high <strong>of</strong> about 300 feet above mean sea level<br />
(MSL) in the north portion <strong>of</strong> the basin upgradient <strong>of</strong> the spreading grounds to a low <strong>of</strong> about<br />
80 feet below MSL in the coastal areas.<br />
Historical water levels in key wells in various locations in the basin are summarized in<br />
Figures 10-9 and 10-10. The locations <strong>of</strong> the wells plotted are shown in Figure 10-1. These<br />
data show that water levels in the Forebay area where the aquifers are merged generally<br />
experience higher water levels and are relatively stable with annual variations on the order <strong>of</strong><br />
50 feet. In the Pressure area, water levels in the underlying aquifers are generally below sea<br />
level. <strong>Water</strong> levels generally correlate with the change in storage discussed above. Seasonal<br />
variations in water level in the Pressure area are as much as 100 feet. <strong>Water</strong> levels in the key<br />
well in south-central pressure area decreased up to 70 feet between 1985 and 2004. <strong>Water</strong> levels<br />
in other key wells are essentially unchanged in this same period.<br />
Land subsidence due to groundwater withdrawal is common in groundwater basins. Slight<br />
subsidence has been observed in Santa Ana, which may be due to groundwater withdrawal, and<br />
FINAL IV-10-15 September 2007
Chapter IV – Groundwater <strong>Basin</strong> Reports<br />
<strong>Orange</strong> <strong>County</strong> <strong>Basin</strong>s<br />
in the Huntington Beach area, likely due to oil withdrawal (OCWD, 2004). In the period<br />
between 1993 and 1999, land surface elevations declined about 0.5 inches per year in Santa Ana<br />
(OCWD, 2004). Despite the indications <strong>of</strong> land subsidence in the <strong>Orange</strong> <strong>County</strong> <strong>Basin</strong>, there<br />
has been no indication that these decreases have resulted in damage. By managing groundwater<br />
levels and storage, the potential for land subsidence can be reduced (OCWD, 2004).<br />
Source: Herndon, 2006<br />
GROUNDWATER QUALITY<br />
Figure 10-8<br />
Groundwater Elevation Contours – November 2005<br />
In general, groundwater in the main producing aquifers <strong>of</strong> the basins is <strong>of</strong> good quality with an<br />
average concentration <strong>of</strong> total dissolved solids (TDS) in the basin <strong>of</strong> 441 mg/L (OCWD, 2006).<br />
Ninety to 95 percent <strong>of</strong> basin pumping is from the main aquifers. A few localized areas <strong>of</strong><br />
shallow contamination exist in the basin, however, very little water is pumped from the shallow<br />
aquifers. Additionally, OCWD has implemented active projects and programs to remove<br />
contaminants from the shallow aquifers before they can migrate into the main producing<br />
aquifers.<br />
FINAL IV-10-16 September 2007
<strong>Water</strong> Level (feet MSL)<br />
200<br />
150<br />
100<br />
50<br />
0<br />
1985<br />
1986<br />
1987<br />
Figure 10-9<br />
Historical <strong>Water</strong> Levels in the Forebay Area<br />
1988<br />
Source: OCWD, 2004<br />
<strong>Water</strong> Level (feet MSL)<br />
50<br />
0<br />
-50<br />
-100<br />
-150<br />
1985<br />
1986<br />
1987<br />
Source: OCWD, 2004<br />
1989<br />
1990<br />
1991<br />
1992<br />
1993<br />
1994<br />
Chapter IV – Groundwater <strong>Basin</strong> Reports<br />
<strong>Orange</strong> <strong>County</strong> <strong>Basin</strong><br />
FINAL IV-10-17 September 2007<br />
1995<br />
1996<br />
Fiscal Year<br />
1997<br />
1998<br />
1999<br />
2000<br />
Figure 10-10<br />
Historical <strong>Water</strong> Levels in the Pressure Area<br />
1988<br />
1989<br />
1990<br />
1991<br />
1992<br />
1993<br />
1994<br />
1995<br />
1996<br />
Fiscal Year<br />
1997<br />
1998<br />
1999<br />
2000<br />
2001<br />
2001<br />
2002<br />
2002<br />
2003<br />
2003<br />
2004<br />
Central Pressure Area<br />
South- Central Pressure Area<br />
The following section provides a brief description <strong>of</strong> groundwater quality issues in the<br />
<strong>Orange</strong> <strong>County</strong> <strong>Basin</strong>. The discussion includes a description <strong>of</strong> current monitoring program,<br />
constituents <strong>of</strong> concern, and treatment operations in the basin.<br />
2004
Chapter IV – Groundwater <strong>Basin</strong> Reports<br />
<strong>Orange</strong> <strong>County</strong> <strong>Basin</strong>s<br />
Groundwater Contaminants<br />
Key constituents <strong>of</strong> concern for the <strong>Orange</strong> <strong>County</strong> <strong>Basin</strong> include: total dissolved solids, nitrate,<br />
volatile organic compounds (VOCs), perchlorate, colored water, and NDMA. The nitrate and<br />
VOC contaminants are located in the shallow aquifers and none <strong>of</strong> these contaminants have<br />
significantly impacted the groundwater basin’s operation. In many portions <strong>of</strong> the groundwater<br />
basin, shallow water is prevented from migrating into deeper aquifers due to aquitards<br />
(impervious formations). Additionally, OCWD has aggressively initiated programs to address<br />
contaminants <strong>of</strong> concern before they become larger issues. A summary <strong>of</strong> these constituents is<br />
provided in Table 10-6.<br />
TDS concentrations range from 221 mg/L in Seal Beach area to more than 1,000 mg/L in<br />
portions <strong>of</strong> the Irvine subbasin (OCWD, 2006). Increasing concentrations in forebay areas <strong>of</strong> the<br />
Main basin are shown in Figure 10-11, which have led to management approaches such as using<br />
low TDS groundwater replenishments and desalters. Areas <strong>of</strong> high TDS (>1,000 mg/L) in the<br />
Irvine subbasin areas are shown in Figure 10-12.<br />
Nitrate concentrations generally range from 4 to 7 mg/L in Forebay and 1 to 4 mg/L in the<br />
Pressure area with an average <strong>of</strong> about 2.2 mg/L (OCWD, 2004; OCWD, 2006). Areas with<br />
concentrations above 10 mg/L are located in inland areas. Nitrate concentrations that exceed the<br />
MCL occur only in a small number <strong>of</strong> areas in the <strong>Orange</strong> <strong>County</strong> <strong>Basin</strong> (OCWD, 2004). Nitrate<br />
plumes that are generally located in the shallow aquifers in the basin are shown in Figure 10-12.<br />
Localized shallow aquifer areas, as shown in Figure 10-12, are also affected by high<br />
concentrations <strong>of</strong> volatile organic compounds (VOCs), most notably trichloroethylene (TCE) and<br />
tetrachloroethylene (PCE). OCWD has active remediation projects to remove these VOC and<br />
nitrate contaminants before they reach the Principal aquifer system.<br />
Perchlorate has primarily been detected in the Forebay area and in only one well in the<br />
<strong>Orange</strong> <strong>County</strong> <strong>Basin</strong> at concentrations at or below the current State notification level <strong>of</strong> 6 µg/L.<br />
As discussed above, the presence <strong>of</strong> colored water is significant in the <strong>Orange</strong> <strong>County</strong> <strong>Basin</strong>.<br />
However, colored groundwater is limited to the Lower aquifer system primarily near the coast<br />
and ranges from 25 color units to 230 color units. The area <strong>of</strong> colored groundwater is shown in<br />
Figure 10-13. Most production wells along the coast pump from the Principal aquifer, which is<br />
above the colored water.<br />
Blending Needs<br />
The local retail producers serve a blend <strong>of</strong> groundwater and MWD imported water supplies. The<br />
blend percentage primarily depends upon the BPP. The average TDS <strong>of</strong> blended water in agency<br />
systems ranges from 315 mg/L to 560 mg/L with an average <strong>of</strong> 450 mg/L. Nitrate<br />
concentrations <strong>of</strong> blended water range from 0.1 to 3.5 mg/L with an average <strong>of</strong> 1.4 mg/L<br />
(OCWD, 2006).<br />
FINAL IV-10-18 September 2007
TDS<br />
Chapter IV – Groundwater <strong>Basin</strong> Reports<br />
<strong>Orange</strong> <strong>County</strong> <strong>Basin</strong><br />
Table 10-6<br />
Summary <strong>of</strong> Constituents <strong>of</strong> Concern in the <strong>Orange</strong> <strong>County</strong> <strong>Basin</strong><br />
Constituent Units Range Description<br />
Secondary MCL = 500<br />
Nitrate (as N)<br />
MCL = 10<br />
VOCs<br />
(TCE and PCE)<br />
TCE MCL = 5<br />
PCE MCL = 5<br />
Perchlorate<br />
Notification level =6<br />
Color<br />
Secondary MCL =3<br />
NDMA<br />
Notification level = 10<br />
mg/L<br />
mg/L<br />
µg/L<br />
Source: OCWD, 2004, 2006<br />
221 to > 1,000<br />
Average ~ 441<br />
ND to >10<br />
Average ~ 2.2<br />
µg/L ND to 6<br />
ND to >5 for TCE<br />
ND to 5.5 for PCE<br />
Units ND to 230<br />
ng/L ND to >10<br />
Range from 221 mg/L in Seal Beach<br />
area to more than 1,000 mg/L in<br />
portions <strong>of</strong> Irvine subbasin.<br />
Increasing concentrations in<br />
Forebay areas.<br />
Associated with former agricultural<br />
activities. Concentrations range<br />
from 4 to 7 mg/L in Forebay and<br />
1 to 4 mg/L in the pressure areas.<br />
Localized shallow aquifer areas with<br />
concentrations above 10 mg/L are<br />
located in inland areas. No<br />
production wells are impacted by<br />
nitrate.<br />
VOCs found beneath El Toro<br />
Marine Corps Air Station and<br />
central Irvine in 1985. Found in<br />
Forebay areas in 1989. Limited to<br />
shallow zones in Forebay.<br />
PCE found in well in Santa Ana.<br />
Occurs primarily in Forebay area<br />
and one well in Santa Ana. No<br />
production wells are impacted by<br />
perchlorate.<br />
Colored groundwater is limited to<br />
Lower aquifer system near the coast.<br />
Range in colored water zone ranges<br />
from 25 color units to 230 color<br />
units.<br />
One well along the coast is treated<br />
for NDMA<br />
FINAL IV-10-19 September 2007
Chapter IV – Groundwater <strong>Basin</strong> Reports<br />
<strong>Orange</strong> <strong>County</strong> <strong>Basin</strong><br />
Figure 10-11<br />
Areas Containing TDS above 500 mg/L in <strong>Orange</strong> <strong>County</strong> <strong>Basin</strong><br />
Source: OCWD, 2004<br />
FINAL IV-10-20 September 2007
Chapter IV – Groundwater <strong>Basin</strong> Reports<br />
<strong>Orange</strong> <strong>County</strong> <strong>Basin</strong>s<br />
Figure 10-12<br />
Areas Impacted by Nitrates, Salts, and VOCs in <strong>Orange</strong> <strong>County</strong> <strong>Basin</strong><br />
Source: OCWD, 2007<br />
FINAL IV-10-21 September 2007
Chapter IV – Groundwater <strong>Basin</strong> Reports<br />
<strong>Orange</strong> <strong>County</strong> <strong>Basin</strong><br />
Figure 10-13<br />
Areas <strong>of</strong> Colored <strong>Water</strong> in the <strong>Orange</strong> <strong>County</strong> <strong>Basin</strong><br />
Source: OCWD, 2004<br />
FINAL IV-10-22 September 2007
Groundwater Treatment<br />
Chapter IV – Groundwater <strong>Basin</strong> Reports<br />
<strong>Orange</strong> <strong>County</strong> <strong>Basin</strong><br />
Six treatment projects are in effect to lower nitrate, TDS, VOC, iron and manganese, NDMA and<br />
color to acceptable levels in groundwater produced from several wells totaling approximately<br />
20,000 AF in 2006. The locations <strong>of</strong> the treatment facilities are shown in Figure 10-14.<br />
CURRENT GROUNDWATER STORAGE PROGRAMS<br />
<strong>Orange</strong> <strong>County</strong> <strong>Basin</strong> producers have participated in a variety <strong>of</strong> groundwater storage programs<br />
with <strong>Metropolitan</strong> since 1985. These include <strong>Metropolitan</strong>’s short-term shift, cyclic water, and<br />
replenishment water programs for purchase <strong>of</strong> imported water for recharge and in-lieu. Direct<br />
recharge volumes are discussed above.<br />
In-lieu deliveries are summarized in Figure 10-15. An average <strong>of</strong> approximately 27,800 AFY<br />
was stored in-lieu in the <strong>Orange</strong> <strong>County</strong> <strong>Basin</strong> between fiscal years 1985/86 and 2004/05. On<br />
average about 15,500 AFY <strong>of</strong> short-term seasonal shift water (i.e. stored and extracted in same<br />
year) was also delivered.<br />
In June 2003, OCWD and <strong>Metropolitan</strong> entered into an agreement for the <strong>Orange</strong> <strong>County</strong><br />
Conjunctive Use Program (<strong>Orange</strong> <strong>County</strong> CUP). The <strong>Orange</strong> <strong>County</strong> CUP allows <strong>Metropolitan</strong><br />
to store up to 66,000 AF in the basin to be taken later by <strong>Metropolitan</strong> in-lieu <strong>of</strong> providing<br />
imported supplies during water shortage events. The balance at the end <strong>of</strong> fiscal year 2005/06<br />
was approximately 35,500 AF.<br />
In addition to replenishment and CUP storage, <strong>Metropolitan</strong> and MWDOC entered into an<br />
agreement in late 2005 for delivery <strong>of</strong> supplemental storage water. After a combined 80,000 AF<br />
had been taken via the replenishment and CUP programs, MWDOC could purchase additional<br />
imported water for storage in the <strong>Orange</strong> <strong>County</strong> <strong>Basin</strong> at a discounted rate before June 30, 2006.<br />
This water would be stored in the <strong>Orange</strong> <strong>County</strong> <strong>Basin</strong> for five years. <strong>Metropolitan</strong> could call<br />
the water during this time period. After five years, this water would revert to the <strong>Orange</strong> <strong>County</strong><br />
<strong>Basin</strong>. 16,000 AF <strong>of</strong> water was placed into this account.<br />
FINAL IV-10-23 September 2007
Chapter IV – Groundwater <strong>Basin</strong> Reports<br />
<strong>Orange</strong> <strong>County</strong> <strong>Basin</strong><br />
Figure 10-14<br />
Locations <strong>of</strong> Groundwater Treatment Projects in the <strong>Orange</strong> <strong>County</strong> <strong>Basin</strong><br />
Source: OCWD, 2007<br />
FINAL IV-10-24 September 2007
In-lieu Storage (AFY)<br />
90,000<br />
80,000<br />
70,000<br />
60,000<br />
50,000<br />
40,000<br />
30,000<br />
20,000<br />
10,000<br />
0<br />
Chapter IV – Groundwater <strong>Basin</strong> Reports<br />
<strong>Orange</strong> <strong>County</strong> <strong>Basin</strong><br />
Figure 10-15<br />
Historical In-Lieu Storage in the <strong>Orange</strong> <strong>County</strong> <strong>Basin</strong><br />
1985/86<br />
1986/87<br />
1987/88<br />
1988/89<br />
Source, MWD 2006<br />
Short-term Shift<br />
Long-term CUP<br />
Long-term Cyclic<br />
Long-term Replenishment<br />
1989/90<br />
1990/91<br />
1991/92<br />
1992/93<br />
BASIN MANAGEMENT CONSIDERATIONS<br />
1993/94<br />
Average long-term in-lieu<br />
~ 27,800 AFY<br />
FINAL IV-10-25 September 2007<br />
1994/95<br />
1995/96<br />
Fiscal Year<br />
The following describes the basin management considerations in the <strong>Orange</strong> <strong>County</strong> <strong>Basin</strong>.<br />
Considerations include:<br />
• The basin is managed to provide a sustainable yield <strong>of</strong> groundwater to the OCWD region.<br />
• Recharge via spreading or injection is a key management strategy for the <strong>Orange</strong> <strong>County</strong><br />
<strong>Basin</strong>. An average <strong>of</strong> about 229,000 AFY was recharged between 1985 and 2004.<br />
• Groundwater production in the basin is limited by the BPP. OCWD sets the BPP each<br />
year to manage the groundwater basin. The BPP has ranged from 64 percent to<br />
80 percent <strong>of</strong> total water demand.<br />
• The potential for seawater intrusion primarily limits the utilization <strong>of</strong> the basin unless<br />
additional seawater barrier facilities are constructed. Current groundwater improvement<br />
projects and the construction <strong>of</strong> the GWR System at the Talbert Barrier have increased<br />
the groundwater utilization.<br />
1996/97<br />
1997/98<br />
1998/99<br />
1999/00<br />
2000/01<br />
2001/02<br />
2002/03<br />
2003/04<br />
2004/05
References:<br />
Chapter IV – Groundwater <strong>Basin</strong> Reports<br />
<strong>Orange</strong> <strong>County</strong> <strong>Basin</strong><br />
Banks, Harvey O, Consulting Engineer, 1984. Groundwater Management, Irvine Area,<br />
<strong>Orange</strong> <strong>County</strong>. Prepared for <strong>Orange</strong> <strong>County</strong> <strong>Water</strong> <strong>District</strong>.<br />
California Department <strong>of</strong> <strong>Water</strong> Resources (DWR), 1967. Progress Report on Ground <strong>Water</strong><br />
Geology <strong>of</strong> the Coastal Plain <strong>of</strong> <strong>Orange</strong> <strong>County</strong>.<br />
California Department <strong>of</strong> <strong>Water</strong> Resources (DWR), 2004. California’s Groundwater, Bulletin<br />
118 Coastal Plain <strong>of</strong> <strong>Orange</strong> <strong>County</strong> <strong>Basin</strong>. Updated 2/27/04. Website:<br />
http://www.dpla2.water.ca.gov/publications/groundwater/bulletin118/basins/pdfs_desc/8-<br />
1.pdf Accessed 6/27/07.<br />
Herndon, Roy. 2006. Managing the <strong>Orange</strong> <strong>County</strong> Groundwater <strong>Basin</strong>. Powerpoint<br />
presentation dated June 29, 2006.<br />
Mills, William, R. and Associates, 1987. Hydrogeology <strong>of</strong> the Yorba Linda Subarea and<br />
Impacts from Proposed Class III Landfills. Prepared for <strong>Orange</strong> <strong>County</strong> <strong>Water</strong> <strong>District</strong>.<br />
<strong>Orange</strong> <strong>County</strong> <strong>Water</strong> <strong>District</strong> (OCWD), 2004. Groundwater Management Plan.<br />
<strong>Orange</strong> <strong>County</strong> <strong>Water</strong> <strong>District</strong> (OCWD), 2006, 2004-2005 Engineer’s Report on Groundwater<br />
Conditions, <strong>Water</strong> Supply and <strong>Basin</strong> Utilization in the <strong>Orange</strong> <strong>County</strong> <strong>Water</strong> <strong>District</strong>.<br />
<strong>Orange</strong> <strong>County</strong> <strong>Water</strong> <strong>District</strong> (OCWD), 2007. Electronic transmission <strong>of</strong> graphics files from<br />
John Kennedy, January 26, 2007.<br />
Singer, John A., 1973. Geohydrology and Artificial Recharge Potential <strong>of</strong> the Irvine Area,<br />
<strong>Orange</strong> <strong>County</strong> California, USGS Open File Report 73-264.<br />
Superior Court <strong>of</strong> <strong>Orange</strong> <strong>County</strong>. 1969. Stipulated Judgment in Case No. 117628<br />
<strong>Orange</strong> <strong>County</strong> <strong>Water</strong> <strong>District</strong> vs. City <strong>of</strong> City <strong>of</strong> Chino et al.<br />
University <strong>of</strong> California Statewide Integrated Pest Management Program (UC IPM), 2006.<br />
Precipitation Data.<br />
FINAL IV-10-26 September 2007