Agilent E5052B Signal Source Analyzer 10 MHz to 7 GHz, 26.5 GHz ...
Agilent E5052B Signal Source Analyzer 10 MHz to 7 GHz, 26.5 GHz ...
Agilent E5052B Signal Source Analyzer 10 MHz to 7 GHz, 26.5 GHz ...
- No tags were found...

You also want an ePaper? Increase the reach of your titles
YUMPU automatically turns print PDFs into web optimized ePapers that Google loves.
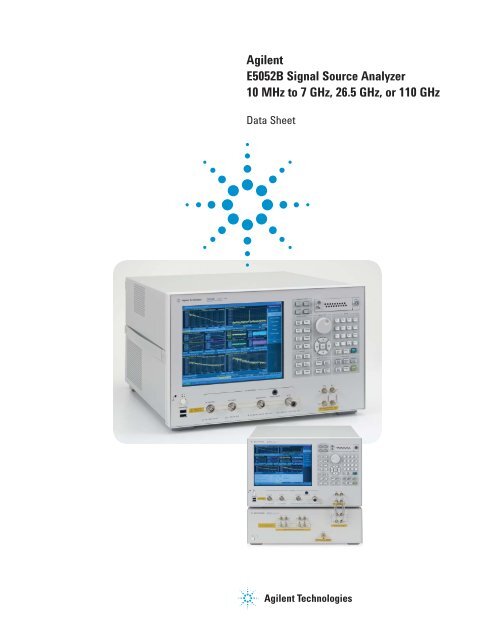
<strong>Agilent</strong><strong>E5052B</strong> <strong>Signal</strong> <strong>Source</strong> <strong>Analyzer</strong><strong>10</strong> <strong>MHz</strong> <strong>to</strong> 7 <strong>GHz</strong>, <strong>26.5</strong> <strong>GHz</strong>, or 1<strong>10</strong> <strong>GHz</strong>Data Sheet
DefinitionsAll specifications apply over a 23 °C ± 5 °C range (unlessotherwise stated) and 30 minutes after the instrument has beenturned on.All specified and supplemental values for RF input signals areapplicable <strong>to</strong> sinusoidal-wave carriers unless otherwise noted.Specification (spec.):Warranted performance. Specifications include guard-bands <strong>to</strong>account for the expected statistical performance distribution,measurement uncertainties, and changes in performance due<strong>to</strong> environmental conditions.Following supplemental information is intended <strong>to</strong> provideinformation that is helpful for using the instrument but that isnot guaranteed by the product warranty.RF Input PortTable 1-1. RF IN portDescriptionSpecificationRF IN connec<strong>to</strong>rType-N (female), 50 ohm nominalRF IN frequency range<strong>10</strong> <strong>MHz</strong> <strong>to</strong> 7 <strong>GHz</strong>RF IN measurement level–20 dBm <strong>to</strong> + 20dBm (> 30 <strong>MHz</strong>)–15 dBm <strong>to</strong> +20 dBm (< 30 <strong>MHz</strong>)Input attenua<strong>to</strong>r0 <strong>to</strong> 35 dB (in 5 dB step)Input damage levelAC > +23 dBm, DC > 5VInput VSWR @50 ohm<strong>10</strong> <strong>MHz</strong> <strong>to</strong> 30 <strong>MHz</strong> < 1.630 <strong>MHz</strong> <strong>to</strong> 2 <strong>GHz</strong> < 1.22 <strong>GHz</strong> <strong>to</strong> 3 <strong>GHz</strong> < 1.33 <strong>GHz</strong> <strong>to</strong> 4 <strong>GHz</strong> < 1.3 typical4 <strong>GHz</strong> <strong>to</strong> 7 <strong>GHz</strong> < 1.5 typicalTypical (typ.):Describes performance that will be met by a minimum of 80% ofall products. It is not guaranteed by the product warranty.Supplemental performance data (SPD):Represents the value of a parameter that is most likely <strong>to</strong> occur;the expected mean or average. It is not guaranteed by the productwarranty.General characteristics or Nominal (nom.):A general, descriptive term that does not imply a level ofperformance. It is not guaranteed by the product warranty.2
Phase Noise MeasurementTable 1-2. Phase noise measurement performanceDescription Specification (<strong>E5052B</strong>) Specification (<strong>E5052B</strong> Option 011)RF IN frequency range<strong>10</strong> <strong>MHz</strong> <strong>to</strong> 7 <strong>GHz</strong>Measurement frequency bands<strong>10</strong> MHZ <strong>to</strong> 41 <strong>MHz</strong>, 39 <strong>MHz</strong> <strong>to</strong> <strong>10</strong>1 <strong>MHz</strong>,99 <strong>MHz</strong> <strong>to</strong> 1.5 <strong>GHz</strong>, 250 <strong>MHz</strong> <strong>to</strong> 7 <strong>GHz</strong> 1RF frequency tracking range0.4% of carrier frequencyMeasurement parametersSSB phase noise [dBc/Hz], Spurious noise [dBc],Integrated rms phase deviation [deg, rad] or time jitter [s],Residual FM [Hz rms]Number of trace1 data trace and 1 memory trace with ‘data math’ functionsMeasurement trigger continuous/single/hold source: internal/external/manual/busOffset frequency range (effective)RF carrier signal > 1 <strong>GHz</strong>(> 400 <strong>MHz</strong> for wide capture mode)RF carrier signal < 1 <strong>GHz</strong>(< 400 <strong>MHz</strong> for wide capture mode)Phase noise uncertainty 2 at effective offset frequencies1 Hz <strong>to</strong> <strong>10</strong>0 <strong>MHz</strong>1 Hz <strong>to</strong> 40 <strong>MHz</strong> (wide capture mode)<strong>10</strong> Hz <strong>to</strong> <strong>10</strong>0 <strong>MHz</strong><strong>10</strong> Hz <strong>to</strong> 40 <strong>MHz</strong> (wide capture mode)1 Hz <strong>to</strong> <strong>10</strong>% of carrier frequency <strong>10</strong> Hz <strong>to</strong> <strong>10</strong>% of carrier frequencyOffset 1 Hz <strong>to</strong> <strong>10</strong> Hz ± 4 dB SPD N/AOffset <strong>10</strong> Hz <strong>to</strong> <strong>10</strong>0 Hz ± 4 dB SPDOffset <strong>10</strong>0 Hz <strong>to</strong> 1 kHz ± 3 dBOffset 1 kHz <strong>to</strong> 40 <strong>MHz</strong> ± 2 dBOffset 40 <strong>MHz</strong> <strong>to</strong> <strong>10</strong>0 <strong>MHz</strong> ± 3 dBSSB phase noise sensitivity See Table 1-3, 1-4, 1-5, Figure 1-1, 1-2, 1-3IF gain setting0 dB <strong>to</strong> 50 dB in <strong>10</strong> dB step0 dB <strong>to</strong> 30 dB in <strong>10</strong> dB step( not available in wide capture mode)(not available in wide capture mode)Enhanced sensitivityCross-correlation method available.Number of correlation = 1 <strong>to</strong> <strong>10</strong>,000See Table 1-5 and Figure 1-3N/ABuilt-in LO phase noise optimization< 150 kHz (optimized for better close-in phase noise measurement)> 150 kHz (optimized for better far-out phase noise measurement)See Figure 1-4.Reference oscilla<strong>to</strong>r bandwidth optimization Narrow / Wide See Figure 1-5.Residual spurious response level< –65 dBc typical at > 1 kHz offset frequencyMeasurement time See Table 1-6Measurement rangeCapture mode: Normal or Wide1. Wide capture mode is available for 250 <strong>MHz</strong> <strong>to</strong> 7 <strong>GHz</strong> only2. Phase noise uncertainty : specifi ed at <strong>10</strong> <strong>MHz</strong> and 1 <strong>GHz</strong> of carrier frequency with 0 dBm level. PN level > –60 dBc3
Phase Noise Measurement – cont’dTable 1-3. SSB phase noise sensitivity (<strong>E5052B</strong>)LO optimization: < 150 kHz, Ref. BW: narrow, correlation = 1, RF input : +5 dBm, start offset frequency : 1 Hz, measurement time = 12.9 secRF input frequencyOffset frequency [Hz] from the carrier1 <strong>10</strong> <strong>10</strong>0 1 k <strong>10</strong> k <strong>10</strong>0 k 1 M <strong>10</strong> M 40 M <strong>10</strong>0 M<strong>10</strong> <strong>MHz</strong> specifi cation –148 –156 –166 –168 – – –SPD –<strong>10</strong>0 –131 –151 –164 –172 –178 –178 – – –<strong>10</strong>0 <strong>MHz</strong> specifi cation –147 –156 –163 –168 –170 – –SPD –80 –111 –136 –154 –164 –171 –175 –178 – –1 <strong>GHz</strong> specifi cation –128 –137 –144 –160 –170 –168 –169SPD –60 –91 –116 –135 –146 –155 –171 –178 –178 –1773 <strong>GHz</strong> specifi cation –118 –127 –133 –149 –163 –164 –165SPD –50 –81 –<strong>10</strong>6 –127 –135 –142 –161 –175 –177 –1777 <strong>GHz</strong> specifi cation –111 –120 –127 –143 –157 –158 –159SPD –43 –74 –99 –121 –129 –138 –154 –171 –174 –175Table 1-4. SSB phase noise sensitivity (<strong>E5052B</strong> Option 011)LO optimization: < 150 kHz, Ref. BW: narrow, correlation = 1, RF input : +5 dBm, start offset frequency : <strong>10</strong> Hz, measurement time = 3.3 secRF input frequencyOffset frequency [Hz] from the carrier<strong>10</strong> <strong>10</strong>0 1 k <strong>10</strong> k <strong>10</strong>0 k 1 M <strong>10</strong> M 40 M <strong>10</strong>0 M<strong>10</strong> <strong>MHz</strong> specifi cation –135 –147 –160 –160 – – –SPD –120 –135 –151 –163 –170 –170 – – –<strong>10</strong>0 <strong>MHz</strong> specifi cation –142 –152 –154 –156 –159 – –SPD –<strong>10</strong>7 –128 –149 –160 –168 –170 –170 – –1 <strong>GHz</strong> specifi cation –125 –134 –141 –157 –160 –160 –160SPD –86 –111 –132 –143 –152 –168 –170 –170 –1703 <strong>GHz</strong> specifi cation –115 –124 –130 –146 –160 –160 –160SPD –76 –<strong>10</strong>1 –124 –132 –139 –158 –170 –170 –1707 <strong>GHz</strong> specifi cation –<strong>10</strong>8 –117 –124 –140 –154 –155 –156SPD –69 –94 –118 –126 –135 –151 –165 –170 –170Table 1-5. SSB phase noise sensitivity improvement by correlationNumber of correlation <strong>10</strong> <strong>10</strong>0 1,000 <strong>10</strong>,000Improvement fac<strong>to</strong>r 5 dB <strong>10</strong> dB 15 dB 20 dBTable 1-6. <strong>E5052B</strong> Typical measurement time (sec) for phase noiseLO optimization: < 150 kHz, Ref. BW: narrow, correlation = 1, RF input : +5 dBmS<strong>to</strong>p frequency (Hz)Start frequency (Hz)1 <strong>10</strong> <strong>10</strong>0 1k<strong>10</strong>0k 8.8 2.2 0.28 0.041M 8.8 2.2 0.28 0.04<strong>10</strong>M <strong>10</strong> 2.5 0.32 0.0440M <strong>10</strong> 2.5 0.32 0.04<strong>10</strong>0M 12.9 3.3 0.41 0.05Measurement time (sec) = ( 0.4(Capture Range Narrow) or 0.6(Capture Range Wide) )+ the above value x number of correlationwhen applying cross-correlation function (<strong>E5052B</strong> ONLY).For <strong>E5052B</strong> Option 011, number of correlation = 1.4
Phase Noise Measurement – cont’d<strong>E5052B</strong> SSB-PN Sensitivity<strong>E5052B</strong>-011 SSB-PN SensitivitySSB phase noise [dBc/Hz]–40–50–60<strong>10</strong> <strong>MHz</strong>–70<strong>10</strong>0 <strong>MHz</strong>–801 <strong>GHz</strong>–90–<strong>10</strong>0–1<strong>10</strong>–120–130–140–150–160–170–180–190–2001 <strong>10</strong> <strong>10</strong>0 1k <strong>10</strong>k <strong>10</strong>0k 1M <strong>10</strong>M <strong>10</strong>0MSSB phase noise [dBc/Hz]–40–50–60<strong>10</strong> <strong>MHz</strong>–70<strong>10</strong>0 <strong>MHz</strong>–801 <strong>GHz</strong>–90–<strong>10</strong>0–1<strong>10</strong>–120–130–140–150–160–170–180–190–2001 <strong>10</strong> <strong>10</strong>0 1k <strong>10</strong>k <strong>10</strong>0k 1M <strong>10</strong>M <strong>10</strong>0MOffset frequency [Hz]Offset frequency [Hz]Figure 1-1. SSB phase noise sensitivity (<strong>E5052B</strong>, SPD) (LO < 150 kHzoptimized, +5 dBm input, start offset frequency = 1 Hz, measurement time =12.9 sec.)Figure 1-2. SSB phase noise sensitivity (<strong>E5052B</strong> Option 011, SPD)(LO < 150 kHz optimized, +5 dBm input, start offset frequency = <strong>10</strong> Hz, measurementtime = 3.3 sec.)<strong>E5052B</strong> SSB-PN Sensitivity Improvement by Correlation @1 <strong>GHz</strong><strong>E5052B</strong> SSB-PN Sensitivity Change by L.O. Phase Optimization @1 <strong>GHz</strong>SSB phase noise [dBc/Hz]–40–50–60corr. = 1–70corr. = <strong>10</strong>–80corr. = <strong>10</strong>0–90–<strong>10</strong>0–1<strong>10</strong>–120–130–140–150–160–170–180–190–2001 <strong>10</strong> <strong>10</strong>0 1k <strong>10</strong>k <strong>10</strong>0k 1M <strong>10</strong>M <strong>10</strong>0MSSB phase noise [dBc/Hz]–40–50–60< 150 kHz opt.–70> 150 kHz opt.–80–90–<strong>10</strong>0–1<strong>10</strong>–120–130–140–150–160–170–180–190–2001 <strong>10</strong> <strong>10</strong>0 1k <strong>10</strong>k <strong>10</strong>0k 1M <strong>10</strong>M <strong>10</strong>0MOffset frequency [Hz]Offset frequency [Hz]Figure 1-3. SSB phase noise sensitivity improvement by correlation(<strong>E5052B</strong>, SPD) (carrier 1 <strong>GHz</strong>, LO < 150 kHz optimized, +5 dBm input, start offsetfrequency = 1 Hz)Figure 1-4. SSB phase noise change by LO optimization (SPD)(carrier 1 <strong>GHz</strong>, +5 dBm input, start offset frequency = 1 Hz, reference oscilla<strong>to</strong>r:narrowband)Spectrum Moni<strong>to</strong>r Measurement–70<strong>E5052B</strong> SSB-PN Sensitivity Change by Reference Oscilla<strong>to</strong>r Bandwidth @<strong>10</strong>0 <strong>MHz</strong>Table 2-1. Spectrum moni<strong>to</strong>r performanceDescriptionRF frequency rangeMoni<strong>to</strong>ring spanRBWMeasurement parametersAbsolute measurement uncertaintyRelative measurement uncertaintyResidual noise fl oorMeasurement triggerSpecification<strong>10</strong> <strong>MHz</strong> <strong>to</strong> 7 <strong>GHz</strong>15 <strong>MHz</strong> maximum with linear scale1.53 Hz <strong>to</strong> 400 kHzdBm, dBV, watt, volt,–dBm/Hz, dBV/Hz, watt/Hz, V/√Hz± 2 dB typical @ –<strong>10</strong> dBm (att. = <strong>10</strong> dB)± 1.5 dB (–60 dBm <strong>to</strong> –<strong>10</strong> dBm, ratio)–95 dBm typical @ RBW = 24.4 Hzsame as Phase Noise3 phase noise [dBc/Hz]–80Narrow–90Wide–<strong>10</strong>0–1<strong>10</strong>–120–130–140–150–160–1701 <strong>10</strong> <strong>10</strong>0 1k <strong>10</strong>k <strong>10</strong>0k 1M <strong>10</strong>M <strong>10</strong>0MOffset frequency [Hz]Figure 1-5. SSB phase noise sensitivity change by Reference Oscilla<strong>to</strong>rBandwidth (SPD) (carrier <strong>10</strong>0 <strong>MHz</strong>, +5 dBm input, start offset frequency = 1 Hz,LO optimization: < 150 kHz)5
Frequency and RF Power, DC Supply Current MeasurementsTable 3-1. Frequency and Power measurement performanceDescription Specification (<strong>E5052B</strong>) Specification (<strong>E5052B</strong>-011)RF frequency range<strong>10</strong> <strong>MHz</strong> <strong>to</strong> 7 <strong>GHz</strong>Measurement frequency bands<strong>10</strong> <strong>MHz</strong> <strong>to</strong> 1.5 <strong>GHz</strong> (low-band), 250 <strong>MHz</strong> <strong>to</strong> 7 <strong>GHz</strong> (high-band)Sweep parametersDC control voltage (Vc)DC supply voltage (Vs)N/A(Vc and Vs : constant)Measurement parametersFull analysis capability available forFrequency [Hz, ∆Hz, %, ppm],Tuning sensitivity (∆f/∆Vc)[Hz/V], frequency pushing(∆f/∆Vs)[Hz/V],RF power level [dBm],DC supply current [A],‘Meter mode’ is also available.No ‘Analysis mode’.Only ‘Meter mode’ is available.Frequency [Hz],RF power [dBm],DC supply current [A]Frequency resolution<strong>10</strong> Hz, 1 kHz, 64 kHzFrequency uncertainty± (frequency resolution + time-base uncertainty)RF power measurement range–20 dBm <strong>to</strong> +20 dBm (carrier 30 <strong>MHz</strong> <strong>to</strong> 7 <strong>GHz</strong>)–15 dBm <strong>to</strong> +20 dBm (carrier <strong>10</strong> <strong>MHz</strong> <strong>to</strong> 30 <strong>MHz</strong>)RF power resolution0.01 dBRF power uncertainty (by peak detection)± 0.5 dB (carrier 30 <strong>MHz</strong> <strong>to</strong> 3 <strong>GHz</strong>, > –<strong>10</strong> dBm)± 1 dB (other than the above)DC (Vs) current measurement range0 <strong>to</strong> 80 mADC (Vs) current resolution <strong>10</strong> µADC (Vs) current uncertainty± (0.2% of reading + 160 µA)Swept measurement points 2 <strong>to</strong> 1,001 N/ADC supply voltage source (Vs) outputSetting range 0 <strong>to</strong> +16 V (Sweep) 0 <strong>to</strong> +16 V (one point)Setting resolution1 mVSetting uncertainty± (0.2% of setting + 2 mV)Maximum output current80 mA–Noise level< <strong>10</strong> nVrms/√Hz @ <strong>10</strong> kHz typicalOutput resistance< 0.3 ohm typicalDC control voltage source (Vc) outputSetting range –15 V <strong>to</strong> +35 V (sweep) –15 V <strong>to</strong> +35 V (one point)Setting resolution0.1 mVSetting uncertainty ± (0.1% of (setting + 15 V) + 5 mV) (@Vc = –15 V <strong>to</strong> 0V)± (0.1% of setting + 2 mV) (@Vc = 0 <strong>to</strong> +35 V)Maximum output current20 mA–Noise level1 nVrms/√Hz @ <strong>10</strong> kHz (Vc = 0 <strong>to</strong> +20V)–1.5 nVrms/√Hz @ <strong>10</strong> kHz (Vc: otherwise)Output resistance< 50 ohm (DC)Output settling time< 20 ms @ 0.1% uncertaintyMeasurement triggercontinuous/single/hold<strong>Source</strong>: internal/external/manual/bus6
Transient MeasurementTable 4-1. Transient measurement performanceDescriptionTarget frequency rangeMeasurement parametersNarrowband modeWideband modeFrequency transient bandwidthWidebandNarrowbandFrequency measurementResolutionUncertaintyRF power measurementPower level rangeResolutionUncertaintyPhase measurement (when DUT signal is locked <strong>to</strong> a target frequency)UncertaintyTrace noiseStabilitySweep measurement timeTime spanTime resolutionMeasurement triggerTrigger modeTrigger sourceExternal trigger polarityVideo triggerVideo fi lter time-constantPre-trigger delayExternal trigger delay adjustmentExternal trigger detection jitterSpecification<strong>10</strong> <strong>MHz</strong> <strong>to</strong> 7 <strong>GHz</strong>Frequency, RF Power, PhaseFrequencySee Table 4-2.3.125 kHz/ 25 kHz/ 200 kHz/ 1.6 <strong>MHz</strong>25.6 <strong>MHz</strong> (> carrier 200 <strong>MHz</strong>)80 <strong>MHz</strong> (> carrier 800 <strong>MHz</strong>)See Table 4-2. through Table 4-8.± (resolution + time-base uncertainty)–20 dBm <strong>to</strong> +20 dBm0.1 dB± 2 dB typical0.1 deg + 0.1 deg/<strong>GHz</strong> typical0.02 deg + 0.02 deg/<strong>GHz</strong> (s) typical<strong>10</strong> deg/sec typical<strong>10</strong> µs <strong>to</strong> 0.1 s in 1,2,5 stepSee Table 4-2 through 4-8. in details8 ns <strong>to</strong> <strong>10</strong> ms,See Table 4-2. <strong>to</strong> 4-8. in detailscontinuous/single/holdinternal/external/manual/bus/wide-video/narrow-videopositive/negative (TTL level)positive/negative/frequency-band in/ frequency-band out160 ns <strong>to</strong> 41 µs–80% of time span <strong>to</strong> + 1 s0 <strong>to</strong> 1 µs< (1 µs + time resolution)7
Transient Measurement/Wideband Mode – cont’dTable 4-3. Narrowband mode (80 <strong>MHz</strong> span)/frequency resolution vs. time spanTime span [s] <strong>10</strong> µ 20 µ 50 µ 0.1 m 0.2 m 0.5 m 1 m 2 m 5 m <strong>10</strong> m 20 m 50 m 0.1 0.2 0.5 1 2 5 <strong>10</strong>Time resolution [s] 8 n 16 n 40 n 80 n 0.16 µ 0.4 µ 1 µ 2 µ 5 µ <strong>10</strong> µ 20 µ 50 µ 125 µ 250 µ 625 µ 1.25 m 2.5 m 6.25 m 12.5 mMeasurement point 1251 1251 1251 1251 1251 1251 <strong>10</strong>01 <strong>10</strong>01 <strong>10</strong>01 <strong>10</strong>01 <strong>10</strong>01 <strong>10</strong>01 801 801 801 801 801 801 801Frequency resolution [Hz] 7 k 2.5 k 879Table 4-4. Narrowband mode (25.6 <strong>MHz</strong> span)/frequency resolution vs. time spanTime span [s] <strong>10</strong> µ 20 µ 50 µ 0.1 m 0.2 m 0.5 m 1 m 2 m 5 m <strong>10</strong> m 20 m 50 m 0.1 0.2 0.5 1 2 5 <strong>10</strong>Time resolution [s] 8 n 16 n 40 n 80 n 0.16 µ 0.4 µ 1 µ 2 µ 5 µ <strong>10</strong> µ 20 µ 50 µ 125 µ 250 µ 625 µ 1.25 m 2.5 m 6.25 m 12.5 mMeasurement point 1251 1251 1251 1251 1251 1251 <strong>10</strong>01 <strong>10</strong>01 <strong>10</strong>01 <strong>10</strong>01 <strong>10</strong>01 <strong>10</strong>01 801 801 801 801 801 801 801Frequency resolution [Hz] 7 k 2.5 k 879 311Table 4-5. Narrowband mode (1.6 <strong>MHz</strong> span)/frequency resolution vs. time spanTime span [s] 0.1 m 1 0.2 m 1 0.5 m 1 1 m 2 m 5 m <strong>10</strong> m 20 m 50 m 0.1 0.2 0.5 1 2 5 <strong>10</strong>Time resolution [s] 0.13 µ 0.26 µ 0.64 µ 0.64 µ 1.28 µ 3.2 µ 6.4 µ 16 µ 80 µ 160 µ 320 µ 800 µ 1.6 m 3.2 m 8 m 16 mMeasurement point 783 783 783 1564 1564 1564 1564 1251 626 626 626 626 626 626 626 626Frequency resolution [Hz] 1<strong>10</strong> 39 13.7 4.9Table 4-6. Narrowband mode (200 kHz span)/frequency resolution vs. time spanTime span [s] 1 m 2 m 5 m <strong>10</strong> m 20 m 1 50 m 1 0.1 1 0.2 1 0.5 1 1 2 5 <strong>10</strong> 1Time resolution [s] 1 µ 1 2 µ 1 5 µ 1 <strong>10</strong> µ 1 20 µ 1 51 µ 1 128 µ 256 µ 640 µ 1.28 m 2.56 m 6.4 m 12.8 mMeasurement point 978 978 978 978 978 978 783 783 783 783 783 783 783Frequency resolution [Hz] 4.9 4.9 1.72 0.61 0.21Table 4-7. Narrowband mode (25 kHz span)/frequency resolution vs. time spanTime span [s] <strong>10</strong> m 20 m 50 m 1 0.1 1 0.2 1 0.5 1 1 2 5 <strong>10</strong>Time resolution [s] 8.2 µ 16.4 µ 41 µ 82 µ 164 µ 4<strong>10</strong> µ 1.02 m 2.05 m 5.12 m <strong>10</strong>.24 mMeasurement point 1222 1222 1222 1222 1222 1222 978 978 978 978Frequency resolution [Hz] 0.21 0.08 0.03 0.01Table 4-8. Narrowband mode (3.125 kHz span)/frequency resolution vs. time spanTime span [s] 0.1 1 0.2 1 0.5 1 1 2 5 <strong>10</strong>Time resolution [s] 65 µ 1 131 µ 1 328 µ 1 655 µ 1 1.31 m 3.3 m 1 8.2 m 1Measurement point 1527 1527 1527 1527 1527 1527 1222Frequency resolution [Hz] 0.01 3 m 1 m 0.4 m1. Means approximately9
AM Noise MeasurementTable 5-1. AM noise measurement performanceDescriptionSpecificationRF frequency range60 <strong>MHz</strong> <strong>to</strong> 7 <strong>GHz</strong>Effective offset frequency range<strong>10</strong> Hz <strong>to</strong> 40 <strong>MHz</strong>(@ > carrier 400 <strong>MHz</strong>)<strong>10</strong> Hz <strong>to</strong> <strong>10</strong>% of carrier frequency(@ < carrier 400 <strong>MHz</strong>)AM noise sensitivity See Table 5-2.Measurement uncertainty 1± 4 dB (<strong>10</strong> Hz <strong>to</strong> <strong>10</strong>0 Hz offset) SPD± 4 dB (<strong>10</strong>0 Hz <strong>to</strong> 1 kHz offset) typical± 2 dB (1 kHz <strong>to</strong> 1 <strong>MHz</strong> offset) typical± 3 dB (1 <strong>MHz</strong> <strong>to</strong> 40 <strong>MHz</strong> offset) typicalSpurious level< –65 dBc/Hz (> 1 kHz offset) typicalTable 5-2. AM noise sensitivity [dBc/Hz]correlation = 1, RF input : 0dBm, >400 <strong>MHz</strong>, measurement time = 13 s (start frequency : 1 Hz setting)AM noise sensitivityOffset frequency [Hz] from the carrier<strong>10</strong> <strong>10</strong>0 1 k <strong>10</strong> k <strong>10</strong>0 k 1 M <strong>10</strong> M 40 MSpecifi cation – – –127 –138 –147 –150 –154 –155Typical –<strong>10</strong>3 –117 –131 –142 –151 –154 –158 –1591. AM noise measurement uncertainty : specifi ed at <strong>10</strong> <strong>MHz</strong> and 1 <strong>GHz</strong> of carrierfrequency with 0 dBm level. AM level > –60 dBc<strong>10</strong>
Baseband Noise MeasurementTable 6-1. Baseband noise measurement performanceDescriptionSpecificationBaseband input connec<strong>to</strong>rBNC, 50 ohm nominal, AC coupledMeasurement frequency range1 Hz <strong>to</strong> <strong>10</strong>0 <strong>MHz</strong> (<strong>E5052B</strong>)<strong>10</strong> Hz <strong>to</strong> <strong>10</strong>0 <strong>MHz</strong> (<strong>E5052B</strong> Option 011)Measurement level range< +5 dBmBaseband input damage level> +23 dBm, > 35 V DCNoise fl oor level See Table 6-2.Measurement uncertainty 1± 4 dB (< 1 kHz) SPD± 2 dB (> 1 kHz) typicalTable 6-2. Baseband noise floor [dBm/Hz]correlation = 1, baseband input : 0 ohm terminatedBB noise floorBaseband frequency [Hz]1 <strong>10</strong> <strong>10</strong>0 1 k <strong>10</strong> k <strong>10</strong>0 k 1 M <strong>10</strong> M 40 M <strong>10</strong>0 M<strong>E5052B</strong> start frequency = 1 Hz, measurement time = 13 sspecifi cation – – – –151 –158 –163 –160 –160 –156 –156typical –119 –132 –145 –155 –162 –167 –164 –164 –160 –160<strong>E5052B</strong> Option 011 start frequency = <strong>10</strong> Hz, measurement speed = 3.3 sspecifi cation – – – –148 –155 –160 –157 –160 –156 –156typical – –129 –142 –152 –159 –164 –161 –164 –160 –160Internal TimebaseTable 7-1. Internal timebase (OCXO) performanceDescriptionFrequency uncertaintyFrequency temperature coeffi cientFrequency aging rateSpecification± 5 Hz at <strong>10</strong> <strong>MHz</strong> (± 0.5 ppm)< 0.5 ppb/degC< 0.5 ppb/day24 hours after a cold start for < 30 days continuous operation< 30 ppb/year for continuous operation1. Baseband measurement uncertainty : specifi ed at > –60 dBm level.11
General InformationTable 8-1. Front Panel InformationDescriptionSupplemental information (nominal)Connec<strong>to</strong>rs/TerminalsRF INType-N (female), 50 ohmBaseband INBNC (female), 50 ohm, AC coupledDC powerBNC (female),DC controlBNC (female), 50 ohmRF1/RF2, IN/OUTSMA (female), 50 ohmSee the simplifi ed block diagram.USB2 ports (designed for USB2.0)Probe DC power output+15 V, 150 mA maximum–12.6 V, 150 mA maximumGround terminal 1Display<strong>10</strong>.4 inch TFT color LCD with <strong>to</strong>uch screen1,024 x 768 resolution 1Table 8-2. Rear Panel InformationDescriptionExternal Trigger Input portConnec<strong>to</strong>rInput signal levelTrigger pulse widthTrigger polarityAuxiliary Output portConnec<strong>to</strong>rOutput signal levelpulse widthReference Output portConnec<strong>to</strong>rOutput frequencyOutput levelOutput signal waveformReference input portsConnec<strong>to</strong>rInput frequencyInput signal levelPC connection ports24 BIT I/O parallel portGPIB portUSB host portsUSB (USBTMC 2 ) portLAN portVideo output portAC Power Line (a third-wire ground is required)AC frequencyAC voltageAC powerSupplemental information (nominal)BNC (female)TTL level, (0 V <strong>to</strong> +5 V)Threshold Low: 0.5 V, High: 2.1V> 2 µspositive/negative edge selectableBNC (female)TTL level, L: 0 V, H:= +5 V, 50 mA max.1 µsBNC (female), 50 ohmsame as timebase2.5 dBm ± 3 dB typicalSinusoidal wave(Ref In 1, Ref In 2)BNC (female), 50 ohm<strong>10</strong> <strong>MHz</strong> ± <strong>10</strong> Hz0 dBm <strong>to</strong> <strong>10</strong> dBm36-pin D-Sub (female) connec<strong>to</strong>r <strong>to</strong> a handler systemTTL level, 8-bit I/O 16-bit Out24-pin D-Sub (female) connec<strong>to</strong>r (compatible with IEEE-488)4 type-A (compatible with USB 2.0)1 type-B (compatible with USBTMC-USB488 and USB 2.0)<strong>10</strong>/<strong>10</strong>0 base-T Ethernet15-pin mini D-sub (female) connec<strong>to</strong>r drives XGA compatible moni<strong>to</strong>rs47 Hz <strong>to</strong> 63 Hz90 <strong>to</strong> 132 V, or 198 <strong>to</strong> 264 V (au<strong>to</strong>matically selected)500 VA maximum1. Valid pixels > 99.99%. Below 0.01% of pixel defect is not regarded as failure.2. USB Test and Measurement Class (TMC) interface that communicates over USB,complying with the IEEE-488.1 and IEEE-488.2 standards.12
General Information – cont’dTable 8-3. <strong>Analyzer</strong> environment and dimensionsDescriptionOperating environmentTemperatureHumidityAltitudeVibrationNon-operating s<strong>to</strong>rage environmentTemperatureHumidityAltitudeVibrationInstrument dimensionsWeight (NET)Supplemental information (nominal)+<strong>10</strong> degC <strong>to</strong> +40 degCRH 20% <strong>to</strong> 80% at wet bulb temp.< 29 degC(non-condensing)0 <strong>to</strong> 2,000 m (0 <strong>to</strong> 6,561 feet)0.21 G maximum, 5 Hz <strong>to</strong> 500 Hz–<strong>10</strong> degC <strong>to</strong> +60 degCRH 20% <strong>to</strong> 90% at wet bulb temp.< 40 degC(non-condensing)0 <strong>to</strong> 4,572 m (0 <strong>to</strong> 15,000 feet)0.5 G maximum, 5 Hz <strong>to</strong> 500 HzSee Figure 8-1, 8-2, 8-3.24.5 kgTable 8-4. EMC, Safety, and WEEEEMCEuropean Council DirectiveISM 1-AICES/NMB-001SafetyISM 1-AWEEE89/336/EEC, 92/31/EEC, 93/68/EECIEC 61326-1:1997 +A1:1998 +A2:2000EN 61326-1:1997 +A1:1998 +A2:2001CISPR 11:1997 +A1:1999 +A2:2002Group 1, Class AEN 55011:1998 +A1:1999 +A2:2002IEC 6<strong>10</strong>00-4-2:1995 +A1:1998 +A2:20014 kV CD / 8 kV ADEN 6<strong>10</strong>00-4-2:1995 +A1:1998 +A2:2001IEC 6<strong>10</strong>00-4-3:1995 +A1:1998 +A2:20013 V/m, 80-<strong>10</strong>00 <strong>MHz</strong>, 80% AMEN 6<strong>10</strong>00-4-3:1996 +A1:1998 +A2:2001IEC 6<strong>10</strong>00-4-4:1995 +A1:2001 +A2:20011 kV power / 0.5 kV <strong>Signal</strong>EN 6<strong>10</strong>00-4-4:1995 +A1:2001 +A2:2001IEC 6<strong>10</strong>00-4-5:1995 +A1:200<strong>10</strong>.5 kV Normal / 1 kV CommonEN 6<strong>10</strong>00-4-5:1995 +A1:2001IEC 6<strong>10</strong>00-4-6:1996 +A1:20013 V, 0.15-80 <strong>MHz</strong>, 80% AMEN 6<strong>10</strong>00-4-6:1996 +A1:2001IEC 6<strong>10</strong>00-4-11:1994 +A1:2001<strong>10</strong>0% 1cycleEN 6<strong>10</strong>00-4-11:1994 +A1:2001This ISM device complies with Canadian ICES-001:1998.Cet appareil ISM est conforme à la norme NMB-001 du Canada.AS/NZS 2064.1Group 1, Class AEuropean Council Directive73/23/EEC, 93/68/EECIEC 6<strong>10</strong><strong>10</strong>-1:2001EN 6<strong>10</strong><strong>10</strong>-1:2001IEC60825-1:1994CAN/CSA C22.2 6<strong>10</strong><strong>10</strong>-1-04European Council DirectiveMeasurement Category IPollution Degree 2Indoor UseClass 1 LEDMeasurement Category IPollution Degree 2Indoor Use2002/96/EC13
General Information – cont’dFigure 8-1. Front viewFigure 8-2. Rear viewFigure 8-3. Side view14
Display FuntionsTable 9-1. Display functions (windows and traces)DescriptionMeasurement windowsUser defi nable windowTrace functionsData tracesTrace mathTitleAu<strong>to</strong> scaleStatisticsMarker functionsData markersMarker searchMarker-<strong>to</strong>Searching rangeTrackingGeneral characteristicsUp <strong>to</strong> 6 windows, and 1 user defi nable window8 data traces and 8 memory tracesDisplay current measurement data and/or memory dataAddition, subtraction, multiplication, or division of trace dataAdd cus<strong>to</strong>mized title <strong>to</strong> each measurement windowTitles are printed on hard copies of displayed measurements.Au<strong>to</strong>matically selects scale resolution and reference value <strong>to</strong> vertically center the trace.Calculates and displays mean, standard deviation, and peak-<strong>to</strong>-peak deviation of the trace.<strong>10</strong> independent markers per trace.Reference marker available for “delta marker” operation.Maximum value, minimum value, peak, peak-left, peak-right, target, target-left,target-right, multi-peak and band markers with user-defi nable bandwidth value.Set, start, s<strong>to</strong>p, center <strong>to</strong> active marker stimulus value.Set reference <strong>to</strong> active marker response value.User defi nablePerforms marker search continuously or on-demand.Data Processing CapabilitiesTable 9-2. Data processing capabilitiesDescriptionGraphical user interfaceLimit-line testData s<strong>to</strong>rageInternal removable HDDFile sharingScreen hard copyAu<strong>to</strong>mationBuilt-in VBA ®Controlling via GPIB or USBControlling via USBTMCLANGeneral characteristicsThe analyzer employs a graphical user interface based on Windows XP ® open OS.There are three ways <strong>to</strong> operate the instrument manually; you can use a hard keyinterface, a <strong>to</strong>uch-screen interface, or a mouse interface.Defi ne the test limit that appears on the display for pass/fail testing.Defi ned limits may be any combination of horizontal or sloping lines and discrete data points.S<strong>to</strong>re and recall instrument states and trace data on 5 GB (user area) internal removablehard disk drive. Instrument states include all control settings and memory trace data.Files on user disk drive (F:) can be accessed from an external Windows ® PCthrough LAN or USB (USB-TMC)Print-outs of instrument data are directly produced on a printer via USB.Applications can be developed in a built-in VBA ® (Visual Basic for Applications) language.The GPIB interface operates with IEEE488.2 and SCPI pro<strong>to</strong>cols. The instrument can be controlled bya GPIB external controller. The instrument can control external devices using a USB/GPIB interface.The USB interface operates with USBTMC and SCPI pro<strong>to</strong>cols. The instrument can be controlled byan external PC using the USB interface with a USB cable.(<strong>10</strong>/<strong>10</strong>0 base-T) Telnet, SICL-LANOptional Application SoftwareTable 9-3. E5001A SSA-J precision clock jitter analysis softwareDescriptionGeneral characteristicsMeasurement functionsRJ (random jitter), PJ (periodic jitter) frequency, PJ decomposition with au<strong>to</strong>-trend correctionMeasurement parametersRJ: rms, PJ: frequency, rms, p-p, d-d,TJ (<strong>to</strong>tal jitter): p-p, jitter trend (phase deviation waveform), jitter his<strong>to</strong>gramJitter spectrum analysis range 1 Hz <strong>to</strong> <strong>10</strong>0 <strong>MHz</strong> (<strong>E5052B</strong>), <strong>10</strong> Hz <strong>to</strong> <strong>10</strong>0 <strong>MHz</strong> (<strong>E5052B</strong> Option 011)15
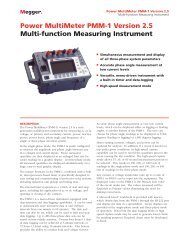
System Performance with the E5053A Microwave DownconverterThe system performance is the combination of the <strong>E5052B</strong> SSA and theE5053A microwave downconverter. All data is typical performance.Table <strong>10</strong>-1. System performance characteristicsDescriptionRF input portInput connec<strong>to</strong>rFrequency rangeInput levelCarrier search rangePhase noise measurementSSB phase noise sensitivityFrequency tracking rangeSpectrum moni<strong>to</strong>r measurementFrequency spanRBW (resolution bandwidth)Level uncertaintyFrequency & RF power measurementFrequency measurement resolutionRF Power measurement uncertaintyTransient measurementWideband frequency rangeNarrowband frequency rangeRF Power measurement uncertaintyPerformance characteristicsAPC-3.5 (female), 50 ohm nominal (E5053A Input)<strong>10</strong> <strong>MHz</strong> <strong>to</strong> 3 <strong>GHz</strong> (<strong>E5052B</strong> RF IN port)3 <strong>to</strong> <strong>26.5</strong> <strong>GHz</strong> (E5053A Input port)3 <strong>to</strong> <strong>10</strong> <strong>GHz</strong> frequency band: fundamental mixing9 <strong>to</strong> <strong>26.5</strong> <strong>GHz</strong> frequency band: third harmonics mixing–15 <strong>to</strong> +20 dBm (<strong>10</strong> <strong>MHz</strong> <strong>to</strong> 3 <strong>GHz</strong>, <strong>E5052B</strong> RF IN port)–30 <strong>to</strong> +<strong>10</strong> dBm (3 <strong>to</strong> <strong>10</strong> <strong>GHz</strong> frequency band)–20 <strong>to</strong> +5 dBm (9 <strong>to</strong> <strong>26.5</strong> <strong>GHz</strong> frequency band)–<strong>10</strong> <strong>to</strong> +<strong>10</strong> dBm (3 <strong>to</strong> <strong>10</strong> <strong>GHz</strong> frequency band)–<strong>10</strong> <strong>to</strong> +5 dBm (9 <strong>to</strong> <strong>26.5</strong> <strong>GHz</strong> frequency band)See Table <strong>10</strong>-2, Figure <strong>10</strong>-2 and Figure <strong>10</strong>-3.1.8 <strong>MHz</strong> (< 4.9 <strong>GHz</strong> carrier in 3 <strong>to</strong> <strong>10</strong> <strong>GHz</strong> frequency band)2.8 <strong>MHz</strong> (> 4.9 <strong>GHz</strong> carrier in 3 <strong>to</strong> <strong>10</strong> <strong>GHz</strong> frequency band)1.3 <strong>MHz</strong> (< <strong>10</strong> <strong>GHz</strong> carrier in 9 <strong>to</strong> <strong>26.5</strong> <strong>GHz</strong> frequency band)2.6 <strong>MHz</strong> (> <strong>10</strong> <strong>GHz</strong> carrier in 9 o <strong>26.5</strong> <strong>GHz</strong> frequency band)15 <strong>MHz</strong> maximum1.53 Hz <strong>to</strong> 400 kHz± 4 dB<strong>10</strong> Hz, 1 kHz, or 64 kHz± 2 dB (<strong>10</strong> <strong>MHz</strong> <strong>to</strong> 3 <strong>GHz</strong>, <strong>E5052B</strong> RF IN port)± 3 dB (low band: 3 <strong>to</strong> <strong>10</strong> <strong>GHz</strong>)± 4 dB (high band: 9 <strong>to</strong> <strong>26.5</strong> <strong>GHz</strong>)Power uncertainty can be improved by applying the ‘user power cal.’ function.50 <strong>MHz</strong> <strong>to</strong> 3 <strong>GHz</strong> (<strong>E5052B</strong> RF IN port)500 <strong>MHz</strong> (E5053A Input port)3.125 kHz, 25 kHz, 200 kHz, 1.6 <strong>MHz</strong>, 25.6 <strong>MHz</strong>, or 80 <strong>MHz</strong>± 2 dB (<strong>10</strong> <strong>MHz</strong> <strong>to</strong> 3 <strong>GHz</strong>, <strong>E5052B</strong> RF IN port)± 3 dB (low band: 3 <strong>to</strong> <strong>10</strong> <strong>GHz</strong>)± 4 dB (high band: 9 <strong>to</strong> <strong>26.5</strong> <strong>GHz</strong>)Power uncertainty can be improved by applying the ‘user power cal.’ function.E5053A microwave downconverter<strong>E5052B</strong> signal source analyzerLO outIF inD-PLLIF outLO inIF amp.RF inRF outADCFFT3 <strong>GHz</strong><strong>to</strong><strong>26.5</strong> <strong>GHz</strong>inputLO inIF outRFRFFundamentalor3rd harmonicmixingIF amp.<strong>10</strong> <strong>MHz</strong><strong>to</strong>3 <strong>GHz</strong>inputRF outRF inADCDSP(correlation)FFTDisplayIF inLO outD-PLLFigure <strong>10</strong>-1. E5053A with <strong>E5052B</strong> simplified block diagram16
E5053A Microwave Downconverter Specifications and General Information Summary – cont’dTable <strong>10</strong>-6. E5053A LO phase noise performancecorrelation = 1, RF input : 0 dBm, start offset frequency : 1 Hz, measurement time = 13 secRF input frequencyOffset frequency [Hz] from the carrier1 <strong>10</strong> <strong>10</strong>0 1 k <strong>10</strong> k <strong>10</strong>0 k 1 M <strong>10</strong> M 40 M3 <strong>GHz</strong> specifi cation – – – –1<strong>10</strong> –116 –113 –127 –140 –140typical –49 –79 –94 –114 –120 –117 –131 –144 –1446 <strong>GHz</strong> specifi cation – – – –<strong>10</strong>4 –1<strong>10</strong> –<strong>10</strong>9 –123 –140 –140Typical –43 –73 –88 –<strong>10</strong>8 –114 –113 –127 –144 –144<strong>10</strong> <strong>GHz</strong> specifi cation – – – –<strong>10</strong>0 –<strong>10</strong>3 –<strong>10</strong>2 –119 –140 –140typical –39 –69 –84 –<strong>10</strong>4 –<strong>10</strong>7 –<strong>10</strong>6 –123 –144 –144SSB phase noise [dBc/Hz]E5053A LO Phase Noise (typical)–20–30–40–50–603 <strong>GHz</strong>–706 <strong>GHz</strong>–80<strong>10</strong> <strong>GHz</strong>–90–<strong>10</strong>0–1<strong>10</strong>–120–130–140–150–1601 <strong>10</strong> <strong>10</strong>0 1k <strong>10</strong>k 1<strong>10</strong>k 1M <strong>10</strong>M <strong>10</strong>0MOffset frequency [Hz]Figure <strong>10</strong>-6. Front viewFigure <strong>10</strong>-5. E5053A LO phase noise (typical) (0 dBm input, start offsetfrequency = 1 Hz, correlation = 1, measurement time = 13 sec.)Web <strong>Source</strong>sFigure <strong>10</strong>-7. Rear viewVisit our <strong>Signal</strong> <strong>Source</strong> <strong>Analyzer</strong> Web site for additionalproduct information and literature.http://www.agilent.com/find/ssaPhase noise measurements;http://www.agilent.com/find/phasenoiseJitter measurements;http://www.agilent.com/find/jitterFigure <strong>10</strong>-8. Side viewRF and microwave accessorieshttp://www.agilent.com/find/accessories19
<strong>Agilent</strong> Email Updates<strong>Agilent</strong> DirectRemove all doubtOur repair and calibration services will get your equipmentback <strong>to</strong> you, performing like new, when promised. You will getfull value out of your <strong>Agilent</strong> equipment throughout its lifetime.Your equipment will be serviced by <strong>Agilent</strong>-trained techniciansusing the latest fac<strong>to</strong>ry calibration procedures, au<strong>to</strong>matedrepair diagnostics and genuine parts. You will always have theutmost confidence in your measurements.<strong>Agilent</strong> offers a wide range of additional expert test andmeasurement services for your equipment, including initialstart-up assistance, onsite education and training, as well asdesign, system integration, and project management.For more information on repair and calibration services, go <strong>to</strong>www.agilent.com/find/removealldoubtwww.agilent.com/find/emailupdatesGet the latest information on the products and applicationsyou select.www.agilent.com/find/agilentdirectQuickly choose and use your test equipment solutions withconfidence.<strong>Agilent</strong>Openwww.agilent.com/find/open<strong>Agilent</strong> Open simplifies the process of connecting and programmingtest systems <strong>to</strong> help engineers design, validate and manufactureelectronic products. <strong>Agilent</strong> offers open connectivity for a broadrange of system-ready instruments, open industry software, PCstandardI/O and global support, which are combined <strong>to</strong> moreeasily integrate test system development.www.agilent.comFor more information on <strong>Agilent</strong> Technologies’ products,applications or services, please contact your local <strong>Agilent</strong> office.The complete list is available at:www.agilent.com/find/contactusPhone or FaxUnited States:Korea:(tel) 800 829 4444 (tel) (080) 769 0800(fax) 800 829 4433 (fax) (080) 769 0900Canada:Latin America:(tel) 877 894 4414 (tel) (305) 269 7500(fax) 800 746 4866Taiwan:China: (tel) 0800 047 866(tel) 800 8<strong>10</strong> 0189 (fax) 0800 286 331(fax) 800 820 2816Other Asia PacificEurope:Countries:(tel) 31 20 547 2111 (tel) (65) 6375 8<strong>10</strong>0Japan: (fax) (65) 6755 0042(tel) (81) 426 56 7832 Email: tm_ap@agilent.com(fax) (81) 426 56 7840Revised: 11/08/06Product specifications and descriptions in this document subject<strong>to</strong> change without notice.© <strong>Agilent</strong> Technologies, Inc. 2007Printed in USA, March 23, 20075989-6388EN