Fiera Milano Presentation
Fiera Milano Presentation
Fiera Milano Presentation
- No tags were found...

You also want an ePaper? Increase the reach of your titles
YUMPU automatically turns print PDFs into web optimized ePapers that Google loves.
<strong>Fiera</strong> <strong>Milano</strong> <strong>Presentation</strong>STAR Conference 2007 – 1H 07 ResultsLondon3 October 2007www.fieramilano.it
DisclaimerData and information herewith set forth are extracted from <strong>Fiera</strong> <strong>Milano</strong>’s 1H report 07 filed with Italian authoritiesregulating exchanges and securities and disseminated concomitantly with this presentation.1H 07 report includes the declaration rendered by Bruno Boffo in his quality as Manager charged with preparing theCompany’s financial reports, in compliance with the requirements of the 2nd paragraph of Article 154/2 of ItalianLegislative Decree no. 58 of February 24th 1998, herewith declares that, to the best of his knowledge, the financialdisclosure contained in the present document corresponds to documentary evidence, corporate books, and accountingrecords.This document has been prepared by <strong>Fiera</strong> <strong>Milano</strong> S.p.A. solely for information purposes and for use in presentations ofthe Group. The information contained herein has not been independently verified. No representation or warranty, expressor implied, is made as to, and no reliance should be placed on, the fairness, accuracy, completeness or correctness of theinformation or opinions contained herein. None of the company, its affiliates, or its representatives shall have any liabilitywhatsoever (in negligence or otherwise) for any loss howsoever arising from any use of this document or its contents orotherwise arising in connection with this document.This document includes forward-looking statements. These forward-looking statements express current expectations andprojections about future events, involve predictions and are subject to a number of factors that may influence the accuracyof the statements and the projections upon which the statements are based. Prospective investors are cautioned not toplace undue reliance on these forward-looking statements because they involve known and unknown risks, uncertaintiesand other factors which are, in many cases, beyond our control. In light of these risks, uncertainties, and assumptions, theforward-looking events discussed in this document might not occur and no assurance can be given that the anticipatedresults will be achieved. Actual events or results may differ materially as a results of risks and uncertainties facing <strong>Fiera</strong><strong>Milano</strong> and its subsidiaries. Such risks and uncertainties include, but are not limited to increased competition andregulatory, legislative and judicial developments that could cause actual results to vary materially from future resultsindicated, expressed or implied in such forward-looking statements. Moreover, any statements regarding past trends oractivities should not be taken as a representation that such trends or activities will continue in the future.This document does not constitute an offer or invitation to purchase or subscribe for any shares and no part of it shall formthe basis of or be relied upon in connection with any contract or commitment whatsoever.By accepting this document, you agree to the foregoing.
AgendaSection 1. <strong>Fiera</strong> <strong>Milano</strong> – An OverviewSection 2. Financial Highlights (1H 07)Section 3. Major events taken in the periodSection 4. Longer-term Outlook FY08-FY11Appendix A. Historical Data3
Section 1<strong>Fiera</strong> <strong>Milano</strong> – An Overview
<strong>Fiera</strong> <strong>Milano</strong> at a glanceThe Group is the leading operator in Italy and one of the leading operators in theWorld in the tradeshow and exhibition industryKey figures (FY as at June 30 th , 2006)Net square metres rented out: 2.0 millionNo. of exhibitions hosted: 88No. of exhibitors: 32,405Activities are concentrated in Italy within 2 sites in the metropolitan area of MilanDivestedAreaTWO VENUESwith a total of470,000 grosssq. metresindoor(+ 60,000 outdoor)<strong>Fiera</strong> <strong>Milano</strong> – An Overview5
<strong>Fiera</strong> <strong>Milano</strong> positioningFirst 3 Exhibition Sitesin ItalyGross IndoorCapacity (Sq.metres)The physical size of<strong>Fiera</strong> <strong>Milano</strong> exhibitionsites is:- the largest in Italy- the 2 nd largest in theWorld(only 5% smaller than the 1 st )1 <strong>Fiera</strong> <strong>Milano</strong> (Two venues) 470,0002 Bologna 180,0003 Verona 122,000First 10 Exhibition Sitesin the WorldGross IndoorCapacity (Sq.metres)1 Hanover 495,0002 <strong>Fiera</strong> <strong>Milano</strong> (Two venues) 470,0003 Frankfurt 322,0004 Barcelona (Montjuic+Gran Vià) 295,0005 Paris-Nord (Villepinte+Le Bourget) 290,0006 Cologne 284,0007 Dusseldorf 252,0008 Valencia 231,0009 Paris Expo 227,00010 Chicago 204,000<strong>Fiera</strong> <strong>Milano</strong> – An Overview6Source: FM, 2007 - AUMA, 2007 and exhibition site websites
The evolution of our missionTO OUR NEW ROLE:TO BE A COMPREHENSIVEPARTNER FOR THE INDUSTRY AS AWHOLE ALSO VIA STRONG & LONG-LASTING ALLIANCES WITH OTHERTRADE FAIR OPERATORS…to provider also ofvalue-addedservices &exhibition andcongress organiserTO BE THE GLOBAL LEADER,OFFERING THE BEST SOLUTIONS &SERVICES TO THE WHOLE RANGE OFOUR CUSTOMERS (ORGANISERS -EXHIBITORS - VISITORS)From simplesquare metresprovider...At thebeginning2000IPODecember2002From2003to 2006OUR FUTURE<strong>Fiera</strong> <strong>Milano</strong> – An Overview7
Our contribution to development & growthScientificand IndustrialResearchScientific resultsPublishingCongressesExhibitionsEventsDisseminating the scientific resultsSharing the scientific resultsApplying the scientific results(from scientific results to products)Creating a brand identityFIERAMILANOGROUP<strong>Fiera</strong> <strong>Milano</strong> – An Overview8
Our economic impact<strong>Fiera</strong> <strong>Milano</strong> total estimated economic impact on Lombardy is €4.3 billion…Agriculture2%Energy3%Construction3%Transport12%Manufacturing16%€4.3bnExhibiting ServicesHotels andcommerce34%39%B2B services and otherservices30%Others0.4%B2B services25%Otherservices2%Logistics3%Telecom1%…of which some €1.9 billion(44% of the total) directlyoriginated by exhibitors andvisitorsHotels andcommerce47%€1.9bnManufacturing6%Construction2%Transport14%Services to people61%<strong>Fiera</strong> <strong>Milano</strong> – An Overview9Source: CERTeT- Bocconi, 2003
The Industry StructureVenue OwnerVenues& RelatedServices(VRS)Space + RelatedServicesFacilityManagerValue AddedServices(VAS)Value Added ServicesExhibition& CongressOrganization(ECO)Organisers Exhibitors VisitorsSpace rented outCommercial RelationshipValue Added Services (i.e. Exhibitions, Stands, Catering, Publishing…)<strong>Fiera</strong> <strong>Milano</strong> – An Overview10
Section 2Financial Highlights(1H 07)
1H 07 Highlights 924,350 net square metres (sq. m) of exhibition space sold of which 42% directlyorganised.Space sold negatively affected (- 29.5% YoY) by the absence of multiannual exhibitionsMostra Convegno Expocomfort, Transpotec, Xylexpo, Grafitalia, and Converflex, despitethe presence of LivinLuce, Enermotive and the first editions of Tuttofood and<strong>Milano</strong>CheckUp.Compared with the 1H 05 - more comparable in terms of the exhibition calendar - netexhibition space sold would have increased by 109,480 sq. m.Consolidated revenues of €163.6m vs. €227.9m in 1H 06 (- 28.2% YoY). Gross Operating Margin (GOM) of €11.7m vs. €52.8m in 1H 06 reflected the lessfavourable exhibition calendar and also the loss of Build UP, Tuttofood and<strong>Milano</strong>CheckUp launched in the first half.1H 07 also reflected the one–off costs from the suspension of some exhibitions in thelaunch phase (Buy&Drive and Bricolare). Net Operating Margin (NOM) of €5.7m vs. €43.4m in 1H 06.Reflects the deterioration of the GOM which was only partially offset by use of provisionsmade in financial statements at 31 12 06 (€1.6m) for exhibitions expected to make lossesin the start-up phase.N.B.: 1H 06 data are not auditedFinancial Highlights (1H 07)12
1H 07 Consolidated FiguresFY endsDec 31 stProfit & Loss (€'000) 1H 06 (*) 1H 07 Change (%)Net Consolidated Revenues 227,946 163,639 -28.2%Gross Operating Margin (GOM) 52,838 11,690 n.m.GOM margin (%) 23.2% 7.1%Net Operating Margin (NOM) 43,361 5,701 n.m.NOM margin (%) 19.0% 3.5%Profit before income tax 44,699 5,744 n.m.Profit before income tax margin (%) 19.6% 3.5%Profit for period from continuing operations 28,168 4,983Profit for period from discontinued operations 768 1,396Profit for period 28,936 6,261 n.m.Profit for period margin (%) 12.7% 3.8%Profit attributable to Minority Interest 6,161 6,379 n.m.Profit attributable to Minority Interest margin (%) 2.7% 3.9%Profit attributable to the Group 22,775 5,960 n.m.Profit attributable to the Group margin (%) 10.0% 3.6%Due to the sale of Eurostands SpA, the results of this Company are shown as “discontinued operations”. Data for same periodin the previous FY have been restated accordingly.(*)Data not audited.Financial Highlights (1H 07)13
1H 07 Financial Breakdown (rounded-off figures)FY endsDec 31 stH1 06 (*) H1 07 Change (%)Total net sqm rented out 1,312,040 100% 924,350 100% -29.5%of which organised by 3rd parties 757,430 58% 534,650 58%of which directly organised 554,610 42% 389,700 42%Revenues (€'000) 227,946 163,639 -28.2%VRS 128,809 95,442VAS 43,421 32,078ECO 116,589 85,708Adjustment for transactions between business segments (60,873) (49,589)Gross Operating Margin (€'000) 52,838 11,690 n.m.% on revenues 23.2% 7.1%VRS 28,640 8,921% on revenues 22.2% 9.3%VAS 3,552 3,140% on revenues 8.2% 9.8%ECO 21,004 (371)% on revenues 18.0% -0.4%Adjustment for transactions between business segments (358) -Net Operating Margin (€'000) 43,361 5,701 n.m.% on revenues 19.0% 3.5%VRS 22,456 5,690% on revenues 17.4% 6.0%VAS 1,618 1,874% on revenues 3.7% 5.8%ECO 19,068 1,713% on revenues 16.4% 2.0%Adjustment for transactions between business segments 219 (3,576)Financial Highlights (1H 07)Due to the sale of Eurostands SpA, the results of this Company are shown as “discontinuedoperations”. Data for same period in the previous FY have been restated accordingly.14(*)Data not audited.
Consolidated Balance SheetFY endsDec 31 stBalance Sheet (€'000) FY at 31 12 06 1H 07(6 months)Non-current assets 201,192 201,575Net working capital (62,087) (55,050)Gross capital employed 139,105 146,525Non-current liabilities (38,544) (37,319)Net capital employed - continuing operations 100,561 109,206Net capital employed - discontinued operations 20,939 1,601Total net capital employed 121,500 110,807Shareholders' equity 93,687 96,269Net financial position (cash) (*) - continuing operations 10,888 14,538Net financial position (cash) - discontinued operations 16,925 -Total Net financial position (cash) (*) 27,813 14,538(*) They include short-term cash investments made with leading insurance companiesDue to the sale of Eurostands SpA, the results of this Company are shown as “discontinued operations”.Financial Highlights (1H 07)15
Consolidated Net Financial PositionFY endsDec 31 stConsolidated Net Financial Position (€'000) FY at 31 12 06 H1 07(6 months)Cash 14,592 15,627Other cash equivalents - -Securities held for trading - -Cash & cash equivalents 14,592 15,627Current financial assets (*) 92,789 59,735Current bank borrowings 92,011 68,784Current portion of non-current debt 5,869 5,952Other current financial liabilities 6,070 (586)Current financial debt 103,950 74,150Current net financial debt (cash) (3,431) (1,212)Non-current bank borrowings 18,579 15,743Debt securities on issue (4,275) -Other non-current (receivables)/liabilities 15 7Non-current net financial debt (cash) 14,319 15,750Net financial debt (cash) of continuing operations 10,888 14,538Net financial debt (cash) of discontinued operations 16,925 -Total net financial debt (cash) 27,813 14,538(*) They include short-term cash investments made with leading insurance companiesDue to the sale of Eurostands SpA, the results of this Company are shown as “discontinued operations”.Financial Highlights (1H 07)16
Section 3Main actions taken in the period
Main actions taken in the periodOUR AIMSEnhance the value of the existingportfolio of exhibitions directly organisedby the Group with- acquisition of trademarks currently notownedACTIONS<strong>Fiera</strong> <strong>Milano</strong> Foundation agreed to the sale ofexhibition trademarks to <strong>Fiera</strong> <strong>Milano</strong>, in particularMacef.- start-up/enhancement of exhibitions- sale of trademarksSTART UP of Build UP, Tuttofood and<strong>Milano</strong>CheckUp;<strong>Fiera</strong> <strong>Milano</strong> Foundation will support new initiativeswith some €4.2m.DRAFT AGREEMENT WITH FIERA ROMA for theorganisation in Rome of a new annual B2B exhibitiondedicated to homeware (first ed. June 2008, with aYear-1 target of some 18,000 sq.m of exhibitionspace).SALE OF BUILD UP EXPO effective as fromSeptember 21st 2007.The price of €3m will be paid in three instalments of€1m each (December 1st 2007, 2008, and 2009).Main actions taken in the period18
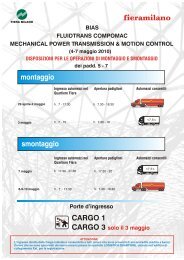
Main actions taken in the period (cont)OUR AIMSACTIONSStrengthening Groupinternationalisation also viaacquisitions of exhibitionsThe text of the agreement with DEUTSCHE MESSEOF HANOVER was finalised, reflecting the contentpreviously agreed.Closing date: expected within the first half ofNovember 2007.Increase our presence in the congresssector and in technical publicationsaccentuating our mission as aspecialised & full-service provider forour customersPURCHASE OF VNU two company branches i.e.- “exhibitions” for €2.5m:Bias, the benchmark exhibition in Italy for factoryautomation, process control, and measuringequipment, andFLUIDTRANS COMPOMAC, leading exhibition inItaly and global No.2 in the oil hydraulic,pneumatic, and fluid power sector.- "trade press“, for €2.3m (7 technical publications).Main actions taken in the period19
Section 4Longer-term Outlook FY08- FY11
Outlook for FY08- FY11 - Net Sq. m to be rented outFY ends Forecasts for FY07 point to approximately 1.7 million net square metres ofexhibition spaceDec 31 st 1.3 Annual exhibitions:1.4m sq. m onaverage Biennialexhibitions: 0.5msq. m per year0.00.51.82.10.30.41.90.00.52.00.10.5 Multiannualexhibitions willpeak in 2009:Triennial and EMO.1.41.41.40FY08E FY09E FY10E FY11EAnnual Biennial MultiannualLonger-term Outlook FY08-FY1121
Outlook for FY08- FY11 - Expected GOM (€m)FY endsDec 31 st2007 consolidated gross operating margin (GOM) expected, as of today, to be approximatelybreakeven, confirming estimates given in the 2007-2011 Industrial Plan, despite higher lossesincurred for new events and cancellation of exhibitions and thanks to the identification andspeedier implementation of additional actions to regain profitability.2009-2011 average GOM expected equal to €54m (11.4% of sales)11.4%54147.8%311040210FY08EAverageFYs 09-11EExisting activities Action on exhibition portfolio + external growth GOM Margin %Longer-term Outlook FY08-FY1122
Appendix AHistorical Data
Net Sq. Metres rented out – Frequency (Rounded Figures)(Data in ‘000)FY ended June 30 th FY endDec 31 st1,648.5 1,632.7 1,704.8 1,373.9 2,011.3608.5179.914.7191.7144.2609.3540.3366.9504.88.1305.81,093.51,074.11,055.81,060.01,222.120.5106.9481.1FY02 FY03 FY04 FY05 FY06Annual Biennial Multiannual6M FYat 31 12 06Appendix A24
Net Sq. Metres rented out – Directly Organised vs. Hosted Exhibitions(Data in ‘000)1,648.5FY ended June 30 th FY endDec 31 st1,632.7 1,704.8 1,373.9 2,011.3 608.531%22%30%43% 42%33%69%78%70%57%58%67%Appendix AFY02 FY03 FY04 FY05 FY06 6M FYat 31 12 06% net sq. metres organised by 3rd parties % net sq. metres directly organised25
Consolidated Revenues(Data in €m)FY ended June 30 thFY endDec 31 st375.0291.6 261.7175.7141.4219.154.7116.9119.8108.9106.378.5141.4174.7226.8132.5192.147.726.10(10.3)(52.1)(69.1)(101.7)60.7(28.2)FY02IT GAAPFY03IT GAAPFY04IT GAAPFY05IFRSVRS+VAS VRS VAS ECO I/C AdjustmentsFY06IFRS6M FYat 31 12 06IFRSAppendix A26
Consolidated Gross Operating Margin(Data in €m)19.5% FY ended June 30 th16.3%16.0%FY endDec 31 st13.8%56.813.0%59.935.822.434.126.719.48.914.08.019.426.934.47.312.825.8(22.8)0(0.5)(18.5)-21.4%(0.1)(4.1)(0.1)Appendix AFY02IT GAAPFY03IT GAAPFY04IT GAAPFY05IFRSVRS+VAS VRS VAS ECO I/C Adjustments27FY06IFRSMARGIN %6M FYat 31 12 06IFRS
Consolidated Net Operating Margin(Data in €m)12.1% FY ended June 30 th11.4%FY endDec 31 st8.2%8.7%35.38.4%42.819.217.921.923.7011.711.74.914.317.411.31.59.10.818.20.1(40.1)3.9(23.5)-37.7%(7.3)(13.2)Appendix AFY02IT GAAPFY03IT GAAPFY04IT GAAPFY05IFRSVRS+VAS VRS VAS ECO I/C Adjustments28FY06IFRSMARGIN %6M FYat 31 12 06IFRS
Favorable Payment CycleMain financial features of the contractual agreements with organisers are:standard contracts guarantee (minimum guaranteed)significant advance paymentstreasury management service to organisersAdvance Payments(minus FM fees)FM SPAOrganisersAdvance payments12 months for biennial)InvoiceExhibitorsCommercial relationship(on avg. 6 months for annual,Appendix A29
Negative Net Working CapitalA feature of the Group is its structural negative NWC(Data in €m)FY at30 06 05after taxes1Q at30 09 05before taxes2Q at31 12 05before taxes3Q at31 03 06before taxesFY at30 06 06after taxes1Q at30 09 06before taxes6M FY at31 12 06after taxes1Q at31 03 07before taxes1H at30 06 07after taxes(43.4)(53.4) (55.1)(69.5)(66.8)(71.5) (73.4)(62.1)(87.7)Appendix AFY ended June 30 th30FY ends Dec 31 st(Data are in accordance with IAS/IFRS)
For further information, please contact:IR Department<strong>Fiera</strong> <strong>Milano</strong> SpAStrada Statale del Sempione, 2820017 Rho (<strong>Milano</strong>) - ITALYTel: + 39 02 4997.7816/7911E-mail: investor.relations@fieramilano.itwww.fieramilano.it