Presentation by Saori Dubourg - BASF Asia Pacific
Presentation by Saori Dubourg - BASF Asia Pacific
Presentation by Saori Dubourg - BASF Asia Pacific
- No tags were found...

Create successful ePaper yourself
Turn your PDF publications into a flip-book with our unique Google optimized e-Paper software.
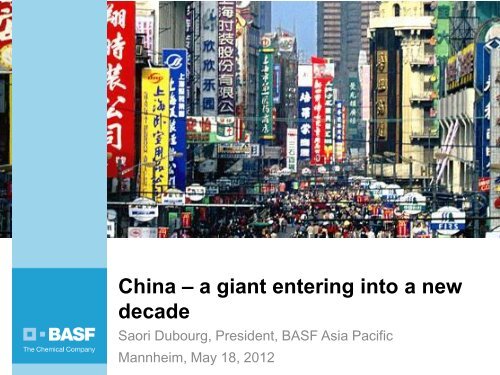
China – a giant entering into a newdecade<strong>Saori</strong> <strong>Dubourg</strong>, President, <strong>BASF</strong> <strong>Asia</strong> <strong>Pacific</strong>Mannheim, May 18, 2012
1 | <strong>Asia</strong> <strong>Pacific</strong> and China2 | China’s economic development3 | People and society4 | Ecology and environment2
<strong>Asia</strong> has biggest impact on worldwidedemandPopulation (M)8000Population in <strong>Asia</strong>CAGR(90-10)(10-25E)6000+62%<strong>Asia</strong>-<strong>Pacific</strong>1.3% 1.0%4000+63%+63%+8%+9%+6%+6%+6%20000+7%+10%+6%+7%+8%+6%+10%+6%+7%+9%Europe UnionLatin AmericaNorth AmerciaM. East & N. AfricaSub-Saharan Africa0.4% 0.3%1.5% 1.1%1.1% 1.0%2.1% 0.8%2.4% 2.1%20252020201520102005200019951990Note: 2015-2025 growth based on 2010-2015 growth p.a.Source: EIU; BCG analysis
<strong>Asia</strong> is already the world’s largestchemical marketChemical demand (excluding pharma)2010€2,000billion<strong>Asia</strong> <strong>Pacific</strong> 41%€800 billion6.5% p.a.<strong>Asia</strong> <strong>Pacific</strong> 49%€1,500 billion2020€3,100billion<strong>Asia</strong> <strong>Pacific</strong> 41%Western Europe 23%North America 20%South America 9%Rest of world 7%<strong>Asia</strong> <strong>Pacific</strong> 49%Western Europe 20%North America 16%South America 8%Rest of world 7%Source: <strong>BASF</strong>, real figures (base 2010)4
<strong>Asia</strong>n companies are rising in relevanceNo. of <strong>Asia</strong> <strong>Pacific</strong> companies on world Fortune 500 listCAGR('05-'25e)250200+3%924615104ASEANANZIndiaKorea2.4%-0.1%6.3%-0.9%150100509111288136810155714858150JapanChina-2.2%15.2%01820055420102025eChina is becoming a majorsource of new Fortune 500companiesNote: Projection based on GDP growthSource: Fortune global 500 company list, BCG analysis
<strong>Asia</strong>n players are catching up ininnovationLower cost position mainly due tocheap laborBut increasing number of disruptiveinnovations from local companiesWage (k USD / month)642-96%-94%-91%"Copy cats"IncrementalimprovementReverse engineer MNC's productand copy• Usually at much lower costModify slightly to better suittarget customer segment• Usually modify or add smallfeatures0ASEAN2005 20102025IndiaChinaGermanyUKUSIndigenousinnovationLocalized R&D rooted in deepunderstanding of local needs• Less common in localcompanies in developing APcountriesSource: EIU, Expert interview, Lit research, prepared <strong>by</strong> BCGExample: Chevy Spark vs. CheryChevy sparkChery QQImprovement over Spark• "Smiling face" frontlook• More accessories• Anti-theft system• Lower price
Multinationals shift to local R&DProjected R&D spend of top 184 spending companies in 2020Domestic spending 2020, CAGR 2007-2020CanadaUnited StatesDenmarkSwedenFinlandNetherlandsU.K.Belgium PolandIrelandGermany CzechHungryFranceSerbiaAustriaSwitzerlandChinaRussiaJapan€1bn€3bn€15bn€25bnMexicoBrazilSpainItalyIsraelEgyptIndiaThailandTaiwanVietnamPhilippinesMalaysiaSingaporeAustralia~ €190bn~ 6% CAGR~ €200bn~ 6% CAGR~ €240bn~ 9% CAGRSource:Booz & Company
China’s 12 th Five Year Plan acceleratesdevelopmentShifting the focusRestructuringthe economyExport driven economy domesticinnovation and consumptionImprovingsocial equalityCountry prosperity individual prosperityProtectingthe environmentHigh energy consumption low carbonemission
Measures will have implications forbusinessNew markets, balance of private and State-owned• China globalizes: attract FDI, M&A• State support of new markets, sectors, innovations• Modernize industrial structures, focus on Western ChinaIncreasing need to focus on public impact• Resistance towards environmental burden through industry• Salary development, quality of life• Employment, relocationEnvironmental protection & sustainable development• Energy efficiency / climate protection, water management• Regulation, enforcement, EIAs• Biodiversity protection and land use
1 | Context <strong>Asia</strong> <strong>Pacific</strong>2 | China’s economic development3 | People and society4 | Ecology and environment11
Greater China drives the <strong>Asia</strong>-<strong>Pacific</strong>economyGDP (USD Tn)40302010019901995<strong>Asia</strong> <strong>Pacific</strong> GDP growth (real GDP)200020052010Forecast201520202025ChinaIndiaJapanSouth KoreaASEANAustralasia1. <strong>Asia</strong> covers Greater China, Japan, ASEAN, India, and South KoreaNote: Real GDP as 2010 USD fixed exchange rate; Middle class and next billion defined as $3-25k HH incomeSource: Euromonitor; BCG analysisCAGR(90-10)(10-25E)9% 8%6% 9%0% 1%6% 4%6% 6%3% 2%Drivers for <strong>Asia</strong>-<strong>Pacific</strong> GDP growth• Urbanization– Urban populationincrease 2-3% p.a.(2010-2025)• Rise of middle-classand "Next BillionConsumers"– ~80% of HH indeveloping countriestill 2025• Growing population– ~60% of globalpopulation– Higher than globalaverage growth rate• Emerging strong localplayers
China will be the world’s largest chemicalproducer <strong>by</strong> 2020Global chemical production (excl. pharma)Trillion $ (real 2005)3.02.5~3.1World2.01.51.00.50~1.30.90.4~2.1~1.41.1~1.21.0~45%~40%1995 2010 2015~1.8~1.32020~50%Developed markets*Emerging marketsThereof China*<strong>BASF</strong> definition: Developed markets include EU15, Norway, Switzerland, North America, Japan, Australia, New ZealandSource: Feri, <strong>BASF</strong>
„000 cars„000 carsChina is a large consumer but not alwaysof domestic productionGlobal car sales (total)China car sales (top brands)ChinaForeignW. EuropeUSAChinaSource: <strong>BASF</strong>
China is a large consumer but not alwaysof domestic production• Photovoltaics are key focus area of FYP• China is #1 manufacturer of photovoltaiccells• Domestic power companies in China still donot install substantial photovoltaic capacityProduction (megawatt) Installed capacity (megawatt), 2011Source: Earth Policy Institute15
Fast growth leads to accelerated portfoliomanagementStart-up / PlannedNew capacities• Verbund site, Nanjing• Dispersions & PigmentsHuizhou• Intermediates Lab, Shanghai• Innovation Campus, Shanghai• Cellasto plant, Shanghai• PU System House, Tianjin• MDI Plant, Chongqing• Cationic monomers, Nanjing• Mining solutions, Ji„ning• Battery materials, SuzhouSelected transactions2008 to date<strong>BASF</strong>corebusinessesRight balance• 100% investment• Joint ventures• M&A• PartnershipsClosures / SaleExisting capacities• Process Catalysts, Nanjing• Admixture, Suzhou• Effect Pigments, Wenzhou• Second generation concreteadmixtures16
Phased approach will capture potentialof emerging provinces in ChinaNingxiaGansuShaanxiSichuanSichuanChongqingInnerMongoliaHebeiHebei Hebei LiaoningBeijing TianjinHenanAnhui ShanghaiHubeiHunanJiangxiJiangxiFujianKey facts• Upside potential> €200 million sales throughincreased penetration ofemerging provinces• <strong>BASF</strong> will target inland citiesand provinces in a phasedapproach• Higher business penetration inChina following Statedevelopment measures – GoWest CampaignHong Kong17
<strong>BASF</strong> innovates in <strong>Asia</strong> for <strong>Asia</strong>• 8 R&D sites plus technical centersin <strong>Asia</strong> <strong>Pacific</strong>• R&D experts to increase to morethan 800 <strong>by</strong> 2020• €55 million investment includesinnovation campus and GreaterChina head office• Leverage global R&D capabilitieswith Competence Centers inSingapore, India and China• Co-operations with ~100 institutesand universities<strong>BASF</strong>’s new innovation campus in Shanghai
1 | Context <strong>Asia</strong> <strong>Pacific</strong>2 | China’s economic development3 | People and society4 | Ecology and environment19
Competition for limited labor supplyDemand grows while supply remains stagnantLabor force 1 (Mn)2,00014671,5006522 12+1%63168328825 14+1%6019773742417ANZKoreaJapanASEANCAGR('10 – '25e)1.7%- 0.3%- 0.5%2.6%1,000234392478675India3.5%500743815827China0.1%0200020102025e1.Total labor force, including employed and unemployedSource: EIU, BCG analysis
Pay gap between China and the West isclosingUS$ p.a.Middle Manager Salaries• Heavycompetition forlimited pool ofexperiencedlocal managers• Salary and jobgrade inflation2020Source: ECA International´s Salary Trends Survey
Huge talent pool but availability forMNCs is uncertain15.73 mn.Uni graduatesNot suitable foremployment <strong>by</strong>MNCs0.39 mnNot accessible dueto e.g. immobility815.000 Practical availabilityFigures: Adapted from McKinseyTitle & photo: Li Yuan Wu, Roskilde University
Need for active talent development• <strong>BASF</strong>: 5,000 new positions addedbetween 2009-2020 (includingreplacements, up to 20,000recruits)• Launched package of careerdevelopment initiatives in 2010• International careeropportunities for localemployees• GROW program for freshgraduates
China’s soft power is growing abroad• Development of localbrands intointernational marketsViews of countries’ positive influence: China vs. EU vs. USAAverage 21 tracking countries, 2011-2012• Rise in Chinesetourism abroad• Improved perceptionof China‟s positiveinfluenceNote: for China and the US, average ratings exclude the target country's rating of itself*Average of 22 countriesAsked half of sampleSource: 2012 Country Ratings Poll, GlobeScan/PIPA
• Expanding civil societyIncreasing societal expectations at home• Several thousand grassrootsNGOs, >400,000 “GONGOs”• 180,000 protests / massincidents in 2010• Public – private partnerships• Growing expertise of local activists• Issues: relocation, environmentalimpact, social issues• Political uncertainty
Solutions come from open dialogue• Open dialogue with interest groupscontributes to <strong>BASF</strong>‟s long termsuccess• Projects and partnershipsstrengthen <strong>BASF</strong>‟s relationshipwith customers, neighbors,partners, shareholders and society• 80+ Community Advisory Panelsat production sites around theworld to promote close dialoguewith neighbors
Best practices for addressing societaldemands1. Focus on transparency and long termcommitment to the country2. Create a reliable local employee base3. Choose partners, suppliers andcustomers with a long-term strategicfocus4. Concentrate investments in areas ofcompetitive advantage5. Establish solid relationships with theauthorities to obtain the essential buy-inof the government
Societal change also creates opportunityChina megatrends …… lead to:Market needsIncrease of disposable incomedue to economic growthGrowing demand for meatEnsure higheryields for farmsRapid urbanizationLabor drain in the country sideNeed for more efficiency inagriculture bigger farms and mega farmsProvide high nutritionalvalue productsTraceability & food safety afternumerous scandalsSustainability andfight against pollutionConvenience and ready-to-eatproductsMore innovation,global brand owners setstandards,but local tastes need to beunderstood and metNeed for increased standardsand better enforcement,improved packaging and labelingFocus on Food Safety
1 | Context <strong>Asia</strong> <strong>Pacific</strong>2 | China’s economic development3 | People and society4 | Ecology and environment29
China will focus intensely onenvironmental issuesCoal consumption <strong>Asia</strong> <strong>Pacific</strong> (led <strong>by</strong> China)• Aggressive carbon intensitygoals despite increasingenergy use (mostly coalfired)• Natural resources (water,land, air) are also at riskCarbon intensity goals <strong>Asia</strong> <strong>Pacific</strong> (led <strong>by</strong> China)Improve Amount ByChina Carbon intensity 40-45% 2020India Carbon intensity 20-25% 2020Korea Energy intensity 45% 2030• China is developing morestringent regulatoryrequirements, productregistration, andtransparency ofenvironmental impactassessmentsJapan Energy efficiency 30% 2030
<strong>BASF</strong> maintains global standards inChinaResponsible Care ®Voluntary worldwideinitiative with the goalto make steadyimprovements withrespect to environment safety healthKey areas of Responsible Care• Environmental Protection• Process Safety• Emergency Response• Product Stewardship• Occupational Health• Occupational Safety• Transport and Distribution Safety• Communication• Security
Emissions control is core to businessoperations• <strong>BASF</strong> in Greater China• Greenhouse gas emissions down <strong>by</strong>3.6% yoy• Water consumption stable• 64% of waste recycled• Verbund site Nanjing• Efficient design re-uses production<strong>by</strong>products to create stable energy use• Water consumption stable**• 93.7% of waste recycled**• Example <strong>BASF</strong> Group*** level: since 1990,greenhouse gas emissions reduced <strong>by</strong>42% despite production increase of 126% *Source: <strong>BASF</strong> in Greater China – Report 2010**Source: <strong>BASF</strong>-YPC Report 2010***<strong>BASF</strong> Group without Wintershall
• Design plants tominimize waterconsumptionespecially in waterstressed areas• Active managementof rainwater andfirefighting water• Onsite watertreatment beforeentering chemicalpark waste waterpipelineWater protection included throughoutproduction cycle
Rejected Energy151.6Useful Energy169.4Extensive energy waste puts efficiency inthe spotlightHydro6.4(2.0%)Biomass6.7(2.1%)Geothermal2.6(0.8%)Wind1.4(0.4%)Solar0.1(0.03%)Nuclear15.2(4.7%)ElectricityGeneration119.54Residences34.4Commerce &Government18.1Coal88.2(27.5%)Nearly 50% of all energyis wasted, most of itnon-renewableIndustry137.5Natural Gas87.5(27.3%)Lt. DutyVehicles 25.1Med / Hvy DutyVehicles 24.9Oil113.0(35.2%)Airlines9.62030 World Energy Flow ~320 mmbd(equiv.)
Market opportunities expanding forenergy efficient building materialsConventional construction3.4 tons of coal per household/yearInsulated with Neopor ®1.1 tons of coal per household/year20.3mtons of coal/yearin ShanghaiSource: OECD/IEA Estimates: 6 million urban households in Shanghai*Source: Dept. of Energy, EPA, 1999.6.8mtons of coal/yearin ShanghaiSavings*‣13.5 million tons of coal‣~34 million tons of CO 2emissions p.a. in Shanghai
Fuel inefficiency creates market forenergy efficient carsPower train efficiency20.4 %5559 kJ19.3 %5243 kJ18.5 %5031 kJ17.6 %4779 kJ17.0 %4629 kJovercomedriving resistance100 %27185 kJmileage:7.9 l/100km316 kJ79.6 %generator212 kJclutch252 kJgear150 kJcardan shaftsgrinding brakeswheel baring478 kJ21626 kJAbout 80% of a car‟s fuel energy islost as heatmotoric lossSource: VW
Energy efficient cars need plastics andother solutionsSolutions for automotive energy efficiency from the world of chemistry –replacing metal with plasticEngine mountStructuralinsertsFront endcarrierLower bumperstiffenerConceptseatCross beamOil panEvery 100 kg weight reduction cuts fuel consumption <strong>by</strong>0.4 l/100 km and CO 2 emissions <strong>by</strong> 1 kg/100 km
Sustainability is part of the R&D pipelineas well• Screening tool for innovation projects• Questionnaire with level of detail dependingon innovation type and phase• Quick check to find out about possiblestrengths or weaknesses regardingsustainability (e.g. alternative use of rawmaterials, improved value proposition)• Trigger for detailed analysis of selectedcriteriaNeopor® insulation materialStyrodur® insulation material
Sustainability and prosperity go hand inhand• Sustainability:balance economy,ecology, societyReference Korea: sustainability correlates with performance• Solutions andglobal know-how• Sharing bestpracticesinternationallySource: Solability 2008
19/10/201142