QI Tools Root Cause Analysis - Iowa Department of Public Health
QI Tools Root Cause Analysis - Iowa Department of Public Health
QI Tools Root Cause Analysis - Iowa Department of Public Health
- No tags were found...
Create successful ePaper yourself
Turn your PDF publications into a flip-book with our unique Google optimized e-Paper software.
<strong>QI</strong> <strong>Tools</strong><strong>Root</strong> <strong>Cause</strong> <strong>Analysis</strong>Shaela Meister, MPA<strong>Iowa</strong> <strong>Department</strong> <strong>of</strong> <strong>Public</strong> <strong>Health</strong>
• Problem Solving• Treating the Symptom vs. Treating the<strong>Cause</strong>• Symptom – sign or indication• <strong>Cause</strong> – what actually makes somethinghappen<strong>Root</strong> <strong>Cause</strong> <strong>Analysis</strong>
• Addressing the symptom instead <strong>of</strong> thecause leads to a temporary or partial fix• Problem will occur again• Can create more problems unintentionally• Address the problem at its cause(s) ismore efficient and effective“Avoid the bandaid approach!”<strong>Root</strong> <strong>Cause</strong> <strong>Analysis</strong>
• Identifies & categorizes issues• Organizes ideas• Shows relationships• Reveals potential problems• Facilitates process understanding• Easy to use• Useful reporting toolBenefits
• Fishbone Diagram• <strong>Cause</strong> and Effect Diagram• Ishikawa Diagram<strong>QI</strong> Tool
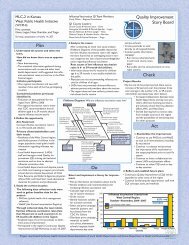
• Why use a fishbone diagram?◦ To allow a team to identify, explore, andgraphically display – increasing detail – all <strong>of</strong>the possible causes related to a problem orcondition to discover its root cause(s).• What does it do?◦ Enable a team to focus on the content <strong>of</strong> theproblem versus the history <strong>of</strong> the problem orpersonal interests <strong>of</strong> the team.◦ Creates a snapshot <strong>of</strong> the collective knowledgeand consensus <strong>of</strong> a team around a problem◦ Focuses the team on causes, not symptoms.Fishbone Diagram
Fishbone Diagram
• Construct your problem statement on theright-hand side within your “fish head”• This problem statement is known as theeffect• An arrow or “fish spine” should pointtowards the problem statementFishbone – Problem Statement
Fishbone – Problem Statement
• Decide what your main causes <strong>of</strong> theproblem are• Use these as the headers• Arrows should connect the headers to thespine• Examples <strong>of</strong> headers:◦ Manpower, Machinery, Materials, Methods(4 M’s)◦ People, Plant, Procedures, Policies◦ Lifestyle, Environment, FormsFishbone – Major <strong>Cause</strong>s
Fishbone – Major <strong>Cause</strong>s
• Use the 5 whys• Continuing to ask why can help ensurethat you don’t focus on “low hanging fruit”• Symptoms may returnFishbone – Sub-<strong>Cause</strong>s
Fishbone – Sub-<strong>Cause</strong>s
Highest-Level <strong>Cause</strong> – ROOT CAUSEHigher-Level <strong>Cause</strong>First-Level <strong>Cause</strong>Visible ProblemSymptomsFishbone – 5 Why’s Technique
Fishbone – Detailing 5 Why’s
• It is an easy exercise to use and apply• Helps you avoid the low-hanging fruit• Can help you find the root causeFishbone – 5 Why’s Advantage
• The 5 Why’s may not lead to a root causeidentification when the cause is ultimatelyunknown• The problem may have more than onecause• The 5 Why’s method is dependent uponthe skill level <strong>of</strong> how it is applied to theanalysis• The method is not necessarily repeatable• It has difficulty distinguishing betweencausal factors and root causesFishbone – 5 Why’s Limitations
• Choose the items you want to focus on◦ Looks for causes that repeat within the majorcategories◦ Choose causes that the team can control orinfluence◦ Select through consensus◦ May need to use other tools suchas check forms or surveys andother data collection<strong>Root</strong> <strong>Cause</strong> <strong>Analysis</strong> – Next Steps
<strong>Root</strong> <strong>Cause</strong> <strong>Analysis</strong> Rating Form
<strong>Root</strong> <strong>Cause</strong> <strong>Analysis</strong> Rating Form
<strong>Root</strong> <strong>Cause</strong> <strong>Analysis</strong> Rating Form
• Things to remember◦ Work on the cause – NOT the symptoms orlow-hanging fruit◦ Fishbone diagram is useful for identifying rootcauses◦ Use the 5 why’s◦ The <strong>Root</strong> <strong>Cause</strong> <strong>Analysis</strong> Rating Form can helpdetermine which is the most important causeto work onWrap Up


