Rhode Island - Building Energy Codes
Rhode Island - Building Energy Codes
Rhode Island - Building Energy Codes
- No tags were found...

Create successful ePaper yourself
Turn your PDF publications into a flip-book with our unique Google optimized e-Paper software.
BUILDING TECHNOLOGIES PROGRAM<strong>Rhode</strong> <strong>Island</strong><strong>Energy</strong>and CostSavingsfor NewSingle- andMultifamilyHomes:2012 IECC asCompared tothe 2009 IECC1 2012 IECC AS COMPARED TO THE 2009 IECC
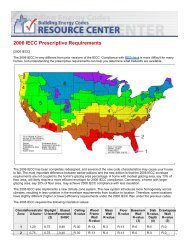
<strong>Rhode</strong> <strong>Island</strong> <strong>Energy</strong> and CostSavings for New Single- andMultifamily Homes: 2012 IECC asCompared to the 2009 IECCFigure 1. <strong>Rhode</strong> <strong>Island</strong>Climate ZonesThe 2012 International <strong>Energy</strong>Conservation Code (IECC) yieldspositive benefits for <strong>Rhode</strong> <strong>Island</strong>homeowners.Moving to the 2012 IECC from the 2009 IECC is cost-effectiveover a 30-year life cycle. On average, <strong>Rhode</strong> <strong>Island</strong> homeownerswill save $11,011 with the 2012 IECC.Each year, the reduction to energy bills will significantly exceedincreased mortgage costs. After accounting for up-front costs andadditional costs financed in the mortgage, homeowners shouldsee net positive cash flows (i.e., cumulative savings exceedingcumulative cash outlays) in 1 year for the 2012 IECC. Averageannual energy savings are $629 for the 2012 IECC.2 2012 IECC AS COMPARED TO THE 2009 IECC
HighlightsCost-effectiveness against a 2009 IECC baseline:• Life-cycle cost savings, averaged across buildingtypes, are $11,011 for the 2012 IECC• Simple payback period is 2.6 years for the 2012 IECCConsumer savings compared to a 2009 IECC baseline:• Households save an average of $629 per year onenergy costs with the 2012 IECC• Net annual consumer savings including energysavings, mortgage cost increases, and otherassociated costs in the first year of ownership,average $531 for the 2012 IECC• <strong>Energy</strong> costs, on average, are 27.5% lower forthe 2012 IECCCost-EffectivenessThe U.S. Department of <strong>Energy</strong> (DOE) evaluates the energycodes based on three measures of cost-effectiveness:• Life-Cycle Cost: Full accounting over a 30-yearperiod of the cost savings, considering energysavings, the initial investment financed throughincreased mortgage costs, tax impacts, and residualvalues of energy efficiency measures• Cash Flow: Net annual cost outlay (i.e., differencebetween annual energy cost savings and increasedannual costs for mortgage payments, etc.)• Simple Payback: Number of years required forenergy cost savings to exceed the incremental firstcosts of a new codeLife-cycle cost is the primary measure by which DOEassesses the cost-effectiveness of the IECC. These savingsassume that initial costs are mortgaged, that homeownerstake advantage of the mortgage interest deductions, andthat long-lived efficiency measures retain a residual valueafter the 30-year analysis period. As shown in Table 1,life‐cycle cost savings average $11,011 for the 2012 IECC.Table 1. Average Life-Cycle Cost Savings from Compliance with the 2012 IECC, Relative to the 2009 IECCLife-Cycle CostSavings ($)Net PositiveCash Flow (Years)Simple Payback(Years)2012 IECC $11,011 1 2.62012 IECC AS COMPARED TO THE 2009 IECC3
Technical Appendix AMethodologyAn overview of the methodology used to calculate these impacts is provided below. Further information as tohow these estimates were developed is available at the U.S. Department of <strong>Energy</strong>’s (DOE) <strong>Building</strong> <strong>Energy</strong><strong>Codes</strong> website. 1Cost-EffectivenessPacific Northwest National Laboratory (PNNL) calculated three cost-effectiveness metrics in comparing the 2012International <strong>Energy</strong> Conservation Code (IECC) and the 2009 IECC. These are:• Life-Cycle Cost (LCC): Full accounting over a 30-year period of the cost savings, considering energysavings, the initial investment financed through increased mortgage costs, tax impacts, and residualvalues of energy efficiency measures• Cash Flow: Net annual cost outlay (i.e., difference between annual energy cost savings and increasedannual costs for mortgage payments, etc.)• Simple Payback: Number of years required for energy cost savings to exceed the incremental first costsof a new codeLCC is a robust cost-benefit metric that sums the costs and benefits of a code change over a specified timeperiod. LCC is a well-known approach to assessing cost-effectiveness. DOE uses LCC for determining the costeffectivenessof code change proposals, and for the code as a whole, because it is the most straightforwardapproach to achieving the desired balance of short- and long-term perspectives.The financial and economic parameters used for these calculations are as follows:• New home mortgage parameters:o 5.0% mortgage interest rate (fixed rate)o Loan fees equal to 0.7% of the mortgage amounto 30-year loan termo 10% down payment• Other rates and economic parameters:o 5% nominal discount rate (equal to mortgage rate)o 1.6% inflation rateo 25% marginal federal income tax and 4.75% marginal state income taxo 0.9% property taxo Insulation has 60-year life with linear depreciation resulting in a 50% residual value at the end ofthe 30-year periodo Windows, duct sealing, and envelope sealing have a 30-year life and hence no residual value atthe end of the analysis periodo Light bulbs have a 6-year life and are replaced four times during the 30-year analysis period<strong>Energy</strong> and Economic AnalysisThis analysis determined the energy savings and economic impacts of the 2012 IECC compared to the 2009 IECC.<strong>Energy</strong> usage was modeled using DOE’s <strong>Energy</strong>Plus software for two building types:1 www.energycodes.gov/development/residentialA.1 April 2012
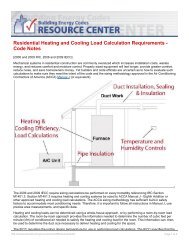
Table A.4.Comparison of Major Requirements That Do Not Vary by Climate ZoneRequirement 2009 IECC 2012 IECC<strong>Building</strong> envelope sealingDucts and air handlersCaulked and sealed, verifiedby visual inspection against amore detailed checklistSealed, verified by visualinspection, and pressuretested, or all ducts must beinside building envelopeCaulked and sealed, verified by visualinspection and a pressure test against aleakage requirementSealed, verified by visual inspection, andpressure tested against a leakage requirement,or all ducts must be inside building envelopeSupply ducts in attics R-8 R-8Return ducts in attics and all ducts incrawlspaces, unheated basements, garages,or otherwise outside the building envelopeInsulation on hot water pipes for servicewater heating systemsInsulation on hot water pipes for hydronic(boiler) space heating systemsHigh-efficacy lamps (percent of lighting inthe home)Certificate of insulation levels and otherenergy efficiency measuresR-6 R-6NoneR-3 except where pipe run length is below adiameter-dependent thresholdR-3 R-350% of lamps 75% of lamps or 75% of fixturesYesYesRequirements such as insulation levels and fenestration (window, door, and skylights) U-factors can vary by theeight zones in the United States. Table A.5 shows these requirements. <strong>Rhode</strong> <strong>Island</strong> has one climate zone (Zone5) as defined in the IECC.A.4 April 2012
Table A.5.Comparison of Major Requirements That Vary by Climate ZoneClimateZoneIECCCeiling(R-value)Skylight(U-factor)Fenestration (Windowsand Doors)U-factorSHGCWoodFrame Wall(R-value)ComponentsMassWall*(R-value)Floor(R-value)BasementWall**(R-value)Tested MaxAir LeakageRate(air changesper hour)NRSlab***(R-valueand depth)CrawlSpace**(R-value)120090.330 0.75 NR13 3/4 13 NR2012 0.25 5NR NR22009 30 0.75 0.65 0.3NR13 4/6 13 NR2012 38 0.65 0.4 0.25 5NR NR32009 30 0.65 0.5 0.3 13 5/8NR19 5/13****2012 38 0.55 0.35 0.25 20 8/13 3NR 5/1342009 38 0.6NR 13 5/10NR0.3519 10/132012 49 0.55 0.40 20 8/13 310, 2 ft 10/1352009 38 0.6 0.3513/1710/13 NR10/13NR 203010, 2 ft2012 49 0.55 0.32 15/19 15/19 3 15/19620090.6 0.3520NR10/1349NR15/19 30 15/1910, 4 ft2012 0.55 0.32 20+5 3 15/197 and 820090.6 0.3521NR10/1349NR19/21 38 15/1910, 4 ft2012 0.55 0.32 20+5 3 15/19* The second number applies when more than half the insulation is on the interior side of the high mass material in the wall.** The first number is for continuous insulation (e.g., a board or blanket directly on the foundation wall) and the second number is for cavity insulation (i.e., if thereis a furred-out wall built against the foundation wall). Only one of these two has to be met.*** The first number is R-value. The second value refers to the vertical depth of the insulation around the perimeter.**** Basement wall insulation is not required in the warm-humid region of Zone 3 in the southeastern United States.NR = not requiredSHGC = solar heat gain coefficientA.5 April 2012
While exemptions or allowances in the code in are not included in this analysis, the code does allow for some ofthese depending on the compliance path. Examples include the following:• One door and 15 ft 2 of window area are exempt• Skylight U-factors are allowed to be higher than window U-factors• Five hundred square feet or 20% of ceiling area of a cathedral ceiling, whichever is less, is allowed tohave R-30 insulation in climate zones where more than R-30 is required for other ceilingsIncremental First CostsTable A.6 shows the costs of implementing the prescriptive measures of the new code. Costs are provided forboth the reference home and apartment/condo moving from the 2009 to the 2012 IECC. The costs derive fromestimates assembled by Faithful + Gould (2012) and a number of other sources. 2 The original cost data werebased on a national average. The costs are adjusted upwards by 8.2% (multiplied by 1.082) to reflect localconstruction costs based on location factors provided by Faithful + Gould (2011).Table A.6.Total Construction Cost Increase for the 2012 IECC Compared to the 2009 IECCSlab, Unheated Basement,or Crawlspace2,400 ft 2 House 1,200 ft 2 Apartment/CondoHeated BasementSlab, Unheated Basement, orCrawlspaceHeated Basement$1,694 $1,970 $905 $945ResultsLife-Cycle CostTable A.7 shows the LCC savings (discounted present value) of the new code over the 30-year analysis period.These savings assume that initial costs are mortgaged, that homeowners take advantage of the mortgageinterest tax deductions, and that efficiency measures retain a residual value at the end of the 30 years. Asshown in Table A.7, life-cycle cost savings are $11,011 for the 2012 IECC.Table A.7.Life-Cycle Cost Savings Compared to the 2009 IECCState Average2012 IECC $11,011Cash FlowBecause most houses are financed, consumers will be very interested in the financial impacts of buying a homethat complies with the 2012 IECC requirements compared to the 2009 IECC. Mortgages spread the payment forthe cost of a house over a long period of time (the simple payback fails to account for the impacts of mortgages).In this analysis, a 30-year fixed-rate mortgage was assumed. It was also assumed that homebuyers will deductthe interest portion of the payments from their income taxes.2 The Faithful + Gould cost data and other cost data for energy efficiency measures are available on the “BC3” website athttp://bc3.pnnl.gov/.A.6 April 2012
Table A.8 shows the impacts to consumers’ cash flow resulting from the improvements in the 2012 IECC. Upfrontcosts include the down payment and loan fees. The annual values shown in the table are for the first year.The savings from income tax deductions for the mortgage interest will slowly decrease over time while energysavings are expected to increase over time because of escalating energy prices. These tables also includeincreases in annual property taxes because of the higher assessed house values. The net annual cash flowincludes energy costs, mortgage payments, mortgage tax deductions, and property taxes but not the up-frontcosts. The time to positive cash flow includes all costs and benefits, including the down payment and other upfrontcosts.As shown in Table A.8, on average, there is a net positive cash flow to the consumer of $531 per year beginningin year one for the 2012 IECC. Positive cumulative savings, including payment of up-front costs, are achieved in1 year.Table A.8.Impacts to Consumers’ Cash Flow from Compliance with the 2012 IECC Compared to the 2009 IECCCost/BenefitState AverageA Down payment and other up-front costs $178B Annual energy savings (year one) $629C Annual mortgage increase $97DNet annual cost of mortgage interest deductions, mortgage insurance, and property taxes(year one)$1E=Net annual cash flow savings (year one) $531[B-(C+D)]F=Years to positive savings, including up-front cost impacts 1[A/E]Note: Item D includes mortgage interest deductions, mortgage insurance, and property taxes for the first year. Deductions can partiallyor completely offset insurance and tax costs. As such, the "net" result appears relatively small or is sometimes even negative.Simple PaybackTable A.9 shows the simple payback period, which consists of the construction cost increase divided by first-yearenergy cost savings. This calculation yields the number of years required for the energy cost savings to pay backthe initial investment. Simple payback does not consider financing of the initial costs through a mortgage orfavored tax treatment of mortgages.As Table A.9 shows, the simple payback period from moving to the 2012 IECC from the 2009 IECC averages 2.6years.Table A.9.Simple Payback Period, Relative to the 2009 IECC (Years)CodeState Average2012 IECC 2.6A.7 April 2012
<strong>Energy</strong> Cost SavingsAll fuel prices were obtained from the DOE <strong>Energy</strong> Information Administration and are recent residential pricesspecific to <strong>Rhode</strong> <strong>Island</strong> (DOE 2012a, 2012b, 2012c). For this analysis, natural gas fuel prices were set to$1.369/therm. Electricity prices were set to $0.158/kWh for space heating and $0.162/kWh for air conditioning.Oil prices were set to $24.47/MBtu. <strong>Energy</strong> prices are assumed to escalate at the rates published in DOE’sAnnual <strong>Energy</strong> Outlook (DOE 2012d).Table A.10 shows the estimated annual energy costs, including heating, cooling, water heating, and lighting perhome that result from meeting the requirements in the 2009 and 2012 IECC. Table A.11 shows the total energycost savings as both a net dollar savings and as a percentage of the total energy use. 3 Results are averagedacross home type (single- and multifamily), foundation type, and heating system type.Table A.10. Annual <strong>Energy</strong> Costs for Different Versions of IECCHeatingCooling2009 IECC 2012 IECCWaterHeatingLighting Total Heating CoolingWaterHeatingLightingState Average $1,352 $289 $397 $253 $2,291 $809 $280 $358 $215 $1,662TotalAs can be seen from Table A.11, energy cost savings per year for the 2012 IECC compared to the 2009 IECCaverage $629 per year. On a percentage basis, energy cost savings are 27.5% with the 2012 IECC.Table A.11. Total <strong>Energy</strong> Cost Savings Compared to the 2009 IECC2012 IECCSavings ($/yr)Percent SavingsState Average $629 27.5ReferencesFaithful + Gould. 2012. Residential <strong>Energy</strong> Efficiency Measures – Prototype Estimate and Cost Data. Portland,Oregon. http://bc3.pnnl.gov/wiki/index.php/DownloadsFaithful + Gould. 2011. Residential <strong>Energy</strong> Efficiency Measures – Locations Factors. Portland, Oregon.http://bc3.pnnl.gov/wiki/index.php/DownloadsKlein, G. 2012. Cost Estimation for Materials and Installation of Hot Water Piping Insulation. AffiliatedInternational Management, LLC, Newport Beach, California.U.S. Department of <strong>Energy</strong> (DOE). 2012a. Electric Power Monthly. DOE/EIA-0226. Washington, D.C.http://www.eia.doe.gov/cneaf/electricity/epm/table5_6_a.html3 The percent savings is the annual energy cost savings for heating, cooling, water heating, and lighting divided by the totalbaseline annual energy cost for heating, cooling, water heating, and lighting.A.8 April 2012
U.S. Department of <strong>Energy</strong> (DOE). 2012b. Natural Gas Monthly. DOE/EIA-0130. Washington, D.C.http://www.eia.gov/oil_gas/natural_gas/data_publications/natural_gas_monthly/ngm.htmlU.S. Department of <strong>Energy</strong> (DOE). 2012c. Petroleum Marketing Monthly. DOE/EIA-0380. Washington, D.C.http://www.eia.gov/petroleum/marketing/monthly/U.S. Department of <strong>Energy</strong> (DOE). 2012d. Annual <strong>Energy</strong> Outlook. DOE/EIA-0383. Washington, D.C.A.9 April 2012