Annual Report 2001 - JAL | JAPAN AIRLINES
Annual Report 2001 - JAL | JAPAN AIRLINES
Annual Report 2001 - JAL | JAPAN AIRLINES
- No tags were found...

Create successful ePaper yourself
Turn your PDF publications into a flip-book with our unique Google optimized e-Paper software.
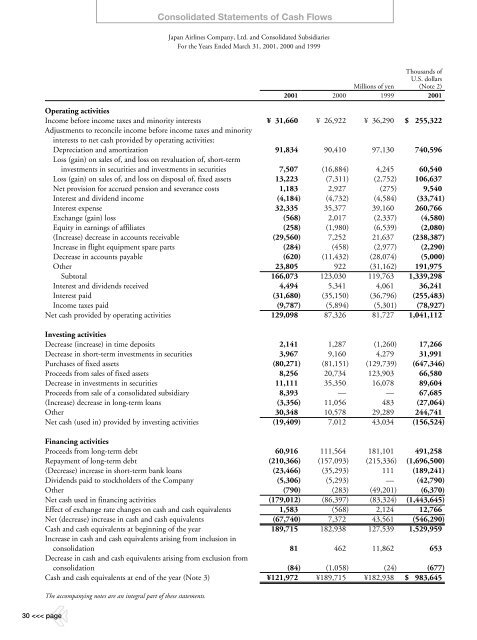
Consolidated Statements of Cash FlowsJapan Airlines Company, Ltd. and Consolidated SubsidiariesFor the Years Ended March 31, <strong>2001</strong>, 2000 and 1999<strong>2001</strong>2000Millions of yen1999Thousands ofU.S. dollars(Note 2)<strong>2001</strong>Operating activitiesIncome before income taxes and minority interestsAdjustments to reconcile income before income taxes and minorityinterests to net cash provided by operating activities:Depreciation and amortizationLoss (gain) on sales of, and loss on revaluation of, short-terminvestments in securities and investments in securitiesLoss (gain) on sales of, and loss on disposal of, fixed assetsNet provision for accrued pension and severance costsInterest and dividend incomeInterest expenseExchange (gain) lossEquity in earnings of affiliates(Increase) decrease in accounts receivableIncrease in flight equipment spare partsDecrease in accounts payableOtherSubtotalInterest and dividends receivedInterest paidIncome taxes paidNet cash provided by operating activities¥ 31,66091,8347,50713,2231,183(4,184)32,335(568)(258)(29,560)(284)(620)23,805166,0734,494(31,680)(9,787)129,098¥ 26,92290,410(16,884)(7,311)2,927(4,732)35,3772,017(1,980)7,252(458)(11,432)922123,0305,341(35,150)(5,894)87,326¥ 36,29097,1304,245(2,752)(275)(4,584)39,160(2,337)(6,539)21,637(2,977)(28,074)(31,162)119,7634,061(36,796)(5,301)81,727$ 255,322740,59660,540106,6379,540(33,741)260,766(4,580)(2,080)(238,387)(2,290)(5,000)191,9751,339,29836,241(255,483)(78,927)1,041,112Investing activitiesDecrease (increase) in time depositsDecrease in short-term investments in securitiesPurchases of fixed assetsProceeds from sales of fixed assetsDecrease in investments in securitiesProceeds from sale of a consolidated subsidiary(Increase) decrease in long-term loansOtherNet cash (used in) provided by investing activities2,1413,967(80,271)8,25611,1118,393(3,356)30,348(19,409)1,2879,160(81,151)20,73435,350—11,05610,5787,012(1,260)4,279(129,739)123,90316,078—48329,28943,03417,26631,991(647,346)66,58089,60467,685(27,064)244,741(156,524)Financing activitiesProceeds from long-term debtRepayment of long-term debt(Decrease) increase in short-term bank loansDividends paid to stockholders of the CompanyOtherNet cash used in financing activitiesEffect of exchange rate changes on cash and cash equivalentsNet (decrease) increase in cash and cash equivalentsCash and cash equivalents at beginning of the yearIncrease in cash and cash equivalents arising from inclusion inconsolidationDecrease in cash and cash equivalents arising from exclusion fromconsolidationCash and cash equivalents at end of the year (Note 3)60,916(210,366)(23,466)(5,306)(790)(179,012)1,583(67,740)189,71581(84)¥121,972111,564(157,093)(35,293)(5,293)(283)(86,397)(568)7,372182,938462(1,058)¥189,715181,101(215,336)111—(49,201)(83,324)2,12443,561127,53911,862(24)¥182,938491,258(1,696,500)(189,241)(42,790)(6,370)(1,443,645)12,766(546,290)1,529,959653(677)$ 983,645The accompanying notes are an integral part of these statements.30