Annual Report 2006 - JAL | JAPAN AIRLINES
Annual Report 2006 - JAL | JAPAN AIRLINES
Annual Report 2006 - JAL | JAPAN AIRLINES
- No tags were found...

You also want an ePaper? Increase the reach of your titles
YUMPU automatically turns print PDFs into web optimized ePapers that Google loves.
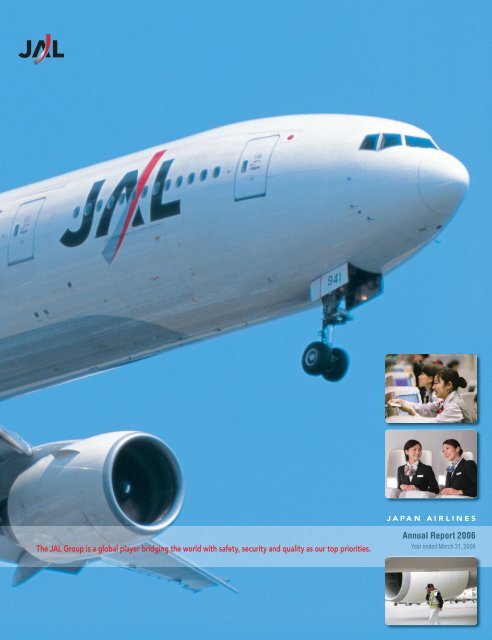
The <strong>JAL</strong> Group is a global player bridging the world with safety, security and quality as our top priorities.<strong>Annual</strong> <strong>Report</strong> <strong>2006</strong>Year ended March 31, <strong>2006</strong>
PROFILENew Group VisionThe <strong>JAL</strong> Group is a global player bridging the worldwith safety, security and quality as our top priorities.As an air transportation group with comprehensive strengths, and with safe fl ights our overriding priority, we bring peoples,their cultures and their hearts together, and contribute to the peace and prosperity of Japan and world. Our Group philosophyis summed up in the statement “Unless fl ight safety is ensured, trust is irrecoverable,” and our motto is: “The <strong>JAL</strong> Group is aglobal player bridging the world with safety, security and quality as our top priorities.” Returning profi t to all stakeholders isa core part of our basic policy, and we constantly make the utmost effort to maximize corporate value. The <strong>JAL</strong> Group isabout to spread new wings of trust, and make a big leap to ever-greater heights.Under the holding company system, the <strong>JAL</strong> Group consists of 275 subsidiaries and 97 affi liates. We operate air transportation,airline-related, travel services, credit card, leasing, and other businesses. Japan Airlines Corporation, the holding company,establishes goals and strategies for the whole Group, and allocates operating resources to maximize corporate value.>> Air transportationOur air transportation segment involves 10 consolidated subsidiaries. This massive network includes not only major subsidiaries of <strong>JAL</strong>International and <strong>JAL</strong> Domestic, but also Japan Asia Airways Co., Ltd., Japan Transocean Air Co., Ltd., <strong>JAL</strong>ways Co., Ltd., <strong>JAL</strong> ExpressCo., Ltd., Japan Air Commuter Co., Ltd., J- Air Co., Ltd., Hokkaido Air System Co., Ltd., and Ryukyu Air Commuter Co., Ltd.>> Airline-related businessAirline-related businesses include passenger services and cargo handling, in-fl ight catering, aircraft and ground equipment maintenance,and aviation fuel supply. This business involves 105 subsidiaries and 74 affi liates.>> Travel servicesA total of 51 subsidiaries and 3 affi liates are engaged in the travel services business, developing and marketing travel packages that includeair travel using our 10 air transportation subsidiaries.>> Credit cards and leasingA total of 42 subsidiaries are involved in the fi nance, credit card and leasing businesses.>> Other businesses• Hotel and resort businessThe hotel and resort business is conducted through 24 subsidiaries and 3 affi liates.• Commercial, retailing and other businessThis category includes trading/wholesaling/retailing, real estate, printing, construction, temp staffi ng, information and advertising, andcultural events, involving 43 subsidiaries and 17 affi liates.CONTENTSConsolidated Financial Highlights . . . . . . . . . . . . . . . . . . . . . 1Consolidated Operating Highlights . . . . . . . . . . . . . . . . . . . . 1Combining the Group’s Comprehensive Strength . . . . . . . . . 2Message from the President . . . . . . . . . . . . . . . . . . . . . . . . . . 4Interview with the President . . . . . . . . . . . . . . . . . . . . . . . . . 6Fundamental Policies and Actions RegardingCorporate Governance . . . . . . . . . . . . . . . . . . . . . . . . . . . . 12Review of Operations . . . . . . . . . . . . . . . . . . . . . . . . . . . . . 14Board of Directors . . . . . . . . . . . . . . . . . . . . . . . . . . . . . . . . 21Management’s Review and Analysis of Financial Position . . 22Consolidated Balance Sheets . . . . . . . . . . . . . . . . . . . . . . . .26Consolidated Statements of Operations . . . . . . . . . . . . . . . .28Consolidated Statements of Stockholders’ Equity . . . . . . . . 29Consolidated Statements of Cash Flows . . . . . . . . . . . . . . . 30Notes to Consolidated Financial Statements . . . . . . . . . . . . 32<strong>Report</strong> of Independent Auditors . . . . . . . . . . . . . . . . . . . . . 44Consolidated Subsidiaries . . . . . . . . . . . . . . . . . . . . . . . . . . 45<strong>JAL</strong> and Its Subsidiaries and Affi liates . . . . . . . . . . . . . . . . . 48<strong>JAL</strong> Group Route Network . . . . . . . . . . . . . . . . . . . . . . . . . 50Investor Information . . . . . . . . . . . . . . . . . . . . . . . . . . . . . . 53
CONSOLIDATED FINANCIAL HIGHLIGHTSJapan Airlines Corporation and Consolidated SubsidiariesFor the Years Ended March 31, <strong>2006</strong>, 2005 and 2004Thousands ofMillions of yenU.S. dollarsYears ended March 31, <strong>2006</strong> 2005 2004 <strong>2006</strong>For the Year:Operating Revenues ¥2,199,385 ¥2,129,876 ¥1,931,742 $ 18,798,162Operating Expenses 2,226,220 2,073,727 1,999,387 19,027,521Operating Income (loss) (26,834) 56,149 (67,645) (229,350)Net Income (loss) (47,243) 30,096 (88,619) (403,786)Net Income (loss) Per Share (yen and dollars) ¥ (23.88) ¥ 15.24 ¥ (45.19) $ (0.204)At Year-End:Long-Term Debt ¥1,084,521 ¥1,178,932 ¥1,170,156 $ 9,269,410Stockholders’ Equity 148,066 194,746 159,273 1,265,521Total Assets 2,161,240 2,162,654 2,113,418 18,472,136Shares Issued (thousands) 1,982,383 1,982,383 1,980,465Note: The U.S. dollar amounts in this annual report are translated from yen amounts, solely for convenience, at ¥117=U.S.$1.00, the exchange rate prevailing on March31, <strong>2006</strong> (see Note 3 to the Consolidated Financial Statements).CONSOLIDATED OPERATING HIGHLIGHTSJapan Airlines Corporation and Consolidated SubsidiariesFor the Years Ended March 31, <strong>2006</strong> and 2005Years ended March 31, <strong>2006</strong> 2005 Change (%)Revenue passengers carried (number of passengers): Domestic 43,848,755 44,705,084 -1.9International 14,187,626 14,743,222 -3.8Total 58,036,381 59,448,306 -2.4Revenue passenger-km (1,000 passenger-km): Domestic 32,910,535 33,367,574 -1.4International 67,434,613 68,986,317 -2.2Total 100,345,148 102,353,891 -2.0Revenue passenger-load factor (%; percentage point change): Domestic 64.0 63.7 0.3International 69.4 69.3 0.1Total 67.5 67.4 0.1Revenue ton-km performed (1,000 ton-km): Domestic 2,938,796 2,973,756 -1.2International 10,954,502 11,252,602 -2.6Total 13,893,298 14,226,358 -2.3Revenue weight-load factor (%; percentage point change): Domestic 48.7 48.3 0.4International 66.7 67.7 -1.0Total 61.9 62.5 -0.6Notes: 1. Ratios and percentages have been rounded to the nearest tenth of a percent.2. Other figures less than one thousand, except for passengers carried, have been discarded.1
COMBINING THE GROUP’S COMPREHENSIVE STRENGTHOur aim is to fully restructure our business base, and strengthencompetitiveness in three years toward sustainable growth.Targets in our Medium-Term Business PlanAs a global airline, we will transform ourselves into a corporate group that maintains a highlevel of safety and service quality worldwide. Also we will ensure a sound fi nancial position byimproving asset effi ciency and profi tability with the aim of maximizing corporate value. Thiswill enable us to establish strong business base and company structure that can nimbly respondto changes in the operating environment.FY<strong>2006</strong>target:FY2008target:FY2010target:Turnaround to black in termsof net income.Finish restructuringour business base.Consolidate operating profitmargin of more than 5%.Priorities in the medium-term management planRegain trust and focus on customer satisfaction• Rebuild the foundation for fl ight safety, actively strengthen the quality of products andservices from the customer’s perspectiveImprove the profi tability of international passenger operations• Improve seat load factor and yield through the restructuring of international passengeroperations, the downsizing of our equipment and other measures such as enhancing routenetworks to meet the needs of business travelersImplement further cost-restructuring• Seek to continue to build on the cost-restructuring measures we have taken in the previousFY2005–2007 medium-term business plan2
Members of the Board of DirectorsTetsuya TakenakaSenior Vice PresidentToshio AnnakaSenior Vice PresidentOsamu SasaharaSenior Vice PresidentShoji FukaiSenior Vice PresidentYutaka YoshinoSenior Vice PresidentKimio HiroikeSenior Vice PresidentMasato UeharaSenior Vice PresidentTeruo HarafujiSenior Vice PresidentFumio TsuchiyaManaging DirectorKatsuyuki AraiManaging DirectorKatsuhiko NawanoManaging DirectorHisaichi EndoSenior Vice PresidentToshiyuki ShinmachiChairmanHaruka NishimatsuPresident & CEOKiyoshi KishidaSenior Managing Director3
MESSAGE FROM THE PRESIDENT“Unless flight safety is ensured, trust is irrecoverable.”Greetings to our stockholders and investors.I have recently been appointed as President and CEO of JapanAirlines, and I hope this message fi nds you all well. We atJapan Airlines thank you for your continued warm support.During the term ended March <strong>2006</strong>, the operating environmentsurrounding the <strong>JAL</strong> Group was extremely harsh.Passenger demand on international fl ights was slow to recover,and following a series of safety-related occurrences, demandon domestic fl ights also turned sluggish. Meanwhile, fuel oilprices continued their upward trend, pushing fuel costs higher.As a result, the Group posted a net loss of ¥47.2 billion on aconsolidated basis. Under these conditions, the managementhas reluctantly decided not to pay a dividend for the termunder review. We would highly appreciate your understandingregarding this matter.As outlined in our medium-term business plan, we designatedfi scal <strong>2006</strong> as the year for achieving <strong>JAL</strong>’s rebirth witha redoubled commitment to putting top priority on safety anda customer-oriented approach. We have worked hard toreform our corporate culture and raise employee awarenessrelating to safety issues and services, so as to regain the trustof our stockholders and the general public. Our goal is tocontinue being our customers’ airline of choice, and we willmake our utmost efforts to achieve this goal.As a fi rst step, we established Corporate Safety Divisionin April to strictly supervise the implementation of safetymeasures. We further strengthened our safety assurancesystem by assigning dedicated safety supervisors to each areaof operations and investing them with wide-ranging strongauthority. In addition, we encourage each and every employeeto make special efforts to improve safety and service quality,and request that they carry out their duties keeping in mind thecustomer’s perspective. We urge them to ask themselves, “Whatif I or other members of my family were passengers?”Through our implementation of the current medium-termbusiness plan, we have established a new vision for theGroup: The <strong>JAL</strong> Group is a global player bridging the worldwith safety, security and quality as our top priorities. The newexecutive offi cers and the Company’s entire staff are workingtogether – making utmost efforts – to maintain the highestsafety standards, and thereby ensure that all passengers mayrelax and enjoy their fl ights. We have always put a priority onoffering customer-oriented services that bring you maximumsatisfaction. In the future, we will reinforce our efforts toprovide customers with truly satisfying services. As part ofthese efforts, <strong>JAL</strong> signed the letter of invitation in June to jointhe world’s leading quality global airline alliance oneworldin early 2007.As outlined in our medium-term business plan, we areaccelerating fl eet downsizing by making the shift from largesized aircraft to medium and small sized aircraft. For the purposeof investment to this downsizing, we increased capital througha global offering of 750,000,000 shares in July-August. Throughthis offering, we raised ¥148,500 million in capital, which willgreatly contribute to the improvement in our balance sheet.In October, the <strong>JAL</strong> Group will integrate two of its majoroperating companies, enabling us to effectively integratethe holding company and the operating company. I am surewe will be able to speed up decision making and enhancemanagement effi ciency under the new governance system. Weare confi dent that, by working to deliver services that place thehighest priority on safety and customer satisfaction, <strong>JAL</strong> fulfi llits important role of being the “A Global Player.”We appreciate the continued support of our stockholdersand investors.September <strong>2006</strong>4
Profi le of Mr. Haruka Nishimatsu,President and CEO1948 Born in Hamamatsu, Shizuoka Prefecture1972 Joined Japan Airlines Company, LTD.After spells in the Corporate Planning Department,the Frankfurt Branch, and the Finance Department,Mr. Nishimatsu was appointed as an executiveoffi cer in charge of Finance in 20032005 Appointed Board of Director<strong>2006</strong> Appointed President and CEOHobbies: Visiting sites of historical interest, Golf5
INTERVIEW WITH THE PRESIDENTWe will strengthen our competitiveness by leveraging the opportunities afforded by expanded airport capacity.QWhat kind of business climate does the Japanese airline industry find itself in?The situation is different for domestic, international and cargo operations. Domestic flights havebecome a part of the social infrastructure, as indispensable to people’s lives as electric power andrailways. Thus, its business is stable, and the cost structure is very similar across the industry, butthe potential for further growth is low. There are favourable factors such as an increase in the numberof active seniors with the coming retirement of large number of baby-boomers, most of whomlove to travel. However, the decline in the birth rate means the population is beginning to shrink.On balance, therefore, we expect moderate growth for the domestic market.In international routes, on the other hand, we can expect solid and higher growth despitefierce competition. Notwithstanding a temporary decline due to 9/11, the SARS pandemic, andanti-Japan demonstrations in China, over the medium-to-long term, the market is definitely set toexpand. The aviation market is especially strong in Asia, including Japan. IATA* research shows thatfour of the five highest-growth markets in the world are positioned in Asia. Japan’s “overseas travelrate,” the aggregate number of people going overseas divided by the population, is about 13%.This is lower than Europe’s 20%-plus, and even lower than that of Australia. In view of Japan’seconomic strength, this figure is quite low, which means the potential for growth that will narrowthis gap is truly high. Japan’s baby-boomers will start to retire from 2007. They have a lot of buyingpower and will have time to travel on their hands. This will lead to a higher overseas travel rate. Also,Asian countries surrounding Japan are experiencing rapid economic expansion. With this, we alsoexpect steady growth in the number of foreigners visiting Japan, especially as the Japanese governmentpromotes the “Visit Japan” campaign in close cooperation with the airline and travel industry.Cargo always reflects the state of the Japanese economy. In particular, as Japanese businessesadvance to China and Southeast Asia, the more overseas offices are set up, the more cargo volumeis expected. I believe growth will be steady as the Japanese economy develops.A fourth runway at Haneda Airport will be completed in 2009. This will lead to almost 40%increase in arrival and departure slots, from current 295,000 to 407,000. It is planned that about30,000 of the new slots will be allotted to short-haul international routes, such as China and Korea.We call this change the “internationalisation of Haneda.” In addition, there is a plan to extend the2nd Runway at Narita Airport to 2,500 meters from current 2,180 meters. This expansion of airportcapacity provides us with new business opportunities. To make the most of these chances for sustainablegrowth, we must improve our competitiveness over the next three years and rebuild ourbusiness foundation. That is the main pillar of our medium-term business plan covering the fiveyears from fiscal <strong>2006</strong> through fiscal 2010. Looking toward a new <strong>JAL</strong> Group, we are working toregain customer trust and be thoroughly customer-oriented. At the same time, we will aggressivelyrestructure under performing routes and accelerate downsizing of our aircraft. Furthermore, the <strong>JAL</strong>Group will seriously deepen its cost structure reform to make 2009 an epoch-making year.* IATA: International Air Transport Association6
QWill efforts in the Chinese market become increasingly important in themedium- to long-term?Eleven percent of our international flight revenue comes from Chinese routes, and we expect this togrow strongly. Currently offering 240 round-trip flights a week to 12 destinations in China, we areproud of building the largest network among Japanese and Chinese airlines. We have worked toimprove convenience for customers who fly back and forth between China and Japan on businesstrips by forming comprehensive alliances involving code-sharing and ground handling operationswith four of the six biggest Chinese airlines. These include China Eastern Airlines, based in fastgrowingcommercial city Shanghai, and China Southern Airlines, which is based in Guangzhou,where Japan’s three major automakers have operations. Our alliances with Chinese airlines willprovide further benefits as Japanese companies move deeper into central, inland areas of Chinawhere operating costs are lower. Customers can fly to the gateway cities such as Beijing, Shanghaiand Guangzhou by <strong>JAL</strong>’s own operation and connect to <strong>JAL</strong>’s partner carriers’ code-sharing flightsor other connection flights inland. These flights also provide passengers with mileage accumulationand redemption just as our own flights do.Although tourism declined for a while due to the SARS and other factors, China has made anational commitment to build up its tourism infrastructure such as hotels and public transportation.Moreover, taking into account the fact that China is one of the leading countries for world heritagesites, I believe the potential demand is tremendous. Japanese people are especially drawn toChina’s culture and history, such as traditional landscape paintings and the novel the Romance ofthe Three Kingdoms, and above all China is close and easy to get to. We think the shortly comingbaby boomers retirement will ignite the tourism demand.The other pillar of our China business is cargo. China has become the new “workshop of theworld,” and logistics between China and Japan is expanding rapidly. Not only between China andJapan, but also carrying cargo between China and Europe and the United States is also a marketwith great potential. The ICAO* forecasts 6.5% annual growth over the period 2002 through 2015in cargo demand in the Asia-Pacific region. The driving force for this is, undoubtedly, China.We are covering this attractive market with cargo freighters as well as the cargo space (bellies) ofpassenger aircraft. The uniqueness of China cargo market is there are many large and medium-sizedcargo centers nationwide. We fly B747 cargo freighters to large centers such as Shanghai. On theother hand, we will introduce mid-sized B767 freighters to meet the demand of many medium sizedcargo centers, In this way, we can realize the most effective and efficient operations, reflecting thescale of demand of each route.* ICAO: International Civil Aviation Organization7
We will improve the profi tability of our international fl ights by downsizing aircraft.QYou posted a loss last year. Please share with us the reasons and your strategyfor recovery.The sharp rise in fuel costs had a great impact on us. Our fuel costs were up ¥88 billion comparedwith the previous year. We absorbed ¥52 billion of that by raising fuel surcharges, but the remaining¥36 billion dragged down our profits. We also experienced a series of safety-related occurrences,which affected our competitiveness, which our estimates indicate reduced our earnings by¥12 billion for international flights and ¥20 billion for domestic flights, a total of ¥32 billion. In theprevious term, we had a one-time reduction in personnel costs of about ¥50 billion due to changesin pension accounting. This one-time gain was not repeated in the reporting term. As a result, thenet income/loss account deteriorated by a little over ¥77 billion compared with the previous year.As for recovery strategies, the most important is to prevent recurrences and regain customers’trust. To cover higher fuel costs we have already hedged 75% of our requirements for FY<strong>2006</strong>, butif rise in these costs continues, we are forced to ask our customers for another price hike.Among our businesses, we will focus on improving the profitability of international flights. Sincelast autumn, we have quickly improved or eliminated under performing routes. In the second halfof FY2005, we reduced or suspended service on seven routes — 49 flights a week, or 7% of all ofour international flights. We will continue to aggressively shift resources from low-profit routes tohighly profitable routes, with nothing sacred.We will also improve profitability by downsizing to medium and small sized aircraft. This willlead to improved load factor and yield and cost reductions. Today, large aircraft make up 62% ofour fleet versus 32% for medium and small sized aircraft. We will proactively retire large aircraftand replace them with medium and small sized aircraft, so that these percentages are absolutelyreversed by 2010, i.e. 32% for large aircraft and 62% for medium and small sized aircraft. Havingthis composition ratio, I believe that <strong>JAL</strong> will receive the largest benefit from downsizing fleet,among other major airline.8
We will focus on narrowing the gap between management and the front line, preventing problems and improving service.QYou began your five-year medium-term business plan in FY<strong>2006</strong>. Please tell us yourcountermeasures for rebuilding the foundation for safe flights and regaining trust.I believe that the root cause of the safety-related occurrences was that management was not alwayscompletely cognizant of the situation faced by front-line staff members, which led to insufficientrecognition of problem areas. By the time we reacted to them it would be too late, which invited aseries of mishaps. We have established a mechanism whereby management is aware of front-lineconditions, and thus have minimized the possibility that problems will occur.The morale of our front-line staff is also important. We can raise morale by delegating as muchauthority as we can, and give plenty of room for discretion. Right now, we are sorting operationsinto those that must be performed according to our manuals and those that can be left up to theauthority of the front-line staff members.Top management is also visiting the workplace and talking with our front-line staff members ona regular basis, in an effort to raise morale, facilitate better communications and to create a workingenvironment with room for employee initiative.QWhat measures are you taking to enhance service in order to regain competitiveness?The flow of information between management and front-line staff has been inadequate in this areaas well. Management did not fully grasp problems at airports and the needs of our customers. Thisled to lower competitiveness. FY<strong>2006</strong> is the first year of our rebirth as a company that places thehighest priority on safety and a customer-oriented policy. We can obtain a great many ideas for serviceimprovements from our font-line staff. Our employees hear directly from customers about howmuch our customers are satisfied with our meal service, smoothness of our check in procedure, andhow comfortable our lounges are. These are all aspects of our service. From this front-line information,we can identify problem areas, and actively make improvements one after another.Recently, passenger comments show that our in-flight meal has improved, and our <strong>JAL</strong> ShellFlat Seats, which can be laid flat, are very popular. We always see the load factor go up right afterwe introduce them on a route. We must continue to improve services, or we will lose business tocompetitors. Improving service is an endless challenge for airlines. We have to always work hard toprovide service that can satisfy our customers.9
<strong>JAL</strong> will be reborn with a strong balance sheet through continued cost structure reform including a thorough review ofprocurement costs and reduction in personnel costs.QWould you touch on the strategic high points for FY<strong>2006</strong>?First, in international passenger operations, the key is how to deal with skyrocketing fuel prices.We use four to five times as much fuel for international flights as for domestic flights. Fluctuationsin fuel prices have a large impact on profitability. We are changing over to fuel-efficient aircraftsuch as the Boeing 777s for flights to Europe, and diverting some jumbo jets to routes to short-haulneighbouring countries. This kind of fleet allocation leads to improving profitability. As we did inFY2005, we are actively restructuring under performing routes in accordance with the plan.In domestic passenger operations, the most important things are to make steady efforts to eliminatesafety problems and regain profitability and competitiveness.In our cargo business, we will aggressively go after demand and we expect solid growth in Asia,especially China.QWhat are the main points in revamping your cost structure, which you have beentackling since the previous fiscal year?We will work to reduce costs much further. First, we will review outside procurement, and substantiallylower contracted unit prices. We will examine every negotiation to determine how the pricingstacks up against the average. We will investigate every item to see if we can change to less costlyspecifications. Our goal is to change 3,000 items. I believe this will yield lower procurement costsof about ¥10 billion. As I said, we are continuing to restructure under performing routes. On top ofthis, we are making the utmost effort to reduce personnel costs. We have for the first time cut downon base salaries by 10%, and we aim to reduce our workforce through natural attrition.Higher quality and better network maintenance are our most important goals: we will proactively pursue both.QAs the new CEO, what are your aspirations?I want to promote thorough pursuit of quality and network maintenance as interdependent goals.Three things determine airline quality — safety, punctuality and service. For an airline, wider networksmean greater appeal. For example, a wider network helps customers accumulate mileagebenefits.We will establish and implement specific measures in pursuit of our twin goals of raising servicequality and improving network maintenance for customer convenience.10
QAs the new CEO, what are your commitments and thoughts on regaining trust?I am sure that our maintenance staff and other front-line staff have reviewed the basics of our business,and are fully dedicated to their work. We can continue to fly safely if we always go back tothe basics and work with a sense of high awareness. Our management staff, including myself, willgo to the front lines as often as possible to have better communication with our personnel.In Osaka, our employees carried out “OOKINI (Thank you)” campaign on a voluntary basis toexpress their gratitude to customers for their continued loyalty to <strong>JAL</strong>. They even made the campaign’sbanner on their own. One young employee said that because people from different departmentsgot together and cooperated to achieve the same goal, communication improved, and thework became easier.Our front-line employees are acting with a sense of urgency and are enthusiastic in their pursuitof safe flights. Transparency in management and workplace has improved as well, and much moreinformation about problems is now shared. We want management to continue nurturing this enthusiasmof the front-line.We will, above all, emphasize responding to the needs of society, gaining better public understanding, and fulfi lling ourcorporate social responsibilities.QFinally, please share with us your long-term vision and goals.Demand for flights in neighbouring East Asian countries is extremely strong, and our business environmenthas improved. Under the circumstances, <strong>JAL</strong> has a strong intention to respond to societalrequirements by providing services of the highest quality and maintaining the most convenientnetwork that customers can use without any worries at all.<strong>JAL</strong> used to consciously work to be No. 1 in terms of scale. Although it is important to pursue ahigh ranking and profits, it is wrong to make those one’s only objectives. We can only win the supportand understanding of the people around us by swiftly responding to social needs and fulfillingour social responsibilities. I believe that this is the most important factor in our regaining trust. Wewill spare no effort in doing this, and if this also results in higher profits and a high industry ranking,so much the better.11
FUNDAMENTAL POLICIES AND ACTIONS REGARDING CORPORATE GOVERNANCEThe <strong>JAL</strong> Group’s first priority in the field of corporate responsibilityis to ensure passenger safety: this is the very bedrock on which theGroup’s existence is built. Our other main responsibilities are notlimited to purely business aspects, such as competing fairly andhonestly through the provision of high-quality air transportationand ancillary services, and thereby earning an appropriate level ofprofit. We also take seriously our wider duties as a good corporatecitizen, and endeavor to make a contribution to the healthy developmentof society.On the basis of this fundamental stance, the <strong>JAL</strong> Group has laidout a set of basic policies regarding the Group’s internal controlsystem (as detailed below), in accordance with the stipulations inClause 4, item 6, and Clause 5 of Article 362 of the CorporationLaw, as well as Clauses 1 and 3 of Article 100 of the EnforcementRegulations to the Corporation Law. Our internal control systempolicies are intended to improve the effectiveness and efficiencyof our operational procedures, and to ensure the reliability of theGroup’s financial reports, and we take care to observe the stipulationsof all relevant legislation.Concurrently with the above, by carefully identifying factorsthat could potentially exert a negative impact on the Group’s businessoperations, we endeavor to minimize the risks to which ourbusiness is subject as part of our long-term objective of raising theGroup’s enterprise value.1. System for ensuring that the directors of the Company, in theperformance of their duties, comply with the requirements of thelaw and of the Company’s Articles of Incorporation(1) As laid down by law, directors of a company must fulfill a fiduciaryduty of loyalty to the Company, and must exercise due careand diligence in the performance of their duties. All the directors ofthe Company are fully aware of their duties.(2) In addition, the Board of Directors is responsible for determiningthe policies according to which the Company sets up and organizesits internal control system for ensuring compliance with legalrequirements, and for drawing up specific plans relating to the saidinternal control system. Each director is obligated to make regularreports to the Board regarding the operation of the internal controlsystem within his/her area of authority.(3) We appoint outside directors on a regular basis so that they caneffectively fulfill their function of monitoring the performance of allthe directors.2. System of safekeeping and management of records of theperformance of their duties by the Company’s directors(1) <strong>Report</strong>s (minutes of meetings or other documents) on the decisionmakingprocesses of important bodies such as the Board of Directorsand the Strategy Council and reports on specific resolutions takenon important matters (requests for managerial decisions[ ])shall be drawn up in accordance with the Company’s regulationspertaining to the Board of Directors and other councils andcommittees, as well as the regulations pertaining to , andthe said reports shall be managed and held in safekeeping in accordancewith the Company’s regulations governing such matters.(2) The computer system containing “electronic ” (requestsfor managerial decisions existing as data files) and other computerfiles is constantly monitored for safety from unauthorized access ortampering. In the event of the discovery of unauthorized access to oruse of such files, appropriate remedial action is immediately taken.3. Regulations and other systems relating to the management of risk(1) To ensure effective risk management, we have established acomprehensive risk management system covering the entire <strong>JAL</strong>Group. At the core of the system are a number of specialist committees,such as the Safety Measures Committee, and the Compliance& Risk Management Committee.(2) The Company (Japan Airlines Corporation, the holding companyof the Japan Airlines Group), fully recognizing the critical natureof certain risks attendant on their business operations (notablyrisks affecting the safety of air transportation operations, as well asother business risks) to the continued prosperity, and even the veryexistence, of the Company, constantly reviews its risk managementregulations, and revises them as deemed necessary. At all times, theCompany puts priority on proactive measures to prevent the occurrenceof problems.(3) Through the clear delineation of the channels of communicationfor urgent notifications in the event of an emergency, as well as ofthe spheres of responsibility of the Company’s directors and otherexecutives, we ensure prompt and appropriate response to emergenciesand other unforeseen contingencies. A system to preventrecurrence of the same problem is also in place.4. System for ensuring the effective performance of their dutiesby directors(1) The Company will clarify its regulations relating to the hierarchyof its directors and the apportionment of responsibilities among thedirectors, and will appropriately enforce the delineation of scopesof authority and the division of labor among directors.12
(2) We are pursuing various means of rendering our operationalprocesses more efficient, such as reducing the number of staff incertain units where this is desirable, simplifying administrativeprocedures, and making more use of information technology.5. System for ensuring compliance with legal requirements andthe Company’s Articles of Incorporation in the performance oftheir duties by employees of the Company(1) The <strong>JAL</strong> Group as a whole endeavors to promote complianceand improve the level of understanding and knowledge concerningcompliance among the employees of Group companies, principallythrough the sharing of information on compliance, with theCompliance & Risk Management Committee (chaired by the GroupCEO and President) as the central organizational body.(2) In accordance with the <strong>JAL</strong> Group’s Behavioral Guidelines(named: “Our Pledge to Society”), the Group’s management workto spread an understanding of, and observance of, the Group’scompliance standards throughout the entire Group, and to encouragethe practice of legally and morally unexceptionable conduct inmanagement.(3) In line with the Law to Safeguard Persons Who DiscloseInformation in the Public Interest, the <strong>JAL</strong> Group has set up awhistleblower hotline for use by all Group management and staff,and has informed all staff of its existence and purposes. All staff areencouraged to make use of this hotline system to report conductthat they suspect may be illegal.(4) The internal auditing departments of the Group keep abreast ofdevelopments in the field of compliance throughout the Group.6. System for ensuring proper conduct of management at Groupcompanies(1) The holding company (“the Company”) concludes a BasicAgreement with each member company in the Group under whichthat member company agrees to abide by the Company’s managementpolicies and to work together with the Company toward theachievement of same corporate mission.(2) Divisions have been established within the holding company(Japan Airlines Corporation) and within the two principal operatingcompanies (Japan Airlines International and Japan AirlinesDomestic) that are responsible for overseeing the managementand operation of other Group members, and the position of thesedivisions in the chain of responsibility is clearly stated. This providesan efficient system for the guidance and support of Group companymanagements.(3) Through the “compliance network,” comprising all membersof the <strong>JAL</strong> Group, compliance-related information is exchanged,enabling the fostering of higher levels of awareness regarding theimportance of compliance, and facilitating efforts by individual Groupcompanies to build or improve their own compliance systems.(4) The Company’s Internal Auditing Department performs audits ofall Group members.7. Matters relating to an employee or employees assigned to assistthe statutory auditors at their request(1) An Auditing Office will be set up and staffed with full-timeemployees possessing specialist knowledge and experience in theauditing field, to assist the statutory auditors in the performance oftheir duties.8. Independence of auditors’ assistants from the directors of theCompany(1) The staff selected to assist the statutory auditors shall follow allorders and instructions relating to auditing work given to them bythe statutory auditors. Replacement of the said staff shall be subjectto approval by the statutory auditors.9. System for submission of reports by the directors and employeesof the Company to the Board of Corporate Auditors or toindividual statutory auditors(1) The statutory auditors shall be summoned to attend meetings ofthe Board of Directors and other important meetings, and the auditorsshall be included in the list of persons to whom mustbe sent. In these ways, the auditors shall be kept fully informed andup-to-date regarding important matters relating to the conduct ofthe Company’s management and day-to-day business operations.(2) The results of audits performed by the Internal ControlDepartment shall be made available to the statutory auditors.10. Creation of a system to ensure the effective performance ofaudits by the Board of Corporate Auditors or by individual statutoryauditors(1) Care shall be taken to ensure that opinions are frequentlyexchanged between the Company’s Board of Corporate Auditorson the one hand, and the accounting auditors (accounting firm), theCompany’s directors and employees, and the directors and statutoryauditors of subsidiary companies on the other.13
REVIEW OF OPERATIONSInternational Passenger OperationsOn international routes, passenger demand was steady for flights to United States, Koreaand Taiwan. However, growth was sluggish on routes to China. The number of passengersdecreased by 3.8% year-on-year, and passenger kilometers edged downward by 2.2%, whichis partly attributable to a 2.3% decline in revenue seat kilometers.OVERVIEW OF BUSINESS OPERATIONSIN THE REPORTING TERMRoute operationsIn the fi scal year under review, we increased the numberof fl ights on routes to China (Tokyo-Qingdao) and routes toother East Asia destinations (such as Osaka-Seoul), which areexpected to grow in the medium- to long-term, and Tokyo-Chicago and Tokyo-Moscow routes, where business demandhas been strong. In particular, for routes to China, we haveincreased code-sharing operations with Chinese airlines tofurther expand our China-Japan network, which already exceedsthose of our rivals. On the other hand, we canceled scheduledfl ights on routes that we believe are unlikely to generate asuffi cient level of profi ts over the medium term, such as routesfrom Tokyo and Osaka to Saipan, and routes from Fukuoka toHonolulu, Hong Kong, and Seoul, and from Nagoya to Guam.We streamlined these fl ights by replacing some of them withcode-sharing and charter fl ights.As part of our operational streamlining, we proceed withtransferring the operation of additional routes to <strong>JAL</strong>ways, ourlow cost second-brand carrier in order to further enhance ourcost competitiveness.MarketingOn the marketing front, in an effort to increase tourist demand,we launched a “FLY <strong>JAL</strong>! 10,000 Mile Gift Campaign” in April 2005and, commencing in December 2005, a “Winter Bonus Campaign”on both international and domestic routes. Furthermore, we starteda “<strong>JAL</strong> Corporate Flight Merit Program” for small and mid-sizedbusiness in April 2005 as to aggressively pursue business demand.On some routes, including those to London, we introduced anew type of in-fl ight meal service that allows passengers in theexecutive class to freely choose when to have their second meal.As revenue seat-kilometers was reduced by 2.3% froma year earlier due mainly to route restructuring, revenuepassenger-kilometers fell by 2.2%. However, revenues fromthe international passenger operations on a consolidated basisincreased 2.8% to ¥690.2 billion, as passenger yield increased5.2% year-on-year mainly because of increase in fares and fuelsurcharges.14
FUTURE DEVELOPMENT AND STRATEGY:MEDIUM-TERM MANAGEMENT PLANWe positioned fi scal <strong>2006</strong>–2008 as the rebuilding stage for ourGroup’s business base. We will execute changes intensively andwith focus to signifi cantly improve profi tability. To accomplishthis, we will concentrate operating resources on highly profi t-able, high-growth routes, and accelerate retirement of old aircraft,replacing them with new, mainly medium-sized and smallplanes such as B787 and B737-800. We will expand the numberof low-cost operations performed by expanding <strong>JAL</strong>waysbusiness scale, extending <strong>JAL</strong> Express fl ights to include overseasroutes, and in other ways. To better serve passengers that bringhigher profi t, the Group will respond to requests to meet theneeds of business passengers. This includes better in-fl ightmeals, more “<strong>JAL</strong> Shell Flat Seats,” and strengthening serviceson routes to China. We have positioned FY2009 and beyondas our sustained growth phase. To set the Group on the path tofurther growth, we will aggressively capitalize on added arrivaland departure possibilities at Haneda and Narita airports.*In FY2007, we will join oneworld, the world’s leadingglobal multilateral airline alliance that has American Airlinesand British Airways among its members. This will expand ournetwork, and lead to major improvements in service, withregard to e-tickets, mileage member services, airport lounges,and connection services.* Haneda Airport: The largest hub airport in Tokyo metropolitan areaNarita Airport: The principal international airport for Tokyometropolitan areaRevenue analysis: international passenger operationsYoY change (%)1050-5RevenueFY05: ¥690.2 billion (+2.8% YoY)-2.2RPKEffect of foreign exchangeapp. (1.6%)5.2RPK unit priceYoY change (%)50-5Load FactorFY05: 69.4% (+0.1% YoY)-2.2 -2.3RPKASKRPK: revenue passenger kilometersASK: available seat kilometersInternational passenger demand and supply by destination (YoY change)YoY growth rate (%)151050-5-10-15-20-25Americas Hawaii Europe Southeast Asia Oceania Guam/Saipan Korea ChinaRPKASK15
Domestic Passenger OperationsThe number of tour passengers was up over the previous year, but the number of individualpassengers failed to grow, mainly due to the safety related occurrences. As a result, thenumber of revenue passengers carried was down 1.9%, and revenue passenger-kilometersdipped 1.4%.OVERVIEW OF BUSINESS OPERATIONSIN THE REPORTING TERMRoute operationsWe expanded our operations to/from new airports that openedthis year, which led to an increase in numbers of passengers.We introduced a total of 10 new fl ights on six routes from KobeAirport, which opened in February <strong>2006</strong>, including routes toTokyo International Airport (Haneda), as well as Sapporo andNaha. In addition, at New Kitakyushu Airport, which opened inMarch, we introduced larger-sized aircraft on the Haneda route,and also began servicing routes to Nagoya (Komaki) and Naha.MarketingWe worked to boost demand by expanding the number of daysfor which “Bargain Fares” were offered and continuing to offerbirthday discount and “Otomo de Mairu,” mileage bonusesfor passengers traveling with a partner. We also launchedpromotional campaigns that feature popular characters, such asthe Mushiking and Tamagotchi video-game characters.The Group also worked to improve customer convenience.We increased the number of “Class-J” premium seats, whichhave been very popular since they were introduced. Furthermore, we expanded our advanced “<strong>JAL</strong> IC Check-in Service” byincreasing to 44 the number of airports where “<strong>JAL</strong> IC Check-inService” is available. With “<strong>JAL</strong> IC Check-in Service,” ourcustomers do not have to go to the check-in counter, and canboard without a boarding pass.Despite the above initiatives, a series of safety-related occurrencestook place and negatively affected demand especiallyfrom individual passengers, and although passenger yield werenearly fl at at a level of 0.8% lower, passenger revenue fromdomestic operations as a whole dropped 2.2% from the previousfi scal year, to ¥659.9 billion.16
FUTURE DEVELOPMENT AND STRATEGY:MEDIUM-TERM MANAGEMENT PLANThe Group will expand its “Class-J” seats plan to 13% of all seatsin FY<strong>2006</strong> by introducing it in smaller aircraft as well as addingto their numbers in medium-sized and large aircraft. We willalso enhance convenience and comfort for customers throughproviding reliable, comfortable and convenient products andservices, such as easier IC check-in service and strengtheningour e-marketing initiatives. We plan to renew fl eet by replacingolder aircraft with new aircraft such as the B737-800 (fromFY<strong>2006</strong>) and B787 (from FY2008), in an effort to enhance thecompetitiveness of our fl eet. We will improve cost competitivenessby establishing a low-cost operating system by expandingthe operations of <strong>JAL</strong> Express routes. Through these measures,the Group will not only remain competitive against our rivalsin the domestic airline market, but also improve its competitiveedge over other means of transportation. Our aim is to increasedomestic passenger revenue by 11.5% over FY2005 to ¥737billion in FY2010 by increasing passenger yield and numbers ofpassengers.The expansion of arrival and departure slots at Hanedascheduled in FY2009 is our biggest business opportunity inthis medium term business plan. The <strong>JAL</strong> Group will take fulladvantage of this by such measures as adding new fl ights.Revenue analysis: domestic passenger operationsYoY change (%)50-5RevenueFY05: ¥659.9 billion (-2.2% YoY)-1.4RPK-0.8RPK unit priceYoY change (%)50-5Load FactorFY05: 64.0% (+0.3% YoY)-1.4RPK-1.9ASKRPK: revenue passenger kilometersASK: available seat kilometers17
Cargo OperationsDriven by the expanding world economy, our cargo operations were generally favorable.However, as business was exceptionally brisk in the previous period, revenue cargo tonkilometersdipped by 3%.OVERVIEW OF BUSINESS OPERATIONSIN THE REPORTING TERMRoute operationsWe increased the number of fl ights on trans-Pacifi c routes androutes to Hong Kong during the busy season in the second half.In addition, starting in November 2005, we utilized new Boeing747-400 Freighter and converted some of the return fl ightsfrom Europe, which had previously stopped over at Anchorage,into direct fl ights, thereby improving our services with shorterfl ight time and reducing costs, including fuel costs.MarketingSince early autumn of 2005, in addition to expanded exportsof fl at-panel TVs and semiconductor-devices, and shipmentsof auto parts by Japanese manufacturers have increased.Although imports of fresh food were weak, imports of autoparts and materials were steady.Our total cargo transportation volume fell 3.0% from theprevious fi scal year, to 4,541.29 million tonne-kilometers, butcargo yield increased 8.6%, mainly due to increases in fuelsurcharges, and revenue increased 5.4%, to ¥180.5 billion.FUTURE DEVELOPMENT AND STRATEGY:MEDIUM-TERM MANAGEMENT PLANThe Group will strive to expand cargo operation while securingstable profi tability by building an effi cient operational base thatutilizes a combination of large-and medium-sized aircraft. Weplan to aggressively develop potential growth markets, suchas China, while servicing the demands of our most importantmarket, the Japan outbound international cargo market,through such measures as strategic alliances with freightforwarders. We are seeking to develop growth opportunitiesthat include the logistic business, express delivery business anddomestic night cargo fl ight market.18
Related OperationsMany Group companies in related operations posted solid results. As a result, revenue fromrelated operations (after consolidation adjustments) rose by 7.5% from the previous fiscalyear to ¥683.7 billion.In airline-related businesses, the volume for the in-fl ight cateringcompany increased due to improved sales volume at TokyoInternational Airport (Haneda) resulting from new contractsand an increase in the number of international charter fl ights.Revenue also increased signifi cantly at our power sales companieshandling auxiliary power for aircraft, largely due to theincrease in electric power sales volume following the openingof Terminal 2 at Tokyo International Airport (Haneda) and ofthe Central Japan International Airport. As a result, the airlinerelatedbusiness segment reported sales of ¥342.9 billion andoperating income of ¥5.8 billion.Travel servicesIn the Group’s travel services business, both the volume andrevenue of overseas travel service decreased due to <strong>JAL</strong> Group’sreductions in the number of international passenger fl ights onthe routes to resort areas. Domestically, revenues increaseddue to a rise in customer volume on most destinations, inparticular to Okinawa. As a result, sales rose to ¥415.3 billion,and operating income was ¥600 million.Other BusinessesIn the commercial and retail business, revenue increased dueto healthy sales of real estate, food-related products and airplaneparts to non-group companies, although customers weremore dispersed following the opening of Terminal 2 at TokyoInternational Airport (Haneda) and sales at the airport’s BLUESKY consequently decreased. In our hotel business, we havenewly won contracts to manage seven additional hotels sinceApril 2005, but overall revenues fell for various reasons, includingchanges in the operation of the Kawasaki Nikko Hotel to amanagement contract basis following the sale of the hotel, anda drop in revenue from the Hotel Nikko Bayside Osaka, due tothe opening of a competing hotel in the neighboring are. As aresult of the above, sales in the other businesses segment was¥212.6 billion and operating income was ¥6.1 billion.Credit card and leasing businessCredit card business experienced substantially increasedtransaction volumes with the number of members increasing13% to around 1.58 million at the end of the term as a resultof measures to gain new members, which led to an increase inrevenue. As a result, the credit card and lease business posted¥60.1 billion in sales and ¥4.3 billion in operating income.19
Event calendar>April>June>July>OctoberEstablished CorporateSigned the letter ofConcluded business tie-upScheduled merger of JapanSafety Division and Safetyinvitation to join oneworldwith JTB GroupAirlines International andPromotion CenterDecided on a share issuanceJapan Airlines Domesticof 750 million sharesB787 to be newly introduced in FY200820
BOARD OF DIRECTORSJapan Airlines CorporationMEMBERS OF THE BOARD OF DIRECTORS & EXECUTIVE OFFICERS(as of June 28, <strong>2006</strong>)Toshiyuki ShinmachiChairmanHaruka NishimatsuPresident & CEOKiyoshi KishidaSenior Managing DirectorKatsuyuki AraiManaging DirectorKatsuhiko NawanoManaging DirectorFumio TsuchiyaManaging DirectorHisaichi EndoSenior Vice PresidentShoji FukaiSenior Vice PresidentYutaka YoshinoSenior Vice PresidentOsamu SasaharaSenior Vice PresidentKimio HiroikeSenior Vice PresidentToshio AnnakaSenior Vice PresidentMasato UeharaSenior Vice PresidentTetsuya TakenakaSenior Vice PresidentTeruo HarafujiSenior Vice PresidentShunji KonoSenior Vice PresidentKen MoroiSenior Vice PresidentShinobu ShimizuSenior Vice PresidentShunichi SaitoExecutive OfficerMasaaki HagaExecutive OfficerToshiro MoriyaExecutive OfficerShinobu KobayashiExecutive OfficerKunio HirataExecutive OfficerAtsuro NishiExecutive OfficerAUDITORS(as of June 28, <strong>2006</strong>)Yasunaka FurukawaSenior Corporate Auditor of the BoardTeruhisa IshizawaCorporate Auditor of the BoardMasao NishimuraCorporate Auditor of the BoardMasatake MatsudaCorporate Auditor of the BoardYoshihisa AkiyamaCorporate Auditor of the Board21
MANAGEMENT’S REVIEW AND ANALYSIS OF FINANCIAL POSITIONJapan Airlines Corporation and Consolidated Subsidiaries Years Ended March 31, 2005 and <strong>2006</strong>Consolidated operatingrevenues(Billions of yen)2,5002,0001,5001,0005000(Billions of yen)6040200-20-40-60-802004 2005 <strong>2006</strong>Consolidated operatingincome2004 2005 <strong>2006</strong>Operating Environment and Financial StrategyThe overall global economy recovered steadily dueto the expansion of the U.S. and East Asia(Chinese, Korean, Taiwanese, Singaporean)economies. Moderate economic recoveries werealso seen in the U.K. and other European countries.The Japanese economy also experienced amoderate recovery. Capital expenditures increasedagainst the backdrop of strong corporate earnings,and consumer spending recovered due to improvementsin the employment environment. Overall,this strength in the corporate sector had a favorableeffect on the household sector.During the period under review, internationalpassenger demand fell below the previous year’slevel. This is mainly attributable to weak demandon China routes following anti-Japanese demonstrations,and to continued stagnation in demandfor flights to Southeast Asian destinations.Passenger demand on our domestic routes, in particulardemand from individuals, was also stagnant,mainly due to the adverse impact of a series ofsafety-related occurrences. The overall performanceof our international cargo services fell shortof that of the previous year, as demand for servicesfrom Japan to the United States and East Asiancountries was weak during the first half of the fiscalyear. Throughout the reporting period, aircraft fuelprices stayed at extremely high levels, and thebusiness environment for the <strong>JAL</strong> Group remainedchallenging.In response, the Group took steps to maximizecorporate value and improve asset efficiency aswell as improve profitability and ensure a soundfinancial position.In the new medium-term business plan for theperiod fiscal <strong>2006</strong> to fiscal 2010, announced inMarch <strong>2006</strong>, we are targeting the first three years(FY<strong>2006</strong>-2008) to be the rebuilding stage for ourGroup’s business base, during which time we planto further streamline costs as well as restructureour international passenger operations. At thesame time, we plan to strategically purchase newaircraft in order to position ourselves to capitalizeon the business opportunities expected to arisefrom the expansion of Tokyo International Airport(Haneda), which is expected to launch internationalflights from that airport, and the increase intakeoff and landing slots at Narita InternationalAirport in FY2009. We also aim to realize sustainedgrowth by rebuilding our business base by focusingour resources on “safety” and “customer satisfaction.”Besides, we plan to further streamline itsfixed costs in connection with reduction in thescale of its international business operations. TheGroup also plans to further simplify its businessprocesses on a group-wide basis. Through thesemeasures, the <strong>JAL</strong> Group aims to achieve animproved cost structure.Results of Operations (consolidated basis)Operating RevenuesConsolidated operating revenues in the fiscal yearended March 31, <strong>2006</strong>, rose ¥69.5 billion, or3.3%, from a year earlier to ¥2,199.3 billion. In ourmainstay air transportation segment, passengerdemand on our international route declined due toour proactive route restructuring, mainly to resortdestinations, and lingering adverse effect of anti-Japanese demonstrations in China. However, wemanaged to increase revenues due to improvedyield through measures including introductionof a fuel surcharge. Passenger demand on domesticroutes declined year-on-year, due mainly tothe adverse impact of a series of safety-relatedoccurrences.By segment, including intra-segment transactions,sales in the air transportation business rose1.9% year-on-year to ¥1,732.9 billion; increaseswere also recorded in the airline-related business(up 16.7%, to ¥342.9 billion), in the credit cardand leasing services business (up 2.9%, to ¥60.1billion), and in the other business (up 1.4%, to¥212.6 billion). Sales in the travel services businesswere down 2.2%, to ¥415.3 billion. The sharpincrease in operating revenues in the airline-relatedbusiness was due to passing on higher fuel oilcosts charged by our overseas affiliated suppliersto selling prices, which enabled us to raise revenuesin line with rising expenses.Operating ExpensesOperating expenses rose ¥152.4 billion, or 7.4%,from the previous year to ¥2,226.2 billion. Breakingthem down into cost of operating revenues andSG&A expenses, shows that cost of operating revenuesaccount for most of the increase in expenses,while SG&A expenses actually declined year-onyearas a result of Group-wide efforts to streamlineour expense structure. The main reason for the22
Consolidated net income(Billions of yen)500-50-1002004 2005 <strong>2006</strong>Consolidated total assets(Billions of yen)2,5002,0001,5001,00050002004 2005 <strong>2006</strong>steep increase in cost of operating revenues wasthe unprecedented skyrocketing escalation in themarket price of fuel oil, with Singapore Keroseneaircraft fuel rising an annualized 44.8% from theprevious term to $72.1/BBL. Faced with this issue,we have taken a range of measures to prop up revenues,centered on cost-cutting and route restructuring,as well as increases in fares and fuelsurcharges. Although we were able to absorb someof the impact of higher fuel prices in this way, fuelexpenses as a proportion of operating expenses inthe air transportation business rose from 17.4% inthe previous term to 21.2%. This translates into ayear-on-year increase in expenses of ¥88.2 billion(up 30.5%).Operating IncomeAs described above, despite a string of safetyissues affecting our operations in Japan, operatingrevenues rose year-on-year. However, we postedan operating loss in the term under review, of¥26.9 billion, due to the severe impact of soaringfuel oil market prices.Breakdown by SegmentAir TransportationOn international routes, passenger demand wassteady for flights to the United States, South Koreaand Taiwan. However, passenger demand on routesto Europe and Southeast Asia and Oceania wasweak, and the effect of anti-Japan demonstrationin China continued to linger on routes to China,mainly among tourists. As a result, the number ofrevenue passengers declined 3.8% year-on-year,and we posted a 2.2% decline on a revenuepassenger-kilometers basis. Against this backdrop,we took a range of remedial measures such asrevising our route operation model including routerestructuring and strengthening cost competitivenessthrough productivity enhancements such asshifting more operations to our low cost affiliatedcompany, <strong>JAL</strong>ways Co., Ltd. At the same time, wefocused on demand-boosting measures to ensuremore tourists and business passengers. As a resultof these efforts, overall Group revenues from theinternational passenger operations rose 2.8%year-on-year, to ¥690.2 billion, as passenger yieldincreased 5.2% year-on-year mainly due toincrease in fares and fuel surcharges.In domestic passenger operations, the numberof individual passengers failed to grow, mainly dueto the safety-related occurrences, and the growthin the number of tour passengers proved insufficientto offset this decline. As a result, the numberof revenue passengers carried declined 1.9% froma year earlier, while revenue passenger-kilometerswere down by 1.4% year-on-year. Against thisbackdrop, we proactively expanded our operationsto/from new airports in Kobe and Kitakyushu thatopened in the latter part of this reporting period inan effort to increase the number of passengers. Onthe product strategy front, we have begun toincrease the number of “Class-J” premium seats,which have been very popular since they were firstintroduced. In addition, our marketing efforts wereaimed at creating demand by expanding the numberof days for which “bargain fares” were offered.Under these circumstances, passenger yieldremained stable with slight decrease by 0.8%year-on-year and revenues from domestic passengeroperations declined 2.2% year-on-year to¥659.9 billion due to declining demand.For international cargo services, amidst thegrowth of the global economy, demand for cargoservices was generally steady, but we posted a3.0% decline in revenue cargo ton-kilometersterms, compared with last year’s exceptionallygood results. Turning to product categories transported,demand for cargo services recovered fromautumn onward with increased shipments of flatscreentelevisions, semiconductor products andauto parts by Japanese automakers. Furthermore,overall import demand was strong since imports ofauto parts and materials were steady, even thoughimports of fresh food were somewhat weak. Withregard to our route management, we increased thenumber of flights on trans-Pacific routes androutes to Hong Kong. In addition, we utilized newB747-400 Freighters and converted some of thereturn flights from Europe, which had previouslystopped over at Anchorage, into direct flights,thereby improving our services with shorter flighttime and reducing costs, including fuel costs.Although demand was down year-on-year, cargoyield rose 8.6% mainly due to increase in the fuelsurcharges, and operating revenues rose 5.4%year-on-year to ¥180.5 billion. Operating revenuesfor domestic cargo operations decreased 3.6%year-on-year to ¥29.4 billion.23
Consolidated totalstockholders’ equity(Billions of yen)2001501005002004 2005 <strong>2006</strong>Consolidated long-term debt(Billions of yen)1,5001,00050002004 2005 <strong>2006</strong>As a result of the above, although total transportationvolume, including both international anddomestic passengers and cargo, was down by2.3% year-on-year, sales increased ¥31.6 billionyear-on-year to ¥1,732.9 billion due to improvedyield, while operating loss was ¥43.4 billion due toincreased expenses from surging fuel oil prices.Airline-Related BusinessOur in-flight catering company, TFK Corporation,posted higher revenues on a steady performanceat Narita International Airport and on increasedsales volume at Tokyo International Airport(Haneda), due to new contracts and an increase inthe number of international charter flights. AGPCorporation, which sells auxiliary power for aircraft,posted higher revenues due to the increase in electricpower sales volume following the opening ofTerminal 2 at Tokyo International Airport (Haneda)and of the Central Japan International Airport.Overseas companies in the aircraft fuel businessalso ensured that revenues rose in line withexpenses by ensuring that rising costs of fuel werereflected in sales prices. As a result, operating revenuesin the airline-related business rose ¥49.1billion year-on-year to ¥342.9 billion, and operatingincome rose 9.8% year-on-year to ¥5.8 billion.Travel Services Business<strong>JAL</strong>PAK Co., Ltd.’s customer volume and revenueboth fell following reductions in the number offlights on the <strong>JAL</strong> Group’s international passengerroutes. <strong>JAL</strong> TOURS Co., Ltd. recorded increasedrevenues due to a rise in customer volume on mostdestinations, in particular to Okinawa. As a result,operating revenues in the travel services businesstotaled ¥415.3 billion, and operating incometotaled ¥0.6 billion, compared with an operatingloss in the previous term of ¥0.3 billion.Credit Card and Leasing ServicesThe Group’s credit card company, <strong>JAL</strong>CARD Inc.,experienced substantially increased transactionvolumes with the number of members increasing13% to around 1.58 million compared with theprevious term, as a result of measures to gain newmembers, which led to an increase in revenue. Asa result, operating revenues in this segment were¥60.1 billion, and operating income totaled ¥4.3billion.Other Businesses<strong>JAL</strong> HOTELS Company Ltd., a hotel operator, newlywon contracts, but overall revenues fell due mainlyto changes in the operation of the Kawasaki NikkoHotel to a management contract basis following thesale of the hotel, and a drop in revenue from theHotel Nikko Bayside Osaka, which we own, due tothe opening of a competing hotel in the neighboringarea. However, <strong>JAL</strong>UX Inc., a trading company,posted increased revenues due to healthy sales ofreal estate, food-related products and airplaneparts to non-Group companies. As a result, operatingrevenues in this segment totaled ¥212.6 billion,and operating income came in at ¥6.1 billion.Non-operating Income/ExpensesThe Group posted non-operating expenses of¥19.6 billion, due to continuing deteriorating inrevenues from the previous term.Non-operating income fell by ¥14.1 billion fromthe previous year to ¥56.8 billion, with gains on foreignexchange translation and sales of real estatemore than offset by the non-occurrence of ¥48.3billion in aircraft purchase incentives recorded inthe previous term. An impairment loss of ¥18.7billion recorded after the application of impairmentaccounting, and an improvement in net interestexpense on a decline in interest paid causednon-operating expenses to decline ¥6.0 billionyear-on-year.Net Income/Loss for the TermAs a result of the above, we posted a net loss of¥47.2 billion, compared with a net income of¥30.0 billion in the previous term.Liquidity and Capital ResourcesFinancial Position (on a consolidated basis)Total assets declined slightly year-on-year, to¥2,161.2 billion. In current assets, cash and timedeposits declined by ¥78.6 billion to ¥173.9 billion,mainly due to the posting of a net loss, whileaccounts and notes receivable-trade increased by¥14.5 billion year-on-year to ¥237.4 billion in linewith increased operating revenues. Combined witha valuation gain on fuel derivatives, amounts equalto incentives received for aircraft purchases in largequantities, current assets totaled ¥687.3 billion, ayear-on-year increase of ¥4.1 billion. On the otherhand, tangible fixed assets decreased ¥5.4 billion24
Consolidated stockholders’equity ratio(%)1086420(Billions of yen)150100502004 2005 <strong>2006</strong>Consolidated cash flowsyear-on-year to ¥1,473.9 billion, since, in additionto recording a ¥125.1 billion depreciation charge,we sold 14 aircraft, while purchasing 14 aircraft (ofwhich two were direct purchases and 12 wereacquisitions in the middle of, or following the expirationof, the relevant lease terms). Investment andother securities increased ¥31.2 billion to ¥249.0billion.In liabilities, long-term debt including the currentportion consisting of amounts repayable within oneyear declined ¥59.8 billion year-on-year to ¥913.0billion. The year-end balance of bonds, includingthe current portion, decreased by ¥15.0 billionfrom the previous year-end level at ¥310.0 billion.This led to a ¥79.9 billion year-on-year decline ininterest-bearing debt, including the portionrecorded as current liabilities, to ¥1,229.6 billion.Stockholders’ equity declined ¥46.6 billionyear-on-year to ¥148.0 billion. This was mainlyattributable to an increase in the accumulateddeficit from ¥34.9 billion at the previous year-endto ¥90.1 billion, mainly due to posting of the ¥47.2billion net loss for the period. As a result, the equityratio (stockholders’ equity as a percentage of totalassets) declined from 9.0% for the previous termto 6.9%.remain at record-high levels due to the persistentinstability of the international community, and weanticipate that the business environment surroundingthe <strong>JAL</strong> Group will remain severe. Under thesecircumstances, we will endeavor to improve ourprofitability by maximizing the benefit derived fromthe integration of our operating companies whileimplementing a variety of marketing and othermeasures to increase revenue in each of the internationalpassenger, domestic passenger and cargobusiness. We will also strive to achieve further costreduction by more vigorous and thorough implementationof the cost structure reform that we havealready been undertaking.In our forecast for the fiscal year ending March31, 2007, we have assumed an exchange rate of¥120= one U.S.dollar, and with respect to theprice of aircraft fuel price, Singapore Kerosene at amarket price of US$75 per barrel. We have enteredinto hedging transactions covering approximately80% of our expected U.S. dollar requirements and75% of our expected fuel requirements. The currentfinancial targets on a consolidated basis forthe fiscal year ending March 2007 is as follows:Consolidated operating revenue: ¥2,301.0 billion0-50-1002004 2005 <strong>2006</strong>Net cash provided byoperating activitiesNet cash used ininvesting activitiesNet cash used infinancing activitiesCash FlowsCash flow from operating activities resulted in a netcash inflow of ¥100.9 billion, mainly reflecting the¥46.4 billion loss before income taxes and minorityinterests, offset by ¥125.1 billion of depreciationand amortization charges. Cash flow from investingactivities resulted in a net cash outflow of ¥99.2billion, primarily relating to the acquisition of aircraft.Cash flow from financing activities resulted in a netcash outflow of ¥91.3 billion, resulting from financingthrough long-term loans, which were partially offsetby repayments of loans and redemptions of bonds.As a result of the above, cash and cash equivalentsdeclined ¥88.8 billion year-on-year to ¥172.1billion. In addition, free cash flow (total of cashflows from operating activities and cash flows frominvesting activities) declined ¥122.1 billion from¥123.8 billion in the previous term to ¥1.7 billion.Consolidated operating income: ¥17.0 billionConsolidated net income: ¥3.0 billionThe above target figures are subject to certainuncertainties and risks, including those mentionedbelow. In the event of the materialization of any ofthese risks (e.g., further increase in fuel prices), wewill make every effort to successfully implementadditional measures to mitigate the negativeimpact of such risks, including, if necessary, takingemergency measures.Notes to this MD&AFigures are rounded down to the nearest million yen, andratios are rounded up or down to the first decimal place.OutlookAlthough demand for passenger air transportationis expected to increase in line with the ongoingrecovery of the Japanese economy, aircraft fuel prices25
CONSOLIDATED BALANCE SHEETSJapan Airlines Corporation and Consolidated SubsidiariesThousands ofU.S. dollarsMillions of yen (Note 3)As of March 31, <strong>2006</strong> 2005 <strong>2006</strong>AssetsCurrent assets:Cash and time deposits (Note 4) ¥ 173,948 ¥ 252,573 $ 1,486,735Short-term investments in securities (Notes 4 and 5) 5,936 666 50,735Accounts receivable (Note 6):Trade 233,492 219,185 1,995,658Unconsolidated subsidiaries and affiliates 4,945 5,740 42,264Allowance for doubtful accounts (2,996) (2,905) (25,606)Flight equipment spare parts and supplies, at cost (Note 6) 83,717 76,335 715,529Deferred income taxes (Note 8) 9,539 9,618 81,529Prepaid expenses and other (Note 4) 178,737 121,960 1,527,666Total current assets 687,319 683,174 5,874,521Investments and advances (Note 6):Unconsolidated subsidiaries and affiliates 33,154 33,480 283,367Other (Note 5) 126,906 98,254 1,084,666Total investments and advances 160,061 131,734 1,368,042Property and equipment (Notes 6, 10, 11 and 15):Flight equipment 1,974,999 2,022,488 16,880,333Ground property and equipment 710,837 754,886 6,075,5292,685,837 2,777,375 22,955,871Accumulated depreciation (1,582,627) (1,612,847) (13,526,726)1,103,210 1,164,527 9,429,145Advances on flight equipment purchases and other (Note 14) 49,551 27,217 423,512Total property and equipment, net 1,152,762 1,191,744 9,852,666Software 70,373 67,871 601,478Long-term loans 13,364 14,383 114,222Deferred income taxes (Note 8) 52,085 44,595 445,170Bond issuance expenses 6 76 51Other assets (Note 15) 25,266 29,074 215,948¥2,161,240 ¥2,162,654 $18,472,136The accompanying notes are an integral part of these consolidated statements.26
Liabilities and stockholders’ equityCurrent liabilities:Thousands ofU.S. dollarsMillions of yen (Note 3)<strong>2006</strong> 2005 <strong>2006</strong>Short-term borrowings (Notes 4 and 6) ¥ 6,562 ¥ 11,611 $ 56,085Current portion of long-term debt (Notes 6 and 14) 145,323 127,974 1,242,076Accounts payable (Note 14):Trade 230,663 206,159 1,971,478Unconsolidated subsidiaries and affiliates 7,139 7,624 61,017Accrued expenses 49,000 50,684 418,803Accrued income taxes (Note 8) 4,700 6,464 40,170Deferred income taxes (Note 8) 29 154 247Other 201,423 158,465 1,721,564Total current liabilities 644,844 569,140 5,511,487Long-term debt (Notes 6 and 14) 1,084,521 1,178,932 9,269,410Accrued pension and severance costs (Note 7) 139,753 149,665 1,194,470Deferred income taxes (Note 8) 1,340 645 11,452Other noncurrent liabilities 115,264 43,749 985,162Minority interests 27,449 25,774 234,606Commitments and contingent liabilities (Notes 10, 11 and 14)Stockholders’ equity (Note 9):Common stock:Authorized: 6,936,918,000 shares in <strong>2006</strong> and 2005Issued: 1,982,383,250 shares in <strong>2006</strong> and 2005 100,000 100,000 854,700Capital surplus 136,145 136,141 1,163,632Accumulated deficit (90,186) (34,978) (770,820)Net unrealized gain on other securities, net of taxes (Note 5) 8,777 3,765 75,017Translation adjustments (5,776) (9,406) (49,367)Common stock in treasury, at cost: 2,863,896 shares in <strong>2006</strong>and 2,494,462 shares in 2005 (892) (775) (7,623)Total stockholders’ equity 148,066 194,746 1,265,521¥2,161,240 ¥2,162,654 $18,472,13627
CONSOLIDATED STATEMENTS OF OPERATIONSJapan Airlines Corporation and Consolidated SubsidiariesThousands ofU.S. dollarsMillions of yen (Note 3)Years ended March 31, <strong>2006</strong> 2005 2004 <strong>2006</strong>Operating revenues:Passenger:Domestic ¥ 659,998 ¥ 674,732 ¥ 668,888 $ 5,641,008International 690,226 671,291 549,764 5,899,367Cargo:Domestic 40,259 40,497 42,670 344,094International 189,015 179,031 161,331 1,615,512Incidental and other revenues 619,885 564,322 509,086 5,298,1622,199,385 2,129,876 1,931,742 18,798,162Operating expenses (Note 10):Wages, salaries and benefits (Note 7) 493,471 463,240 510,203 4,217,700Aircraft fuel 376,888 288,405 244,341 3,221,264Aircraft maintenance 90,883 89,428 82,206 776,777Aircraft rent 97,567 100,644 86,720 833,905Landing fees and other rent 233,715 239,288 233,230 1,997,564Purchased services 113,977 111,943 106,695 974,162Depreciation and amortization 125,126 124,713 119,388 1,069,452Commission 122,757 126,264 113,396 1,049,205Incidental and other expenses 571,831 529,799 503,203 4,887,4442,226,220 2,073,727 1,999,387 19,027,521Operating (loss) income (26,834) 56,149 (67,645) (229,350)Non-operating expenses:Interest and dividend income 3,713 3,170 2,928 31,735Interest expense (Note 10) (21,811) (24,875) (28,503) (186,418)Exchange gain, net 12,170 2,075 424 104,017Flight equipment purchase incentives — 48,386 29,260 —Gain on sales of ground property and equipment 19,093 1,905 1,330 163,188Gain on sales of investments in securities 585 1,334 1,235 5,000Subsidies received for purchases of aircraftfor isolated island routes 1,457 1,716 1,618 12,452Gain on partial termination of defined benefit plan (Note 7) 6,810 — — 58,205Loss on sales and disposal of flight equipment (12,171) (17,417) (13,946) (104,025)Loss on sales and disposal of ground property and equipment (6,052) (13,840) (5,153) (51,726)Equity in earnings of affiliates (Note 15) 1,899 1,514 1,221 16,230Loss on cancellation of lease contracts — (9,682) — —Loss on impairment of fixed assets (Note 15) (18,705) — — (159,871)Special termination benefits (Note 7) (4,033) (1,415) (1,485) (34,470)Other, net (2,562) (4,352) (3,431) (21,897)(19,605) (11,482) (14,503) (167,564)(Loss) income before income taxes and minority interests (46,440) 44,666 (82,148) (396,923)Income taxes (Note 8):Current 8,419 7,897 8,854 71,957Deferred (9,966) 4,251 (3,092) (85,179)(1,547) 12,148 5,761 (13,222)Minority interests (2,350) (2,420) (709) (20,085)Net (loss) income ¥ (47,243) ¥ 30,096 ¥ (88,619) $ (403,786)The accompanying notes are an integral part of these consolidated statements.28
CONSOLIDATED STATEMENTS OF STOCKHOLDERS’ EQUITY (NOTE 9)Japan Airlines Corporation and Consolidated SubsidiariesMillions of yenNet unrealizedNumber of (Accumulated gain (loss) onshares of deficit) other securities, Commoncommon stock Common Capital retained net of taxes Translation stock inin issue stock surplus earnings (Note 5) adjustments treasury TotalBalance April 1, 2003 1,980,465,250 ¥ 100,000 ¥ 147,175 ¥ 23,481 ¥ (780) ¥ (7,451) ¥(8,168) ¥ 254,256Net loss for the year endedMarch 31, 2004 (88,619) (88,619)Cash dividends (7,844) (7,844)Bonuses to directors and statutoryauditors (38) (38)Increase resulting from changein scope of consolidation 144 144Other (2,652) 3,567 (2,506) 2,966 1,375Balance at March 31, 2004 1,980,465,250 100,000 136,678 (65,031) 2,787 (9,958) (5,202) 159,273Net income for the year endedMarch 31, 2005 30,096 30,096Bonuses to directors andstatutory auditors (43) (43)Stock issuance in an exchangeof shares (kabushiki-kohkan) 65,000,000 5,069 (4,162) 906Retirement of common stockin treasury (63,082,000) (7,428) 7,428 —Other 1,821 978 552 1,160 4,513Balance at March 31, 2005 1,982,383,250 100,000 136,141 (34,978) 3,765 (9,406) (775) 194,746Net loss for the year endedMarch 31, <strong>2006</strong> (47,243) (47,243)Cash dividends (7,919) (7,919)Bonuses to directors andstatutory auditors (44) (44)Other 3 5,011 3,629 (117) 8,527Balance at March 31, <strong>2006</strong> 1,982,383,250 ¥100,000 ¥136,145 ¥(90,186) ¥8,777 ¥(5,776) ¥ (892) ¥148,066Thousands of U.S. dollars (Note 3)Net unrealized(Accumulated gain (loss) ondeficit) other securities,CommonCommon Capital retained net of taxes Translation stock instock surplus earnings (Note 5) adjustments treasury TotalBalance at April 1, 2005 $ 854,700 $ 1,163,598 $ (298,957) $ 32,179 $ (80,393) $ (6,623) $ 1,664,495Net loss for the year endedMarch 31, <strong>2006</strong> (403,786) (403,786)Cash dividends (67,683) (67,683)Bonuses to directors andstatutory auditors (376) (376)Other 25 42,829 31,017 (1,000) 72,880Balance at March 31, <strong>2006</strong> $854,700 $1,163,632 $(770,820) $75,017 $(49,367) $(7,623) $1,265,521The accompanying notes are an integral part of these consolidated statements.29
CONSOLIDATED STATEMENTS OF CASH FLOWSJapan Airlines Corporation and Consolidated SubsidiariesThousands ofU.S. dollarsMillions of yen (Note 3)Years ended March 31, <strong>2006</strong> 2005 2004 <strong>2006</strong>Operating activities:(Loss) income before income taxes and minority interests ¥ (46,440) ¥ 44,666 ¥ (82,148) $ (396,923)Adjustments to reconcile (loss) income before income taxesand minority interests to net cash provided by operatingactivities:Depreciation and amortization 125,126 124,713 119,388 1,069,452Gain on sales of, and loss on revaluation of,short-term investments in securities and investmentsin securities, net 1,295 (171) (569) 11,068Loss on sales and disposal of property and equipment andloss on impairment of fixed assets, net 17,138 25,702 17,846 146,478Net provision for accrued pension and severance costs (9,919) (13,645) 19,459 (84,777)Interest and dividend income (3,713) (3,170) (2,928) (31,735)Interest expense 21,811 24,875 28,503 186,418Exchange loss (gain), net 106 (200) 547 905Equity in earnings of affiliates (1,899) (1,514) (1,221) (16,230)Increase in notes and accounts receivable (13,120) (16,000) (7,215) (112,136)(Increase) decrease in flight equipment spare parts (7,365) (209) 2,387 (62,948)Increase in accounts payable 22,812 7,545 2,608 194,974Other 23,272 (15,743) 14,366 198,905Subtotal 129,103 176,848 111,023 1,103,444Interest and dividends received 4,151 3,648 3,386 35,478Interest paid (22,507) (25,686) (29,003) (192,367)Income taxes paid (9,762) (9,535) (9,060) (83,435)Net cash provided by operating activities 100,984 145,275 76,345 863,111Investing activities:Purchases of time deposits (969) (1,367) (1,092) (8,282)Proceeds from maturity of time deposits 917 281 996 7,837Purchases of property and equipment (146,972) (121,960) (151,585) (1,256,170)Proceeds from sales of property and equipment 48,403 94,927 57,285 413,700Purchases of investments in securities (7,584) (4,531) (974) (64,820)Proceeds from sales and maturity of investments insecurities 1,576 2,363 3,615 13,470Long-term loans receivable made (1,458) (2,787) (2,853) (12,461)Collection of long-term loans receivable 4,849 6,273 8,875 41,444Other 1,955 5,344 350 16,709Net cash used in investing activities (99,283) (21,456) (85,382) (848,572)30
Thousands ofU.S. dollarsMillions of yen (Note 3)Years ended March 31, <strong>2006</strong> 2005 2004 <strong>2006</strong>Financing activities:(Decrease) increase in short-term borrowings, net ¥ (5,355) ¥ 39 ¥ (9,976) $ (45,769)Proceeds from long-term loans 57,285 48,182 200,882 489,615Repayment of long-term loans (117,563) (130,978) (134,638) (1,004,811)Proceeds from issuance of bonds — 99,975 29,815 —Redemption of bonds (15,000) (23,700) (67,495) (128,205)Dividends paid to stockholders (7,846) (12) (7,813) (67,059)Dividends paid to minority interests (433) (315) (334) (3,700)Other (2,473) 519 (2,825) (21,136)Net cash (used in) provided by financing activities (91,384) (6,290) 7,615 (781,059)Effect of exchange rate changes on cash and cash equivalents 1,061 272 (1,568) 9,068Net (decrease) increase in cash and cash equivalents (88,622) 117,801 (2,991) (757,452)Cash and cash equivalents at beginning of year 260,933 143,327 146,318 2,230,196Decrease in cash and cash equivalents resulting fromexclusion of subsidiaries from consolidation (178) (195) — (1,521)Cash and cash equivalents at end of year (Note 4) ¥172,132 ¥260,933 ¥143,327 $1,471,213The accompanying notes are an integral part of these consolidated statements.31
NOTES TO CONSOLIDATED FINANCIAL STATEMENTSJapan Airlines Corporation and Consolidated Subsidiaries1. Summary of Significant Accounting Policiesa. Basis of presentationJapan Airlines Corporation and its consolidated domestic subsidiariesmaintain their accounting records and prepare their financialstatements in accordance with accounting principles generallyaccepted in Japan, which are different in certain respects as to theapplication and disclosure requirements of International Financial<strong>Report</strong>ing Standards, and its consolidated foreign subsidiaries, inconformity with those of their countries of domicile. The accompanyingconsolidated financial statements have been compiled fromthe consolidated financial statements filed with the FinancialServices Agency as required by the Securities and Exchange Law ofJapan and include certain additional financial information for theconvenience of readers outside Japan.As permitted by the Securities and Exchange Law of Japan,amounts of less than one million yen have been omitted. As aresult, the totals shown in the accompanying consolidated financialstatements (both in yen and U.S. dollars) do not necessarily agreewith the sum of the individual amounts.Certain amounts previously reported have been reclassified toconform to the current year’s classification.b. Principles of consolidation and accounting for investmentsin unconsolidated subsidiaries and affiliatesThe consolidated financial statements include the accounts of theCompany and all significant companies controlled directly or indirectlyby the Company. Companies over which the Company exercisessignificant influence in terms of their operating and financialpolicies have been included in the consolidated financial statementson an equity basis.The balance sheet date of 25 of the consolidated subsidiaries isDecember 31, for <strong>2006</strong> (27 for 2005), and for 1 consolidated subsidiary,it is the end of February. Any significant differences in intercompanyaccounts and transactions arising from interveningintercompany transactions during the period from January 1 throughMarch 31 and the period from March 1 through March 31 have beenadjusted, if necessary.The differences between the cost and the fair value of the netassets at the dates of acquisition of the consolidated subsidiaries andcompanies accounted for by the equity method are amortized by thestraight-line method over a period of 5 years.All significant intercompany accounts and transactions and unrealizedgain or loss on intercompany accounts and transactions havebeen eliminated.c. SecuritiesSecurities, except for investments in unconsolidated subsidiariesand affiliates, are classified as trading securities, held-to-maturitysecurities or other securities. Trading securities are carried at fairvalue. Held-to-maturity securities are carried at amortized cost.Marketable securities classified as other securities are carried at fairvalue with any unrealized gain or loss reported as a separate componentof stockholders’ equity, net of taxes. Non-marketable securitiesclassified as other securities are carried at cost. Cost ofsecurities sold is determined principally by the moving averagemethod.d. DerivativesDerivatives positions are stated at fair value.Gain or loss on derivatives designated as hedging instruments isdeferred until the loss or gain on the underlying hedged items isrecognized. Foreign receivables and payables are translated at theapplicable forward foreign exchange rates if certain conditions aremet. In addition, the related interest differential paid or receivedunder interest-rate swaps used as hedging instruments is recognizedover the terms of the swap agreements as an adjustment tothe interest expense of the underlying hedged items if certain conditionsare met.e. Property and equipmentProperty and equipment is stated at cost except as indicated in thefollowing paragraph.Under Japanese tax legislation, it is permissible to defer certaincapital gains, principally those arising from insurance claims, bycrediting them to the cost of certain properties. Deferred capitalgains at March 31, <strong>2006</strong> and 2005 amounted to ¥24,561 million($209,923 thousand) and ¥23,153 million, respectively.Depreciation of property and equipment is computed as follows:Flight equipment:Aircraft and spare engines:Boeing 747 —principally the declining-balance(with the exception method based on their estimatedof Boeing 747-400) useful livesBoeing 747-400 —the straight-line method based ontheir estimated useful livesBoeing 767 —principally the straight-line methodbased on their estimated useful livesBoeing 777 —the straight-line method based ontheir estimated useful livesBoeing 737 —the straight-line method based ontheir estimated useful livesDouglas DC-10 —principally the declining-balancemethod based on their estimateduseful livesDouglas MD-90 —the straight-line method based ontheir estimated useful livesDouglas MD-87 —the straight-line method based ontheir estimated useful livesDouglas MD-81 —the straight-line method based ontheir estimated useful livesAirbus A300 —the straight-line method based ontheir estimated useful livesAirbus A300-600 —the straight-line method based ontheir estimated useful lives32
Spare parts contained in flight equipment:—principally the declining-balancemethod based on each aircraft’s orengine’s estimated useful lifeGround property and equipment:—principally the straight-line methodbased on the estimated useful lives ofthe respective assetsThe estimated useful lives are as follows:Flight equipmentfrom 8 to 27 yearsGround property andequipmentfrom 2 to 65 yearsf. SoftwareComputer software intended for internal use is amortized by thestraight-line method based on its estimated useful life which rangesprincipally from 5 to 7 years.g. Bond issuance expensesBond issuance expenses are capitalized and are amortized over aperiod of 3 years.h. Accrued pension and severance costsTo provide for employees’ severance indemnities, net periodic pensioncost is accounted for based on the projected benefit obligationand the plan assets.The unrecognized obligation at transition is being amortized bythe straight-line method principally over a period of 15 years.The adjustment for actuarial assumptions is being amortized bythe straight-line method over a period ranging from 5 to 15 years,which is less than the average remaining years of service of the activeparticipants in the plans. Amortization is computed from the fiscalyear subsequent to the year in which the adjustment was recorded.Past service cost is principally charged to income as incurred.However, at certain consolidated subsidiaries, past service cost isbeing amortized by the straight-line method over a period which isless than the average remaining years of service of the active participantsin the plans.i. Foreign currency accountsForeign currency receivables and payables are translated into yenat the applicable year-end exchange rates and any gain or loss ontranslation is included in current earnings.Translation adjustments arising from the translation of assets,liabilities, revenues and expenses of the consolidated subsidiariesand affiliates accounted for by the equity method into yen at theapplicable year-end exchange rates are presented as minority interestsand as a separate component of stockholders’ equity.j. Revenue recognitionPassenger and cargo revenues are recognized when the transportationservices are rendered.k. LeasesAs lesseeThe Company and certain consolidated subsidiaries lease certainequipment under noncancelable lease agreements referred to ascapital leases. Capital leases, defined as leases which do not transferthe ownership of the leased property to the lessee, are principallyaccounted for as operating leases.As lessorCertain consolidated subsidiaries lease certain equipment undernoncancelable lease agreements referred to as direct financingleases. Direct financing leases, defined as leases which do nottransfer the ownership of the leased property to the lessee, are principallyaccounted for as operating leases.l. Appropriation of retained earnings and disposition ofaccumulated deficitUnder the Commercial Code of Japan, the appropriation of retainedearnings and disposition of accumulated deficit with respect to afinancial period is made by resolution of the stockholders at a generalmeeting to be held subsequent to the close of the financialperiod and the accounts for that period do not, therefore, reflectsuch appropriations and disposition. (Refer to Note 9)m. Cash equivalentsCash equivalents are defined as highly liquid, short-term investmentswith an original maturity of 3 months or less.2. Change in Accounting PolicyAccounting standard for impairment of fixed assetsEffective April 1, 2005, the Company and its domestic consolidatedsubsidiaries adopted a new accounting standard for impairmentof fixed assets (“Opinion Concerning the Establishment ofAccounting Standard for Impairment of Fixed Assets” issued by theBusiness Accounting Council on August 9, 2002) and the“Implementation Guidance on the Accounting Standard forImpairment of Fixed Assets” (Accounting Standard ImplementationGuidance No. 6 issued on October 31, 2003). The effect of theadoption of this standard was to decrease operating loss by ¥158million ($1,350 thousand) and to increase loss before income taxesand minority interests by ¥18,549 million ($158,538 thousand) forthe year ended March 31, <strong>2006</strong>.Accumulated impairment losses have been directly deductedfrom the carrying amounts of the respective fixed assets.3. U.S. Dollar AmountsAmounts in U.S. dollars are included solely for the convenience ofthe reader. The rate of ¥117 = U.S.$1.00, the approximateexchange rate prevailing on March 31, <strong>2006</strong>, has been used intranslation. The inclusion of such amounts is not intended to implythat yen have been or could be readily converted, realized or settledin U.S. dollars at that or any other rate.33
4. Cash and Cash EquivalentsThe components of cash and cash equivalents at March 31, <strong>2006</strong>and 2005 were as follows:Thousands ofMillions of yen U.S. dollarsMarch 31, <strong>2006</strong> 2005 <strong>2006</strong>Cash and time deposits ¥173,948 ¥252,573 $1,486,735Time deposits with a maturityof more than three months (1,726) (1,513) (14,752)Short-term investments insecurities with a maturityof three months or less 0 0 0Short-term investments includedin other current assets, with amaturity of three months or less — 9,998 —Credit balances of currentaccounts included inshort-term borrowings (90) (126) (769)¥172,132 ¥260,933 $1,471,2135. Fair Value of SecuritiesNo trading securities or held-to-maturity securities were held atMarch 31, <strong>2006</strong> and 2005. Securities classified as other securitiesare included in “short-term investments in securities” and “investmentsand advances — other” in the accompanying consolidatedbalance sheets.The components of unrealized gain or loss on marketable securitiesclassified as other securities at March 31, <strong>2006</strong> and 2005 aresummarized as follows:Millions of yenAcquisition Carrying UnrealizedMarch 31, <strong>2006</strong> costs value gain (loss)Unrealized gain:Stocks ¥14,498 ¥29,003 ¥14,504Bonds:Government bonds 7 8 0Other 663 670 715,169 29,682 14,512Unrealized loss:Stocks 2,322 2,094 (228)Bonds:Corporate bonds 10 9 (0)Other 5,050 5,047 (3)7,383 7,151 (232)Total ¥22,552 ¥36,833 ¥14,280March 31, <strong>2006</strong>Thousands of U.S. dollarsUnrealized gain:Stocks $123,914 $247,888 $123,965Bonds:Government bonds 59 68 0Other 5,666 5,726 59129,649 253,692 124,034Unrealized loss:Stocks 19,846 17,897 (1,948)Bonds:Corporate bonds 85 76 (0)Other 43,162 43,136 (25)63,102 61,119 (1,982)Total $192,752 $314,811 $122,051March 31, 2005Millions of yenUnrealized gain:Stocks ¥14,067 ¥21,052 ¥6,985Bonds:Government bonds 17 19 1Corporate bonds 42 42 0Other 738 748 914,866 21,863 6,997Unrealized loss:Stocks 2,529 1,968 (560)Bonds:Corporate bonds 10 9 (0)Other 316 311 (5)2,855 2,289 (565)Total ¥17,721 ¥24,153 ¥6,431Non-marketable securities classified as other securities at March31, <strong>2006</strong> and 2005 amounted to ¥28,171 million ($240,777 thousand)and ¥26,851 million, respectively.Proceeds from sales of securities classified as other securitiesfor the years ended March 31, <strong>2006</strong>, 2005 and 2004 amounted to¥837 million ($7,153 thousand), ¥156 million and ¥16,541 million,respectively. The aggregate gain realized on those sales for theyears ended March 31, <strong>2006</strong>, 2005 and 2004 totaled ¥100 million($854 thousand), ¥75 million and ¥500 million, respectively, andthe aggregate loss realized on those sales for the years endedMarch 31, <strong>2006</strong>, 2005 and 2004 totaled ¥0 million ($0 thousand),¥3 million and ¥19 million, respectively.The redemption schedule at March 31, <strong>2006</strong> for bonds withmaturity dates is summarized as follows:Millions of yenDue after one Due after fiveDue in one year through years throughMarch 31, <strong>2006</strong> year or less five years ten yearsGovernment bonds ¥ — ¥— ¥7Corporate bonds 10 — —Other 468 — —Total ¥478 ¥— ¥7Thousands of U.S. dollarsMarch 31, <strong>2006</strong>Government bonds $ — $— $59Corporate bonds 85 — —Other 4,000 — —Total $4,085 $— $596. Short-Term Borrowings and Long-Term DebtThe weighted-average interest rates for short-term borrowings outstandingat March 31, <strong>2006</strong> and 2005 were 1.7% and 1.5%,respectively.34
Long-term debt at March 31, <strong>2006</strong> and 2005 consisted of thefollowing:Thousands ofMillions of yen U.S. dollarsMarch 31, <strong>2006</strong> 2005 <strong>2006</strong>Bonds:Zero-coupon convertible bondin euro-yen, due 2011 ¥ 100,000 ¥ 100,000 $ 854,700Japanese yen bonds,due 2005 to 2018, atrates ranging from1.5% to 3.4% 210,000 225,000 1,794,871Loans with collateral,due 2005 to 2020, atrates ranging from0.16% to 7.91% 499,700 544,321 4,270,940Loans without collateral,due 2005 to 2030, at ratesranging from 0.05% to 6.6% 413,346 428,539 3,532,871Other 6,797 9,047 58,0941,229,844 1,306,907 10,511,487Less current portionof long-term debt (145,323) (127,974) (1,242,076)¥1,084,521 ¥1,178,932 $ 9,269,410The convertible bond, unless previously redeemed, is convertibleinto shares of common stock of the Company at the following currentconversion price:Conversion priceper shareConversionperiodZero-coupon convertible bond in ¥440.00 April 19, 2004–euro-yen, due 2011 March 11, 2011The aggregate annual maturities of long-term debt subsequent toMarch 31, <strong>2006</strong> are summarized as follows:Thousands ofMillions of yen U.S. dollarsYear ending March 31,2007 ¥ 145,323 $ 1,242,0762008 184,490 1,576,8372009 152,392 1,302,4952010 170,041 1,453,3412011 and thereafter 577,596 4,936,717¥1,229,844 $10,511,487A summary of assets pledged as collateral at March 31, <strong>2006</strong> and2005 is as follows:Thousands ofMillions of yen U.S. dollarsMarch 31, <strong>2006</strong> 2005 <strong>2006</strong>Flight equipment, net ofaccumulated depreciation ¥549,678 ¥556,308 $4,698,102Flight equipment spare parts 51,876 49,675 443,384Investments in affiliates andother securities 53,705 37,070 459,017Ground property andequipment, net ofaccumulated depreciationand other 177,084 201,120 1,513,538¥832,344 ¥844,174 $7,114,0517. Accrued Pension and Severance CostsAn employee whose employment is terminated is entitled, in mostcases, to pension annuity payments or to a lump-sum severancepayment determined by reference to the basic rate of pay, length ofservice and the conditions under which the termination occurs.Certain significant domestic consolidated subsidiaries haveestablished contributory defined benefit pension plans pursuant tothe Welfare Pension Insurance Law of Japan, i.e., welfare pensionfund plans (WPFPs). Each WPFP consists of the governmental welfarepension program (the substitutional portion) and an additionalnon-contributory pension plan portion. In addition, certain consolidatedsubsidiaries have maintained their non-contributory definedbenefit pension plans and lump-sum severance indemnity plans.The <strong>JAL</strong> Pension Fund, in which Japan Airlines InternationalCo., Ltd. (“<strong>JAL</strong>I,” a wholly owned subsidiary of the Company) is aparticipant, introduced an option similar to a cash-balance planwith certain other options in addition to the existing options.The <strong>JAL</strong> Group Pension Fund established by certain consolidatedsubsidiaries received approval from the Minister of Health, Laborand Welfare with respect to its application for exemption from thebenefit obligation related to future employee services under thesubstitutional portion of the WPFP on April 1, 2005, and the portionrelated to past services on April 1, <strong>2006</strong>. Following this approval,the <strong>JAL</strong> Group Pension Fund was reorganized on April 1, <strong>2006</strong> anda cash-balance plan option was introduced.On October 1, 2005, <strong>JAL</strong>I introduced a revised pension schemeunder which employees have the option to change a portion of theirexisting lump-sum payment of retirement benefits to a defined contributionplan or to an early payment scheme.Certain consolidated subsidiaries transferred a portion of theirretirement benefit plans to defined contribution plans primarily onJuly 1, 2005 or April 1, <strong>2006</strong>.The projected benefit obligation and the funded status of theplans are summarized as follows:Thousands ofMillions of yen U.S. dollarsMarch 31, <strong>2006</strong> 2005 <strong>2006</strong>Projected benefit obligation ¥(906,240) ¥(906,702) $(7,745,641)Plan assets 512,000 423,435 4,376,068Accrued pension andseverance costs 139,753 149,665 1,194,470Prepaid pension andseverance costs (18,674) (21,975) (159,606)Net unrecognized amount ¥(273,161) ¥(355,577) $(2,334,709)In computing the projected benefit obligation, small companies arepermitted to adopt several simplified methods and certain subsidiarieshave done so.In addition, shares of common stock of certain consolidated subsidiarieswere pledged as collateral at March 31, <strong>2006</strong> and 2005.35
The net unrecognized amounts were as follows:Millions of yenMarch 31, <strong>2006</strong> 2005Thousands ofU.S. dollars<strong>2006</strong>Unrecognized benefitobligation at transition ¥(131,338) ¥(147,215) $(1,122,547)Adjustment for actuarialassumptions (144,530) (209,225) (1,235,299)Past service cost 2,707 863 23,136Net unrecognized amounts ¥(273,161) ¥(355,577) $(2,334,709)The substitutional portions of the WPFP benefits have beenincluded in the amounts shown in the above tables.The <strong>JAL</strong> Group Pension Fund established by certain consolidatedsubsidiaries received approval from the Minister of Health,Labor and Welfare with respect to its application for exemption fromthe benefit obligation related to future employee services under thesubstitutional portion of the WPFP on April 1, 2005, and the portionrelated to past services on April 1, <strong>2006</strong>. The operation of this fundwas reorganized on April 1, <strong>2006</strong>. At March 31, <strong>2006</strong>, the estimatedamount of pension assets to be transferred was ¥7,894 million($67,470 thousand). The potential effect on consolidated profitand loss, estimated in accordance with Paragraph 44-2 of the“Practical Guidelines on Retirement Benefits Accounting (Interim<strong>Report</strong>),” <strong>Report</strong> No. 13 of the Accounting System Committee ofthe Japanese Institute of Certified Public Accountants, as if thetransfer of pension assets had been made as of March 31, <strong>2006</strong>,was a gain of ¥1,526 million ($13,042 thousand) and a loss of¥842 million ($7,196 thousand). An accrual for the estimated lossof ¥842 million ($7,196 thousand) was recorded for the year endedMarch 31, <strong>2006</strong> as accrued pension and severance costs.On October 1, 2005, <strong>JAL</strong>I introduced a revised pension schemeunder which employees have the option to change a portion of theexisting lump-sum payment of retirement benefits to a defined contributionplan or to an early payment scheme. As a result, lossbefore income taxes and minority interests decreased by ¥6,810million ($58,205 thousand) for the year ended March 31, <strong>2006</strong>.The portion of the unrecognized obligation at transition whichrelates to reducing the benefit obligation by the introduction of theoption referred to above is being amortized by the straight-linemethod over a period of 8 years in accordance with Paragraph 15,“Transitional Arrangement,” of “Accounting for the Transferbetween Retirement Benefit Plans” (Accounting StandardImplementation Guidance No. 1). The effect of the adoption of thetransitional arrangement was to decrease accrued pension and severancecosts by ¥1,033 million ($8,829 thousand) and loss beforeincome taxes and minority interests by ¥1,033 million ($8,829thousand). Certain consolidated subsidiaries revised a portion oftheir retirement benefit plans to defined contribution plans primarilyon July 1, 2005 or April 1, <strong>2006</strong> and applied “Accounting for theTransfer between Retirement Benefit Plans” (Accounting StandardImplementation Guidance No. 1). As a result, loss before incometaxes and minority interests increased by ¥643 million ($5,495thousand) for the year ended March 31, <strong>2006</strong>.The effects of the revisions made by <strong>JAL</strong>I and certain consolidatedsubsidiaries to their projected benefit obligation and unrecognizedbenefit obligation at transition are summarized as follows:Millions of Thousands ofyen U.S. dollarsMarch 31, <strong>2006</strong><strong>2006</strong>Decrease in projected benefit obligation ¥17,119 $146,316Decrease in plan assets (109) (931)Unrecognized benefit obligation at transition (639) (5,461)Adjustment for actuarial assumptions (771) (6,589)Decrease in accrued pension andseverance costs ¥15,599 $133,324As a result of these revisions, <strong>JAL</strong>I and certain consolidated subsidiariesdetermined to transfer the related pension plan assets totheir defined contribution plans over 8 years. The amount of assetsto be transferred totaled ¥9,431 million ($80,606 thousand) at transition.The assets which had not been transferred totaled ¥8,039million ($68,709 thousand) as of March 31, <strong>2006</strong>, and the currentportion accrued is presented herein as “current liabilities — other”and the non-current portion accrued is presented herein as “othernon-current liabilities.”On September 10, 2004, the <strong>JAL</strong> Pension Fund resolved torevise its internal regulations to introduce an option similar to acash-balance plan with certain other options in addition to the existingoptions. As a result, operating income and income beforeincome taxes and minority interests for the year ended March 31,2005 increased by ¥51,292 million.In the semiannual consolidated financial statements for the sixmonths ended September 30, 2004, the Company reported thatoperating income and income before income taxes and minorityinterests for the six months ended September 30, 2004 increasedby ¥62,401 million, based on the resolution above. However, therevised internal regulations filed with and approved by the regulatoryauthorities were partially changed from those on which the resolutionwas based and this change has been reflected in the consolidatedfinancial statements for the year ended March 31, 2005.On August 13, 2003, a certain domestic subsidiary receivedapproval from the Minister of Health, Labor and Welfare withrespect to its application for exemption from the benefit obligationrelated to future employee services under the substitutional portionof the WPFP. In accordance with paragraph 47-2 of the “PracticalGuidelines on Retirement Benefits Accounting (Interim <strong>Report</strong>),”<strong>Report</strong> No. 13 of the Accounting System Committee of theJapanese Institute of Certified Public Accountants, this subsidiaryaccounted for the separation of the substitutional portion from thecorporate portion of the benefit obligation under its WPFP as of thedate of approval of the exemption, assuming that the transfer to theJapanese Government of the substitutional portion of the benefitobligation and the related portion of the pension plan assets hadbeen completed as of that date. As a result, the subsidiary recognizeda gain of ¥755 million for the year ended March 31, 2004. AtMarch 31, 2004, the pension plan assets to be transferred werecalculated at ¥2,343 million.36
The components of net periodic pension and severance costsexcluding the employees’ contributory portion were as follows:Thousands ofMillions of yen U.S. dollarsYears ended March 31, <strong>2006</strong> 2005 2004 <strong>2006</strong>Service cost ¥30,681 ¥32,738 ¥31,421 $262,230Interest cost on projectedbenefit obligation 23,527 23,848 27,386 201,085Expected return on plan assets (20,019) (18,895) (15,987) (171,102)Amortization of unrecognizedseverance benefit obligationat transition 14,675 14,819 14,844 125,427Amortization of adjustment foractuarial assumptions 17,373 16,706 12,554 148,487Amortization of past servicecost (5,558) (51,362) (126) (47,504)Subtotal 60,681 17,855 70,093 518,641Other 722 126 — 6,170Net periodic pension cost 61,403 17,982 70,093 524,811Loss on separation ofsubstitutional portion ofprojected benefit obligationof the WPFP 842 — — 7,196Gain on termination ofdefined benefit plans, net (6,167) — — (52,709)Total ¥56,077 ¥17,982 ¥70,093 $479,290Special additional termination benefits paid, but not included indetermining the projected benefit obligation, were charged toincome when paid. The amounts charged to income amounted to¥4,033 million ($34,470 thousand), ¥1,415 million and ¥1,485million for the years ended March 31, <strong>2006</strong>, 2005 and 2004,respectively.The assumptions used were as follows:Discount rates 1.7% - 2.8% 2.5% - 2.8% 2.5% - 2.8%Expected rates of returnon plan assets 0.8% - 5.1% 0.0% - 5.5% 0.0% - 5.5%8. Income Taxes<strong>2006</strong> 2005 2004The Company and certain domestic subsidiaries have adopted theJapanese consolidated corporate tax return system.The significant components of deferred tax assets and liabilitiesand the related valuation allowance at March 31, <strong>2006</strong> and 2005were as follows:Thousands ofMillions of yen U.S. dollarsMarch 31, <strong>2006</strong> 2005 <strong>2006</strong>Deferred tax assets:Accrued pension andseverance costs ¥ 50,704 ¥ 45,687 $ 433,367Revaluation loss on investmentsin unconsolidated subsidiariesand affiliates 24,814 21,494 212,085Flight equipment purchaseincentives 17,624 179 150,632Net deferred gain onhedging instruments 12,053 9,783 103,017Loss on impairment offixed assets 8,055 — 68,846Accounts payable — trade 5,610 4,198 47,948Revaluation loss on flightequipment spare parts 4,044 3,630 34,564Allowance for doubtful accounts 2,191 2,427 18,726Tax loss carryforwards 20,281 24,724 173,341Other 19,855 22,419 169,700165,236 134,545 1,412,273Deferred tax liabilities:Unrealized gain onother securities (5,593) (2,487) (47,803)Accumulated earnings ofconsolidated subsidiariesand affiliates (5,234) (6,006) (44,735)Other (3,855) (3,309) (32,948)(14,684) (11,803) (125,504)Valuation allowance (90,297) (69,328) (771,769)Net deferred tax assets ¥ 60,254 ¥ 53,412 $ 514,991A reconciliation between the Japanese statutory tax rate and theCompany’s and the consolidated subsidiaries’ effective tax rate forthe year ended March 31, 2005 is summarized as follows:Year ended March 31, 2005Statutory tax rate 40.7%Disallowed expenses, including entertainmentexpenses 4.3Non-taxable income, including dividendsreceived (9.6)Equity in earnings of affiliates (1.4)Inhabitants’ per capita taxes 0.7Changes in valuation allowance (10.4)Tax effect on undistributed earnings ofconsolidated subsidiaries and affiliates 2.2Differences in tax rates of consolidatedsubsidiaries (2.1)Other 2.8Effective tax rate 27.2%For the years ended March 31, <strong>2006</strong> and 2004, reconciliationsbetween the Japanese statutory tax rates and the Company’s andthe consolidated subsidiaries’ effective tax rates were not requiredto be disclosed since the Company and the consolidated subsidiariesrecorded loss before income taxes and minority interests.The statutory tax rates for the years ended March 31, <strong>2006</strong> and2004 were 40.7% and 43.9%, respectively.37
9. Stockholders’ EquityThe Commercial Code of Japan (the “Code”) provides that anamount equal to at least 10% of the amount to be disbursed as distributionsof earnings be appropriated to the legal reserve until thesum of the legal reserve and the additional paid-in capital accountequals 25% of the common stock account. The Code provides thatneither additional paid-in capital nor the legal reserve is availablefor dividends, but both may be used to reduce or eliminate a deficitby resolution of the stockholders or may be transferred to commonstock upon approval by the Board of Directors. The Code furtherprovides that if the total amount of additional paid-in capital and thelegal reserve exceeds 25% of the amount of common stock, theexcess may be distributed to the stockholders either as a return ofcapital or as dividends subject to the approval of the stockholders.The Company’s shares of common stock have no par value inaccordance with the Code.The new Corporation Law of Japan (the “Law”), which supersededmost of the provisions of the Commercial Code of Japan,went into effect on May 1, <strong>2006</strong>. The Law stipulates similar requirementson distribution of earnings to those of the Code. Under theLaw, however, such distributions can be made at any time by resolutionof the stockholders, or by the Board of Directors if certainconditions are met.10. LeasesAs lesseeThe following pro forma amounts represent the acquisition costs,accumulated depreciation and net book value of the leased propertyat March 31, <strong>2006</strong> and 2005, and the related depreciation andinterest expense for the years ended March 31, <strong>2006</strong>, 2005 and2004, which would have been reflected in the consolidated balancesheets and the related consolidated statements of operations if capitallease accounting had been applied to the capital leases currentlyaccounted for as operating leases:Millions of yenGroundFlight property andMarch 31, <strong>2006</strong> equipment equipment TotalAcquisition costs ¥564,783 ¥17,452 ¥582,235Less accumulateddepreciation (181,053) (8,995) (190,049)Net book value ¥383,730 ¥ 8,456 ¥392,186Thousands of U.S. dollarsMarch 31, <strong>2006</strong>Acquisition costs $4,827,205 $149,162 $4,976,367Less accumulateddepreciation (1,547,461) (76,880) (1,624,350)Net book value $3,279,743 $ 72,273 $3,352,017Millions of yenMarch 31, 2005Acquisition costs ¥571,954 ¥16,516 ¥588,471Less accumulateddepreciation (192,296) (7,277) (199,574)Net book value ¥379,657 ¥ 9,239 ¥388,896Thousands ofMillions of yen U.S. dollarsYears ended March 31, <strong>2006</strong> 2005 2004 <strong>2006</strong>Depreciation expense ¥53,715 ¥53,438 ¥48,654 $459,102Interest expense ¥ 5,369 ¥ 5,550 ¥ 5,090 $ 45,888No impairment loss has been recognized on leased property for theyear ended March 31, <strong>2006</strong>.Lease expenses relating to capital leases accounted for as operatingleases amounted to ¥58,155 million ($497,051 thousand),¥59,541 million and ¥55,537 million for the years ended March 31,<strong>2006</strong>, 2005 and 2004, respectively.The present value of future rental expenses under capital leasesaccounted for as operating leases outstanding at March 31, <strong>2006</strong>and 2005 were as follows:Thousands ofMillions of yen U.S. dollarsMarch 31, <strong>2006</strong> 2005 <strong>2006</strong>Within 1 year ¥ 51,839 ¥ 51,004 $ 443,068Over 1 year 347,488 345,002 2,969,982¥399,327 ¥396,007 $3,413,051Future rental expenses under operating leases outstanding atMarch 31, <strong>2006</strong> and 2005 were as follows:Thousands ofMillions of yen U.S. dollarsMarch 31, <strong>2006</strong> 2005 <strong>2006</strong>Within 1 year ¥ 27,668 ¥ 27,274 $ 236,478Over 1 year 192,877 164,947 1,648,521¥220,546 ¥192,222 $1,885,008As lessorThe following amounts represent the acquisition costs, accumulateddepreciation and net book value of the financing leasesaccounted for as operating leases at March 31, <strong>2006</strong> and 2005,and the related depreciation expense and interest revenues for theyears ended March 31, <strong>2006</strong>, 2005 and 2004, which are reflectedin the consolidated balance sheets and the related consolidatedstatements of operations:Millions of yenMarch 31, <strong>2006</strong>Ground property and equipmentAcquisition costs ¥815Less accumulated depreciation (450)Net book value ¥364Thousands of U.S. dollarsMarch 31, <strong>2006</strong>Acquisition costs $6,965Less accumulated depreciation (3,846)Net book value $3,111Millions of yenMarch 31, 2005Acquisition costs ¥1,940Less accumulated depreciation (1,421)Net book value ¥ 51938
Thousands ofMillions of yen U.S. dollarsYears ended March 31, <strong>2006</strong> 2005 2004 <strong>2006</strong>Depreciation expense ¥281 ¥409 ¥513 $2,401Interest revenues ¥ 17 ¥ 27 ¥ 51 $ 145No impairment loss has been recognized on leased property for theyear ended March 31, <strong>2006</strong>.Lease revenues relating to direct financing leases accounted foras operating leases amounted to ¥317 million ($2,709 thousand),¥467 million and ¥602 million for the years ended March 31, <strong>2006</strong>,2005 and 2004, respectively.The present value of future rental revenues under direct financingleases accounted for as operating leases outstanding at March31, <strong>2006</strong> and 2005 was as follows:Thousands ofMillions of yen U.S. dollarsMarch 31, <strong>2006</strong> 2005 <strong>2006</strong>Within 1 year ¥146 ¥289 $1,247Over 1 year 226 251 1,931¥372 ¥540 $3,179Future rental revenues under operating leases outstanding atMarch 31, 2005 are summarized as follows:Millions of yenMarch 31, 2005Within 1 year ¥15Over 1 year —¥1511. Commitments and Contingent LiabilitiesCommitments outstanding at March 31, <strong>2006</strong> for the purchases ofsignificant property and equipment amounted to ¥1,345,556 million($11,500,478 thousand).Certain consolidated subsidiaries lease aircraft, office space,hotel facilities, warehouses and office equipment. These leases arecustomarily renewed upon expiration.At March 31, <strong>2006</strong>, contingent liabilities for guarantees, principallyfor an unconsolidated subsidiary, affiliates and employees,amounted to ¥16,887 million ($144,333 thousand), and contingentliabilities for commitments such as guarantees, keep-well agreementsand other, and for affiliates and employees amounted to¥686 million ($5,863 thousand).One consolidated subsidiary provides a line-of-credit facility asa part of its financing activities. The amounts provided, used andunused, at March 31, <strong>2006</strong> were ¥1,590 million ($13,589 thousand),¥12 million ($102 thousand) and ¥1,577 million ($13,478thousand), respectively.<strong>JAL</strong>I is alleged to have been involved in anti-competitive practicessuch as price-fixing and collusion with several internationalcargo operators and its cargo operation office in Frankfurt wasinvestigated by the European Union antitrust authorities onFebruary 14, <strong>2006</strong>. On the same date, the U.S. Department ofJustice inspected <strong>JAL</strong>I’s cargo operation office in New York. In relationto the investigation of alleged anti-competitive practices, certainair cargo customers have filed several class action lawsuits in theU.S since February 17, <strong>2006</strong> against international cargo operatorsincluding <strong>JAL</strong>I claiming that alleged price-fixing practices havedamaged their interests and such practices should be injuncted.The plaintiffs are seeking unspecified treble damages, unspecifiedinjuctive relief, and costs and attorneys’ fees, however, no specificamounts of damages or compensation have been claimed in theseclass action proceedings. In Canada, several class action lawsuitshave been filed seeking similar relief, but only compensatory damagesare allowable under Canadian law. Management of theCompany holds the view that investigations and class action lawsuitson alleged anti-competitive practices could have a materialimpact on the results of operations of the Company and the group.However management is unable to estimate the possible outcomeof the ongoing investigation and class action lawsuits reasonably atthis stage since investigations by the authorities of a number ofjurisdictions, which include, but may not be limited to, theEuropean Union, the United States, Switzerland and New Zealand,are still ongoing.12. Amounts Per ShareBasic net (loss) income per share has been computed based on thenet (loss) income allocable to or available for distribution to the stockholdersof common stock and the weighted-average number ofshares of common stock outstanding during each year, and dilutednet income per share is computed based on the net income availablefor distribution to the stockholders and the weighted-average numberof shares of common stock outstanding during each year after givingeffect to the potentially dilutive securities to issued upon the conversionof a convertible bonds. However, diluted net income per sharehas not been presented for the year ended March 31, <strong>2006</strong> sincethe Company posted a net loss, and for the year ended March 31,2004 since the Company and its consolidated subsidiaries held nopotentially dilutive securities at March 31, 2004.Yen U.S. dollarsYears ended March 31, <strong>2006</strong> 2005 2004 <strong>2006</strong>Net (loss) income per shareof common stock:Basic ¥(23.88) ¥15.24 ¥(45.19) $(0.204)Diluted ¥ — ¥13.66 ¥ — $ —39
The following table sets forth the computation of basic net (loss)income per share of common stock and diluted net income pershare of common stock for the years ended March 31, <strong>2006</strong>, 2005and 2004:Thousands ofMillions of yen U.S. dollarsYears ended March 31, <strong>2006</strong> 2005 2004 <strong>2006</strong>Net (loss) income(allocable to) availablefor stockholders ofcommon stock:Net (loss) income ¥(47,243) ¥30,096 ¥(88,619) $(403,786)Less: Appropriations forpayment of bonuses todirectors and statutoryauditors (31) (43) (42) (264)¥(47,274) ¥30,053 ¥(88,661) $(404,051)Thousands of sharesYears ended March 31, <strong>2006</strong> 2005 2004Weighted-average number ofshares of common stockoutstanding 1,979,708 1,972,336 1,961,792Effect of dilutive securities:Convertible bond — 227,272 —Net assets per share have been computed based on the net assetsavailable for distribution to stockholders of common stock and thenumber of shares of common stock outstanding at each balancesheet date.Yen U.S. dollarsMarch 31, <strong>2006</strong> 2005 <strong>2006</strong>Net assets per share ¥74.78 ¥98.34 $0.63913. Segment Informationoperations, card and lease operations, trading and other airlinerelatedbusiness. This segmentation has been determined for internalmanagement purposes.Until the year ended March 31, 2005, businesses other than airtransportation business, airline-related business and travel serviceswere insignificant to the consolidated results of operations of theCompany and its consolidated subsidiaries and, accordingly, havebeen included in “Other.” Effective April 1, 2005, card and leaseoperations has been presented as a new segment since its materialityhas increased.Based on the new segmentation, the Company has restated thepreviously reported business segments for the years ended March31, 2005 and 2004.Until the year ended March 31, 2003, the business segmentinformation was presented in four major categories: the air transportation,the travel services, the hotel and resort operations and asegment entitled ‘other’ which included card and lease operations,trading and other airline-related business.Effective the year ended March 31, 2004, the Company revisedits method of segmentation. The airline-related business, which hadbeen included in “Other” until the year ended March 31, 2003, waspresented as a new segment since, under the Company’s currentbusiness strategies, it is a separate function of the air transportationbusiness. In addition, the hotel and resort operations business,which had been presented as a separate segment until the yearended March 31, 2003, were included in “Other” for the yearended March 31, 2004 since its size decreased following a changein basic business strategy under which it now operates its businessesunder a system of administrative contracts.a. Business segment informationThe Company and its consolidated subsidiaries conduct worldwideoperations in air transportation, travel services, hotel and resortThe business segment information of the Company and its consolidated subsidiaries for the years ended March 31, <strong>2006</strong>, 2005 and 2004is summarized as follows:Millions of yenGeneralcorporateAirline- Card and assets andYear ended Air trans- related Travel lease intercompany Consoli-March 31, <strong>2006</strong> portation business services operations Other Total eliminations datedOperating revenues ¥1,515,602 ¥149,814 ¥379,435 ¥ 14,264 ¥140,268 ¥2,199,385 ¥ — ¥2,199,385Inter-group sales andtransfers 217,380 193,102 35,950 45,881 72,374 564,690 (564,690) —Total 1,732,983 342,917 415,385 60,146 212,643 2,764,075 (564,690) 2,199,385Operating expenses 1,776,412 337,065 414,723 55,837 206,539 2,790,577 (564,357) 2,226,220Operating (loss) income ¥ (43,429) ¥ 5,852 ¥ 662 ¥ 4,309 ¥ 6,104 ¥ (26,501) ¥ (332) ¥ (26,834)Identifiable assets ¥1,942,227 ¥127,386 ¥ 75,398 ¥170,713 ¥119,946 ¥2,435,673 ¥(274,433) ¥2,161,240Depreciation andamortization ¥ 108,369 ¥ 3,120 ¥ 1,171 ¥ 8,788 ¥ 3,943 ¥ 125,392 ¥ (266) ¥ 125,126Loss on impairment offixed assets ¥ 3,739 ¥ 1,394 ¥ 49 ¥ — ¥ 13,597 ¥ 18,780 ¥ (74) ¥ 18,705Capital expenditures ¥ 137,748 ¥ 1,693 ¥ 932 ¥ 927 ¥ 4,272 ¥ 145,575 ¥ (108) ¥ 145,46640
Thousands of U.S. dollarsYear ended March 31, <strong>2006</strong>Operating revenues $12,953,863 $1,280,461 $3,243,034 $ 121,914 $1,198,871 $18,798,162 $ — $18,798,162Inter-group sales andtransfers 1,857,948 1,650,444 307,264 392,145 618,581 4,826,410 (4,826,410) —Total 14,811,820 2,930,914 3,550,299 514,068 1,817,461 23,624,572 (4,826,410) 18,798,162Operating expenses 15,183,008 2,880,897 3,544,641 477,239 1,765,290 23,851,085 (4,823,564) 19,027,521Operating (loss) income $ (371,188) $ 50,017 $ 5,658 $ 36,829 $ 52,170 $ (226,504) $ (2,837) $ (229,350)Identifiable assets $16,600,230 $1,088,769 $ 644,427 $1,459,085 $1,025,179 $20,817,717 $(2,345,581) $18,472,136Depreciation andamortization $ 926,230 $ 26,666 $ 10,008 $ 75,111 $ 33,700 $ 1,071,726 $ (2,273) $ 1,069,452Loss on impairment offixed assets $ 31,957 $ 11,914 $ 418 $ — $ 116,213 $ 160,512 $ (632) $ 159,871Capital expenditures $ 1,177,333 $ 14,470 $ 7,965 $ 7,923 $ 36,512 $ 1,244,230 $ (923) $ 1,243,299As described in Note 2, Effective April 1, 2005, the Company and its domestic consolidated subsidiaries adopted a new accounting standardfor impairment of fixed assets (“Opinion Concerning the Establishment of Accounting Standard for Impairment of Fixed Assets” issued by theBusiness Accounting Council on August 9, 2002) and the “Implementation Guidance on the Accounting Standard for Impairment of FixedAssets” (Accounting Standard Implementation Guidance No. 6 issued on October 31, 2003). As a result, operating income for the year endedMarch 31, <strong>2006</strong> increased by ¥158 million ($1,350 thousand) in the “Other.”Millions of yenYear ended March 31, 2005Operating revenues ¥1,493,701 ¥103,157 ¥381,784 ¥ 17,811 ¥133,421 ¥2,129,876 ¥ — ¥2,129,876Inter-group sales andtransfers 207,666 190,618 42,755 40,634 76,222 557,897 (557,897) —Total 1,701,367 293,776 424,539 58,445 209,644 2,687,774 (557,897) 2,129,876Operating expenses 1,659,709 288,443 424,813 54,887 203,107 2,630,961 (557,234) 2,073,727Operating income (loss) ¥ 41,658 ¥ 5,332 ¥ (273) ¥ 3,558 ¥ 6,536 ¥ 56,812 ¥ (663) ¥ 56,149Identifiable assets ¥1,854,034 ¥125,912 ¥ 83,126 ¥ 179,362 ¥163,660 ¥2,406,097 ¥ (243,442) ¥2,162,654Depreciation andamortization ¥ 106,404 ¥ 3,058 ¥ 1,381 ¥ 9,526 ¥ 4,638 ¥ 125,009 ¥ (296) ¥ 124,713Capital expenditures ¥ 107,876 ¥ 4,545 ¥ 1,518 ¥ 1,593 ¥ 3,504 ¥ 119,039 ¥ (1,501) ¥ 117,538As described in Note 7, the <strong>JAL</strong> Pension Fund, resolved to introduce an option similar to a cash-balance plan and certain other options inaddition to the existing options on September 10, 2004. As a result, operating income for the year ended March 31, 2005 increased by¥51,292 million in the “air transportation.”In the semiannual consolidated financial statements for the six months ended September 30, 2004, the Company reported that operatingincome in the “air transportation” for the six months then ended increased by ¥62,401 million based on the resolution above. However, therevised internal regulations filed with and approved by the authorities were partially changed from those on which the resolution was basedand this change has been reflected in the consolidated financial statements for the year ended March 31, 2005.Millions of yenYear ended March 31, 2004Operating revenues ¥1,370,548 ¥ 75,775 ¥337,356 ¥ 12,743 ¥135,318 ¥1,931,742 ¥ — ¥1,931,742Inter-group sales and transfers 178,274 167,991 44,591 28,484 81,575 500,917 (500,917) —Total 1,548,823 243,766 381,948 41,228 216,893 2,432,659 (500,917) 1,931,742Operating expenses 1,621,002 241,875 385,894 38,661 213,073 2,500,507 (501,119) 1,999,387Operating (loss) income ¥ (72,179) ¥ 1,891 ¥ (3,946) ¥ 2,566 ¥ 3,820 ¥ (67,847) ¥ 201 ¥ (67,645)Identifiable assets ¥1,791,150 ¥113,582 ¥ 79,979 ¥ 163,075 ¥193,736 ¥2,341,525 ¥ (228,106) ¥2,113,418Depreciation andamortization ¥ 103,303 ¥ 3,029 ¥ 1,335 ¥ 6,874 ¥ 5,132 ¥ 119,675 ¥ (286) ¥ 119,388Capital expenditures ¥ 144,312 ¥ 2,574 ¥ 1,800 ¥ 2,857 ¥ 3,715 ¥ 155,259 ¥ (997) ¥ 154,262b. Geographic segment informationThe worldwide operations of the Company and its consolidated subsidiaries are geographically segmented into Japan and other areas. Areasother than Japan include Asia and Oceania, North and South America and Europe. Geographical segmentation is based on the geographicalproximity of the countries and areas. In addition, revenue from international operations of the airlines is treated as revenue in Japan.41
Millions of yenGeneral corporateassets andintercompanyYear ended March 31, <strong>2006</strong> Japan Other Total eliminations ConsolidatedOperating revenues ¥2,009,231 ¥190,154 ¥2,199,385 ¥ — ¥2,199,385Inter-group sales and transfers 27,298 73,266 100,564 (100,564) —Total 2,036,529 263,420 2,299,949 (100,564) 2,199,385Operating expenses 2,064,547 262,020 2,326,568 (100,348) 2,226,220Operating (loss) income ¥ (28,018) ¥ 1,400 ¥ (26,618) ¥ (215) ¥ (26,834)Identifiable assets ¥2,110,754 ¥ 62,241 ¥2,172,995 ¥ (11,754) ¥2,161,240Thousands of U.S. dollarsYear ended March 31, <strong>2006</strong>Operating revenues $17,172,914 $1,625,247 $18,798,162 $ — $18,798,162Inter-group sales and transfers 233,316 626,205 859,521 (859,521) —Total 17,406,230 2,251,452 19,657,683 (859,521) 18,798,162Operating expenses 17,645,700 2,239,487 19,885,196 (857,675) 19,027,521Operating (loss) income $ (239,470) $ 11,965 $ (227,504) $ (1,837) $ (229,350)Identifiable assets $18,040,632 $ 531,974 $18,572,606 $(100,461) $18,472,136As described in Note 2, Effective April 1, 2005, the Company and its domestic consolidated subsidiaries adopted a new accounting standardfor impairment of fixed assets (“Opinion Concerning the Establishment of Accounting Standard for Impairment of Fixed Assets” issued by theBusiness Accounting Council on August 9, 2002) and the “Implementation Guidance on the Accounting Standard for Impairment of FixedAssets” (Accounting Standard Implementation Guidance No. 6 issued on October 31, 2003). As a result, operating loss for the year endedMarch 31, <strong>2006</strong> decreased by ¥158 million ($1,350 thousand) in the “Japan.”Total assets in the “Japan” at March 31, 2005 and 2004 and operating revenue from operations in the “Japan” for the years then endedrepresented more than 90% of consolidated total assets and consolidated operating revenues. As a result, geographic segment information isnot required to be disclosed in accordance with accounting principles generally accepted in Japan.c. Operating revenues from overseas operationsOperating revenues from overseas operations, which include internationalpassenger and cargo services of three for <strong>2006</strong> and 2005(four for 2004) domestic airline subsidiaries, export sales of domesticsubsidiaries, and sales of subsidiaries outside Japan for theyears ended March 31, <strong>2006</strong>, 2005 and 2004 were as follows:Millions of yenNorth andYear ended Asia and SouthMarch 31, <strong>2006</strong> Oceania America Europe TotalOperating revenues fromoverseas operations ¥442,156 ¥388,791 ¥206,853 ¥1,037,801Consolidated operatingrevenues ¥2,199,385Operating revenuesfrom overseas operationsas a percentage ofconsolidated operatingrevenues 20.1% 17.7% 9.4% 47.2%Thousands of U.S. dollarsYear endedMarch 31, <strong>2006</strong>Operating revenues fromoverseas operations $3,779,111 $3,323,000 $1,767,974 $ 8,870,094Consolidated operatingrevenues $18,798,162Operating revenues fromoverseas operationsas a percentage ofconsolidated operatingrevenues 20.1% 17.7% 9.4% 47.2%Millions of yenYear endedMarch 31, 2005Operating revenues fromoverseas operations ¥ 449,282 ¥351,864 ¥211,176 ¥1,012,322Consolidated operatingrevenues ¥2,129,876Operating revenuesfrom overseas operationsas a percentage ofconsolidated operatingrevenues 21.1% 16.5% 9.9% 47.5%Millions of yenYear endedMarch 31, 2004Operating revenues fromoverseas operations ¥348,492 ¥302,232 ¥187,973 ¥ 838,698Consolidated operatingrevenues ¥1,931,742Operating revenuesfrom overseas operationsas a percentage ofconsolidated operatingrevenues 18.0% 15.7% 9.7% 43.4%14. Derivatives and Hedging ActivitiesCertain consolidated subsidiaries utilize forward foreign exchangecontracts, currency options, and currency swaps, on a consistentbasis to hedge certain foreign currency transactions related to foreignpurchase commitments, principally for flight equipment andforeign accounts receivable and payable. The Company and its consolidatedsubsidiaries also utilize currency swaps, and interest-rate42
swaps to minimize the impact of foreign exchange and interest-ratemovements related to their outstanding debt on their operatingresults. Certain consolidated subsidiaries also enter into a variety ofswaps and options in their management of risk exposure related tothe commodity prices of fuel.The Company and certain significant consolidated subsidiariesenter into these hedging transactions in accordance with the internalguidelines and strategies established by management. The routineoperations of the department which is responsible for hedgingtransactions are examined by other departments. Gain and loss onhedging instruments and the assessment of hedge effectiveness,which is performed both at inception and on an ongoing basis, arereported at meetings of the related department managers on atimely basis. Certain other consolidated subsidiaries have adoptedprocedures for hedging transactions which are more simplified thanthose adopted by the Company.The contract amounts and the estimated fair value of the openderivatives positions to which hedge accounting are applied are notrequired to be disclosed in accordance with accounting principlesgenerally accepted in Japan.The contract amounts and the estimated fair value of the openderivatives positions at March 31, <strong>2006</strong> which do not meet the criteriarequired for the application of hedge accounting are summarizedas follows:Millions of yenContractNetamount Fair unrealizedMarch 31, <strong>2006</strong> (Premium) value (loss) gainCommodities:Options:Buy ¥ 13,284 ¥ 561 ¥ 561(—)Sell 14,973 (1,685) (628)(1,057)¥ (67)March 31, <strong>2006</strong>Thousands of U.S. dollarsCommodities:Options:Buy $113,538 $ 4,794 $4,794(—)Sell 127,974 (14,401) (5,367)(9,034)$ (572)All derivative transactions were conducted as over-the-countertransactions.Fair value is estimated based on prices quoted by financialinstitutions and others.All open derivatives positions at March 31, 2005 met the criteriarequired for the application of hedge accounting.15. Loss on Impairment of Fixed AssetsCertain consolidated subsidiaries have recognized impairmentlosses on the following groups of assets in the consolidated statementof operations for the year ended March 31, <strong>2006</strong>:Assets utilized in theCompany’s andconsolidated subsidiaries’operations Groups of assets LocationsGolf courses Land, buildings and Tomakomai-shi,structures and other Hokkaido and otherOther operational assets Land and other Osaka-shi and otherAssets to be sold Land, buildings and Chitose-shi,flight equipment Hokkaido and otherIdle assets Land and other Ito-shi, Shizuoka Pref.,and otherAssets are attributed or allocated to the cash generating units whichgenerate largely independent cash flows for calculating impairmentlosses. Facilities which are expected to be unprofitable, assets to besold and idle assets are written down to their recoverable amounts.Consequently, an impairment loss of ¥18,705 million ($159,871thousand) has been recognized as a non-operating expense in theaccompanying consolidated statement of operations for the yearended March 31, <strong>2006</strong>. A breakdown of the total loss on impairmentof fixed assets is as follows: ¥10,361 million ($88,555 thousand)on buildings and structures, ¥6,274 million ($53,623thousand) on land, ¥1,853 million ($15,837 thousand) on flightequipment and ¥216 million ($1,846 thousand) on other assets.The Company and its consolidated subsidiaries estimate recoverableamounts as the higher of fair value less costs to sell andvalue in use. Fair value is based on reasonable estimates made bythe Company and its consolidated subsidiaries in accordance withdata sources from the Official Road Ratings or other appropriateindexes and the contract amount of sales and value in use is calculatedby discounting estimated future cash flows at the rate of5.2%.In addition, certain affiliates which are accounted for by theequity method have recognized loss on impairment of fixed assetsby a method similar to that adopted by the Company and its consolidatedsubsidiaries. Consequently, loss on impairment of fixedassets of ¥18 million ($153 thousand) was recognized as equity inearnings of affiliates for the year ended March 31, <strong>2006</strong>.16. Subsequent EventOn April 1, <strong>2006</strong>, <strong>JAL</strong> Sales Co., Ltd., a wholly owned subsidiary ofthe Company, was merged into <strong>JAL</strong>I.43
REPORT OF INDEPENDENT AUDITORSJapan Airlines Corporation and Consolidated SubsidiariesThe Board of DirectorsJapan Airlines CorporationWe have audited the accompanying consolidated balance sheets of Japan Airlines Corporation and consolidated subsidiariesas of March 31, <strong>2006</strong> and 2005, and the related consolidated statements of operations, stockholders’ equity,and cash flows for each of the three years in the period ended March 31, <strong>2006</strong>, all expressed in yen. These financialstatements are the responsibility of the Company’s management. Our responsibility is to express an opinion on thesefinancial statements based on our audits.We conducted our audits in accordance with auditing standards generally accepted in Japan. Those standards requirethat we plan and perform the audit to obtain reasonable assurance about whether the financial statements are free ofmaterial misstatement. An audit includes examining, on a test basis, evidence supporting the amounts and disclosuresin the financial statements. An audit also includes assessing the accounting principles used and significant estimatesmade by management, as well as evaluating the overall financial statement presentation. We believe that our auditsprovide a reasonable basis for our opinion.In our opinion, the consolidated financial statements referred to above present fairly, in all material respects, the consolidatedfinancial position of Japan Airlines Corporation and consolidated subsidiaries at March 31, <strong>2006</strong> and 2005,and the consolidated results of their operations and their cash flows for each of the three years in the period endedMarch 31, <strong>2006</strong> in conformity with accounting principles generally accepted in Japan.Supplemental InformationAs described in Note 2, the Company, effective April 1, 2005, adopted a new accounting standard relating to theimpairment of fixed assets.The U.S. dollar amounts in the accompanying consolidated financial statements with respect to the year ended March31, <strong>2006</strong> are presented solely for convenience. Our audit also included the translation of yen amounts into U.S. dollaramounts and, in our opinion, such translation has been made on the basis described in Note 3.June 28, <strong>2006</strong>44
CONSOLIDATED SUBSIDIARIESJapan Airlines Corporation and Consolidated Subsidiaries<strong>JAL</strong>’sEquityCompany Name Date of Establishment Paid-in Capital Ownership (%) Principal Business<strong>JAPAN</strong> <strong>AIRLINES</strong> INTERNATIONAL CO., LTD. October 1, 1953 ¥ 188,550 million 100.0 Air Transport<strong>JAPAN</strong> <strong>AIRLINES</strong> DOMESTIC CO., LTD. April 15, 1964 ¥ 21,486 million 100.0 Air TransportHOKKAIDO AIR SYSTEM CO., LTD. September 30, 1997 ¥ 490 million 51.0* Air TransportJ AIR CO., LTD. August 8, 1996 ¥ 200 million 100.0* Air Transport<strong>JAL</strong> EXPRESS CO., LTD. April 1, 1997 ¥ 2,500 million 100.0* Air Transport<strong>JAL</strong>WAYS CO., LTD. October 5, 1990 ¥ 3,000 million 100.0* Air Transport<strong>JAPAN</strong> AIR COMMUTER CO., LTD. July 1, 1983 ¥ 300 million 60.0* Air Transport<strong>JAPAN</strong> ASIA AIRWAYS CO., LTD. August 8, 1975 ¥ 4,310 million 100.0 Air Transport<strong>JAPAN</strong> TRANS OCEAN AIR CO., LTD. June 20, 1967 ¥ 4,537 million 53.1* Air TransportRYUKYU AIR COMMUTER CO., LTD. December 24, 1985 ¥ 396 million 70.3* Air Transport<strong>JAL</strong> CARGO SALES CO., LTD. January 22, 2001 ¥ 50 million 100.0* Air Cargo<strong>JAL</strong> KANSAI AIRCARGO SYSTEM CO., LTD. December 10, 1975 ¥ 123 million 69.2* Air Cargo<strong>JAL</strong> LOGISTICS INC. March 28, 1970 ¥ 144 million 100.0* Air Cargo<strong>JAL</strong>TOS CO., LTD. October 14, 1982 ¥ 50 million 100.0* Air CargoJUPITER GLOBAL LIMITED May 17, 1983 HK$ 1 million 80.0* Air CargoNARITA LOGISTIC TERMINAL CO., LTD. April 1, 2003 ¥ 100 million 100.0* Air CargoNISHINIHON AIR CARGO SERVICE COMPANY LIMITED June 1, 1987 ¥ 20 million 80.0* Air CargoCHITOSE AIRPORT FUELLING FACILITIES COMPANY, LTD. August 5, 1977 ¥ 200 million 60.0* Aircraft FuelsOKINAWA FUELING FACILITIES CO., LTD. November 1, 1974 ¥ 100 million 60.0* Aircraft FuelsPACIFIC FUEL TRADING CORPORATION November 1, 1982 US$ 1 million 100.0* Aircraft Fuels<strong>JAL</strong> AIRTECH CO., LTD. September 11, 1958 ¥ 315 million 70.0* Aircraft Maintenance<strong>JAL</strong> AVIATION TECHNOLOGIES CO., LTD. July 1, 1988 ¥ 47 million 100.0* Aircraft Maintenance<strong>JAL</strong> ENGINE TECHNOLOGIES CO., LTD. October 1, 1988 ¥ 80 million 100.0* Aircraft Maintenance<strong>JAL</strong> MAINTENANCE SERVICE CO., LTD. February 10, 1982 ¥ 10 million 100.0* Aircraft Maintenance<strong>JAL</strong> MAINTENANCE SUPPORT CO., LTD. June 29, 1993 ¥ 10 million 100.0* Aircraft Maintenance<strong>JAL</strong> NARITA AIRCRAFT MAINTENANCE CO., LTD. April 1, 1988 ¥ 28 million 100.0* Aircraft Maintenance<strong>JAL</strong> SIMULATOR ENGINEERING CO., LTD. December 1, 2003 ¥ 10 million 100.0* Aircraft Maintenance<strong>JAL</strong> TECHNO SERVICE CO., LTD. August 24, 1977 ¥ 20 million 81.3* Aircraft Maintenance<strong>JAL</strong> TOKYO AIRCRAFT MAINTENANCE CO., LTD. April 1, 1983 ¥ 12 million 100.0* Aircraft MaintenanceNIHON SERVICE CO., LTD. November 11, 1969 ¥ 12 million 68.3* Aircraft MaintenanceAGP CORPORATION December 16, 1965 ¥ 2,038 million 63.0 Airport-Related ServicesAGS AIR CARGO SERVICE COMPANY, LIMITED September 2, 1999 ¥ 50 million 100.0* Airport-Related ServicesAGS SKYSUPPORT COMPANY, LIMITED July 6, 2001 ¥ 20 million 100.0* Airport-Related ServicesAIRPORT GROUND SERVICE CO., LTD. March 1, 1957 ¥ 474 million 100.0* Airport-Related ServicesGROUND AIR SERVICE CO., LTD. February 15, 1968 ¥ 24 million 100.0* Airport-Related ServicesHOKKAIDO AIR SERVICE CO., LTD. November 20, 1974 ¥ 40 million 90.0* Airport-Related Services<strong>JAL</strong> ABC, INC. December 15, 1977 ¥ 100 million 51.0* Airport-Related Services<strong>JAL</strong> HAWAII, INCORPORATED July 1, 1998 US$ 100,000 100.0* Airport-Related Services<strong>JAL</strong> NAVIA FUKUOKA CO., LTD. April 16, 1990 ¥ 10 million 100.0* Airport-Related Services<strong>JAL</strong> NAVIA OSAKA CO., LTD. November 16, 1988 ¥ 10 million 100.0* Airport-Related Services<strong>JAL</strong> NAVIA SAPPORO CO., LTD. October 1, 2003 ¥ 10 million 100.0* Airport-Related Services<strong>JAL</strong> NAVIA TOKYO CO., LTD. May 8, 1997 ¥ 10 million 100.0* Airport-Related Services<strong>JAL</strong> PASSENGER SERVICES AMERICA INCORPORATED January 26, 1996 US$ 205,000 100.0* Airport-Related Services<strong>JAL</strong> PLAZA CO., LTD. December 1, 1988 ¥ 50 million 100.0* Airport-Related Services<strong>JAL</strong> SKY SERVICE CO., LTD. September 13, 1982 ¥ 100 million 100.0* Airport-Related Services<strong>JAL</strong> WAVE CO., LTD. December 1, 1998 ¥ 30 million 100.0* Airport-Related Services<strong>JAL</strong>SKY FUKUSHIMA COMPANY, LTD. September 21, 1992 ¥ 15 million 100.0* Airport-Related Services<strong>JAL</strong>SKY HAKODATE COMPANY, LTD. May 9, 1989 ¥ 15 million 100.0* Airport-Related Services<strong>JAL</strong>SKY KANAZAWA COMPANY, LTD. July 1, 1991 ¥ 10 million 100.0* Airport-Related Services<strong>JAL</strong>SKY KANSAI COMPANY, LTD. June 1, 1992 ¥ 50 million 100.0* Airport-Related Services<strong>JAL</strong>SKY KYUSHU COMPANY, LTD. April 3, 1986 ¥ 30 million 100.0* Airport-Related Services<strong>JAL</strong>SKY NAGASAKI COMPANY, LTD. December 23, 1987 ¥ 15 million 100.0* Airport-Related Services<strong>JAL</strong>SKY NAGOYA COMPANY, LTD. March 5, 1984 ¥ 30 million 51.0* Airport-Related Services<strong>JAL</strong>SKY OSAKA COMPANY, LTD. January 26, 1988 ¥ 30 million 100.0* Airport-Related Services<strong>JAL</strong>SKY SAPPORO COMPANY, LTD. December 24, 1987 ¥ 30 million 100.0* Airport-Related Services<strong>JAL</strong>SKY SENDAI COMPANY, LTD. November 11, 1998 ¥ 10 million 100.0* Airport-Related Services<strong>JAL</strong>SKY TOKYO COMPANY, LTD. February 2, 1998 ¥ 50 million 100.0* Airport-Related ServicesJTA SOUTHERN SKY SERVICE CO., LTD. June 5, 2000 ¥ 20 million 100.0* Airport-Related ServicesKANSAI AIRPORT GROUND SERVICE CO., LTD. April 14, 1989 ¥ 96 million 100.0* Airport-Related ServicesNEW TOKYO SERVICE CO., LTD. August 24, 1974 ¥ 10 million 100.0* Airport-Related Services45
OKINAWA AIRPORT SERVICE CO., LTD. October 1, 1965 ¥ 33 million 100.0* Airport-Related ServicesSERVICE CREATION INC. December 25, 1989 ¥ 30 million 100.0* Airport-Related ServicesTOA AIR SERVICE CO., LTD. February 10, 1976 ¥ 25 million 100.0* Airport-Related ServicesINFLIGHT FOODS CO., LTD. June 25, 1986 ¥ 100 million 100.0* CateringINTERNATIONAL CATERING LTD. October 14, 1982 GBP 8,993,000 100.0* CateringINTERNATIONAL IN-FLIGHT CATERING CO., LTD. July 20, 1971 US$ 2 million 56.7* Catering<strong>JAL</strong> ROYAL CATERING CO., LTD. January 28, 1992 ¥ 2,000 million 51.0* CateringNARITA DRY ICE CO., LTD. August 25, 1981 ¥ 50 million 100.0* CateringTFK CORPORATION December 9, 1959 ¥ 497 million 50.7* CateringHARLEQUIN AIR CO., LTD. January 20, 1997 ¥ 20 million 100.0* Cultural Activities and publishing<strong>JAL</strong> ACADEMY CO., LTD. June 10, 1985 ¥ 50 million 100.0* Cultural Activities and Publishing<strong>JAL</strong> BRAND COMMUNICATIONS CO., LTD. March 8, 2004 ¥ 100 million 100.0 Cultural Activities and Publishing<strong>JAL</strong> BUSINESS CO., LTD. November 8, 1979 ¥ 100 million 100.0* Cultural Activities and Publishing<strong>JAL</strong> GROUP SENIOR CENTER CO., LTD. November 1, 2005 ¥ 100 million 100.0* Cultural Activities and Publishing<strong>JAL</strong> LIVRE CO., LTD. October 1, 2002 ¥ 50 million 100.0 Cultural Activities and Publishing<strong>JAL</strong> SUNLIGHT CO., LTD. November 15, 1995 ¥ 20 million 100.0* Cultural Activities and PublishingOFFICIAL FILING CO., LTD. February 10, 1984 ¥ 10 million 89.0* Cultural Activities and Publishing<strong>JAL</strong> CAPITAL CO., LTD. July 25, 1988 ¥ 3,500 million 100.0 Financial Services<strong>JAL</strong> CAPITAL CORPORATION September 4, 1992 US$ 20 100.0* Financial Services<strong>JAL</strong>CARD INC. October 30, 1984 ¥ 400 million 100.0* Financial ServicesJLC INSURANCE COMPANY LIMITED November 22, 2002 US$ 2 million 100.0* Financial ServicesASIA CREATIVE TOURS CO., LTD. October 14, 1975 ¥ 50 million 100.0* Hotel and Travel ServicesBENKAY (U.S.A.), INC. February 6, 1986 US$ 1,000 100.0* Hotel and Travel ServicesCHITOSE INTERNATIONAL HOTEL CO., LTD. April 13, 1978 ¥ 2,317 million 85.4* Hotel and Travel ServicesCREATIVE GREETING SERVICE, INC. October 1, 1991 US$ 10,000 100.0* Hotel and Travel ServicesCREATIVE TOURS (SINGAPORE) PTE. LTD. May 1, 1979 S$ 100,000 100.0* Hotel and Travel ServicesCREATIVE TOURS LTD. September 14, 1973 GBP 96,627 100.0* Hotel and Travel ServicesEURO CREATIVE TOURS (UK) LTD. October 17, 1980 GBP 80,000 100.0* Hotel and Travel ServicesHAWAII HOTEL RESERVATION SYSTEM, INC. October 1, 1997 US$ 10,000 100.0* Hotel and Travel ServicesHOTEL NIKKO (U.S.A.), INC. July 18, 1984 US$ 1,000 100.0* Hotel and Travel ServicesHOTEL NIKKO ANNUPURI November 5, 1984 ¥ 980 million 70.5* Hotel and Travel ServicesHOTEL NIKKO OF SAN FRANCISCO, INC. July 19, 1984 US$ 1,000 100.0* Hotel and Travel ServicesHOTEL NIKKO OSAKA CO., LTD. December 10, 1980 ¥ 100 million 100.0* Hotel and Travel ServicesHOTEL NIKKO SAIPAN, INC. September 26, 1984 US$ 21 million 87.0* Hotel and Travel ServicesJ INTER CO., LTD. February 7, 1997 ¥ 10 million 100.0* Hotel and Travel ServicesJ PRO CO., LTD. December 4, 1998 ¥ 30 million 100.0* Hotel and Travel Services<strong>JAL</strong> HOTELS COMPANY LTD. July 1, 1970 ¥ 4,272 million 90.7* Hotel and Travel Services<strong>JAL</strong> SALES CO., LTD. November 22, 1999 ¥ 1,000 million 100.0 Hotel and Travel Services<strong>JAL</strong> SALES OKINAWA CO., LTD. July 5, 2000 ¥ 50 million 100.0* Hotel and Travel Services<strong>JAL</strong> SATELLITE TRAVEL CO., LTD. August 17, 1979 HK$ 750,000 100.0* Hotel and Travel Services<strong>JAL</strong> TOURS CO., LTD. April 1, 1978 ¥ 80 million 80.7* Hotel and Travel Services<strong>JAL</strong> TRAVEL CO., LTD. December 15, 1993 ¥ 460 million 100.0* Hotel and Travel Services<strong>JAL</strong> TRAVEL HOKKAIDO CO., LTD. December 15, 1993 ¥ 250 million 100.0* Hotel and Travel Services<strong>JAL</strong> TRAVEL KYUSHU CO., LTD. May 23, 1984 ¥ 200 million 100.0* Hotel and Travel Services<strong>JAL</strong> TRAVEL WESTERN <strong>JAPAN</strong> CO., LTD. November 18, 1994 ¥ 240 million 100.0* Hotel and Travel Services<strong>JAL</strong>PAK CO., LTD. April 4, 1969 ¥ 900 million 78.6* Hotel and Travel Services<strong>JAL</strong>PAK DE MEXICO S.A. DE C.V. April 1, 1987 MXN 2,273,639 100.0* Hotel and Travel Services<strong>JAL</strong>PAK HOLDING U.S.A., INC. April 1, 1999 US$ 100 100.0* Hotel and Travel Services<strong>JAL</strong>PAK INTERNATIONAL (AUSTRIA) GES. M.B.H March 19, 1985 EUR 72,672 75.0* Hotel and Travel Services<strong>JAL</strong>PAK INTERNATIONAL (CHINA) CO., LTD. November 13, 2003 US$ 600,000 100.0* Hotel and Travel Services<strong>JAL</strong>PAK INTERNATIONAL (EUROPE) B.V. November 1, 1979 EUR 900,000 100.0* Hotel and Travel Services<strong>JAL</strong>PAK INTERNATIONAL (FRANCE) S.A.S. April 1, 1974 EUR 160,000 100.0* Hotel and Travel Services<strong>JAL</strong>PAK INTERNATIONAL (GERMANY) GMBH October 26, 1979 EUR 102,258 90.0* Hotel and Travel Services<strong>JAL</strong>PAK INTERNATIONAL (SPAIN) S.A. September 21, 1982 EUR 180,303 100.0* Hotel and Travel Services<strong>JAL</strong>PAK INTERNATIONAL (THAILAND) CO., LTD. November 9, 2000 THB 6 million 100.0* Hotel and Travel Services<strong>JAL</strong>PAK INTERNATIONAL AMERICA, INC. July 29, 1970 US$ 2 million 100.0* Hotel and Travel Services<strong>JAL</strong>PAK INTERNATIONAL ASIA PTE LTD. February 4, 1997 S$ 100,000 100.0* Hotel and Travel Services<strong>JAL</strong>PAK INTERNATIONAL HAWAII, INC. April 1, 1990 US$ 1 million 100.0* Hotel and Travel Services<strong>JAL</strong>PAK INTERNATIONAL HONG KONG CO., LTD. May 31, 1974 HK$ 550,000 100.0* Hotel and Travel Services<strong>JAL</strong>PAK INTERNATIONAL MICRONESIA, INC. April 1, 1986 US$ 1 million 100.0* Hotel and Travel Services<strong>JAL</strong>PAK INTERNATIONAL OCEANIA PTY LIMITED March 27, 1984 A$ 500,000 100.0* Hotel and Travel Services<strong>JAL</strong>PAK MALAYSIA SDN. BHD. September 19, 1970 MYR 466,000 100.0* Hotel and Travel Services46
<strong>JAL</strong>PAK SERVICE INC. July 1, 1987 ¥ 125 million 100.0* Hotel and Travel Services<strong>JAL</strong>PAK TOUR & TRAVEL (THAILAND) CO., LTD. October 1, 1979 THB 6 million 73.3* Hotel and Travel ServicesJDC GUAM INC. April 26, 1994 US$ 1,000 100.0* Hotel and Travel ServicesMICRONESIAN HOSPITALITY, INC. January 15, 1975 US$ 160,235 62.6* Hotel and Travel ServicesNANSEI TOURIST DEVELOPMENT CO., LTD. May 1, 1981 ¥ 3,000 million 76.7* Hotel and Travel ServicesNARITA NIKKO HOTEL CO., LTD. November 24, 1977 ¥ 50 million 100.0* Hotel and Travel ServicesNEW NIKKO HOTEL CO., LTD. January 12, 1999 ¥ 25 million 100.0* Hotel and Travel ServicesNIKKO HOTELS (U.K.) LTD. May 24, 1985 GBP 21 million 100.0* Hotel and Travel ServicesOKUMA BEACH LAND CO., LTD. June 12, 1978 ¥ 1,080 million 94.4* Hotel and Travel ServicesP.T. <strong>JAL</strong>PAK INTERNATIONAL BALI October 1, 2000 US$ 300,000 100.0* Hotel and Travel ServicesP.T. TAURINA TRAVEL JAYA April 1, 1982 IDR 500 million 51.0* Hotel and Travel ServicesPACIFIC INVESTMENT HOLDINGS CORPORATION April 5, 1990 US$ 59 million 100.0* Hotel and Travel Services<strong>JAL</strong> SHURI KANKO CO., LTD. December 10, 1969 ¥ 1,116 million 57.9* Hotel and Travel ServicesTOUR CREATE, INC. April 1, 1994 US$ 10,000 100.0* Hotel and Travel ServicesTRANS QUALITY, INC. June 1, 1990 US$ 200,000 100.0* Hotel and Travel ServicesUNIVERSAL HOLIDAYS, INC. February 21, 1978 PHP 6 million 88.9* Hotel and Travel ServicesAXESS INTERNATIONAL NETWORK, INC. July 1, 1991 ¥ 700 million 75.0* Information ServicesJTA INFORMATION & COMMUNICATION CO., LTD. April 16, 1984 ¥ 50 million 61.0* Information ServicesASAHIKAWA RESORT DEVELOPMENT CO., LTD. February 26, 1990 ¥ 300 million 90.0* Leisure and Tourism ServicesTOMAKOMAI RYOKKA KAIHATSU CO., LTD. April 10, 1989 ¥ 50 million 51.0* Leisure and Tourism ServicesGLOBAL BUILDING CO., LTD. April 14, 1989 ¥ 100 million 100.0* Real Estate and Construction<strong>JAL</strong> CONSTRUCTION CO., LTD. June 1, 1976 ¥ 180 million 91.0* Real Estate and Construction<strong>JAPAN</strong> <strong>AIRLINES</strong> MANAGEMENT CORP. October 20, 1989 US$ 93 100.0* Real Estate and ConstructionPACIFIC BUSINESS BASE, INC. October 20, 1989 US$ 400 100.0* Real Estate and Construction<strong>JAL</strong> AEROPARTS CO., LTD. December 4, 1990 ¥ 490 million 100.0* Trading<strong>JAL</strong>-DFS CO., LTD. July 1, 1992 ¥ 300 million 60.0* Trading<strong>JAL</strong>UX AMERICAS, INC. April 26, 1982 US$5 million 100.0* Trading<strong>JAL</strong>UX EUROPE LIMITED April 13, 1972 GBP 1 million 100.0* Trading<strong>JAL</strong>UX INC. March 28, 1962 ¥ 2,558 million 51.7* TradingJTA TRADING CO., LTD. July 1, 1985 ¥ 20 million 100.0* Trading* Includes holdings of the parent company and those of subsidiaries and affiliates.47
<strong>JAL</strong> AND ITS SUBSIDIARIES AND AFFILIATESAir Transport<strong>JAPAN</strong> <strong>AIRLINES</strong> INTERNATIONAL CO., LTD.<strong>JAPAN</strong> <strong>AIRLINES</strong> DOMESTIC CO., LTD.HOKKAIDO AIR SYSTEM CO., LTD.J-AIR CO., LTD.<strong>JAL</strong> EXPRESS CO., LTD.<strong>JAL</strong>WAYS CO., LTD.<strong>JAPAN</strong> AIR COMMUTER CO., LTD.<strong>JAPAN</strong> ASIA AIRWAYS CO., LTD.<strong>JAPAN</strong> TRANS OCEAN AIR CO., LTD.RYUKYU AIR COMMUTER CO., LTD.Air CargoCARGO COMMUNITY SYSTEM <strong>JAPAN</strong> CO., LTD.CARINA INTERNATIONAL LIMITEDCONTACT CUSTOMS CLEARANCE, INC.DATA & JUPITER FREIGHT (BEIJING) CO., LTD.DPEX TRANSPORT GROUP PTE. LTD.EXPRESS HANDLING SERVICES LIMITEDFACT INC.FAIRWAY EXPRESS CO., LTD.FLEETPAK ENTERPRISES PTE. LTD.FUKUOKA AIR CARGO TERMINAL CO., LTD.GLOBAL LOGISTICS SYSTEM ASIA PACIFIC CO., LTD.GLOBAL LOGISTICS SYSTEM WORLDWIDE GMBHGLOBAL REGENT LIMITEDGUANGZHOU JUPITER WORLD-LINKINTERNATIONAL FORWARDING CO., LTD.INTEGRATED EXPRESS LIMITEDJ & B EXPRESS LIMITED<strong>JAL</strong> CARGO SALES CO., LTD.<strong>JAL</strong> KANSAI AIRCARGO SYSTEM CO., LTD.<strong>JAL</strong> LOGISTICS INC.<strong>JAL</strong>TOS CO., LTD.<strong>JAL</strong>TRANS, INC.<strong>JAPAN</strong> AIR MAIL CO., LTD.JPM LOGISTICSJTB EXPRESS PVT. LTD.J-TRANSJUPICOM COMPANY LIMITEDJUPITER (FIJI) LTD.JUPITER AIR (CANADA) LTD.JUPITER AIR (CHINA) LIMITEDJUPITER AIR (HONG KONG) LIMITEDJUPITER AIR (UK) LIMITEDJUPITER AIR OCEANIA LIMITEDJUPITER AIR SERVICES (MALAYSIA) SDN. BHD.JUPITER GLOBAL LIMITEDJUPITER <strong>JAPAN</strong> CO., LTD.JUPITER LOGISTICS CAMBODIA CO., LTD.JUPITER LOGISTICS CHILE S.A.JUPITER LOGISTICS PHILIPPINES, INC.JUPITER PACIFIC FORWARDING JOINT VENTURECO., LTD.JUPITER SINGAPORE PTE. LTD.KILDA EXPRESS PTE. LTD.MERCURY INTERNATIONAL CO., LTD.MICOM AMERICA, INC.NARITA LOGISTIC TERMINAL CO., LTD.NISHINIHON AIR CARGO SERVICE COMPANYLIMITEDORION INTERNATIONAL JOINT VENTURECO., LTD.OSAKA AIR MAIL CO., LTD.PAN JUPITER TRANSPORT CO., LTD.SHANGHAI JUPITER INTERNATIONALFORWARDING CO., LTD.SIRIUS AIR INTERNATIONAL LIMITEDSKY SUPPORT HANEDA COMPANY, LIMITEDSKYHERO COMPANY LIMITEDSTRATHE CARGO OPERATIONSSUREPLUS LIMITEDTAS CARGO (THAILAND) CO., LTD.TRENDY AIR SERVICES SDN. BHD.U-FREIGHT <strong>JAPAN</strong> CO., LTD.WHOLESALE COURIER (S) PTE. LTD.Aircraft FuelsCENTRAIR FUELING FACILITIES CO., LTD.CHITOSE AIRPORT FUELLING FACILITIESCOMPANY, LTD.FUKUSHIMA AIRPORT FUELLING FACILITIESCO., LTD.HIROSHIMA AIRPORT FUELLING FACILITIESCOMPANY, LTD.<strong>JAPAN</strong> AIRPORT FUELING SERVICE CO., LTD.KAGOSHIMA AIRPORT FUELLING FACILITIESCO., LTD.KOBE AIRPORT FUEL FACILITIES INC.KOKUSAI AVIATION FUELING CO., LTD.OKINAWA FUELING FACILITIES CO., LTD.OOITA AIRPORT FUELLING FACILITIES CO., LTD.OSAKA HYDRANT CO., LTD.PACIFIC AIRCRAFT & AIRPORT SERVICE CO., LTD.PACIFIC FUEL TRADING CORPORATIONAircraft MaintenanceAIR COMPONENT MAINTENANCE COMPANYCENTRAIR GSE SERVICE CO., LTD.<strong>JAL</strong> AIRTECH CO., LTD.<strong>JAL</strong> AIRTECH FUKUOKA CO., LTD.<strong>JAL</strong> AIRTECH NARITA CO., LTD.<strong>JAL</strong> AVIATION TECHNOLOGIES CO., LTD.<strong>JAL</strong> ENGINE TECHNOLOGIES CO., LTD.<strong>JAL</strong> MAINTENANCE SERVICE CO., LTD.<strong>JAL</strong> MAINTENANCE SUPPORT CO., LTD.<strong>JAL</strong> NARITA AIRCRAFT MAINTENANCE CO., LTD.<strong>JAL</strong> SIMULATOR ENGINEERING CO., LTD.<strong>JAL</strong> TECHNO SERVICE CO., LTD.<strong>JAL</strong> TOKYO AIRCRAFT MAINTENANCE CO., LTD.JAMCO CORPORATION<strong>JAPAN</strong> TURBINE TECHNOLOGIES CO., LTD.KANTO KIGYO CO., LTD.NIHON SERVICE CO., LTD.NITTO AIRCRAFT MAINTENANCE CO., LTD.OAS MAINTENANCE CO., LTD.Airport-Related ServicesAGP CHUBU CO., LTD.AGP CORPORATIONAGP DEVELOPMENT CO., LTD.AGP HOKKAIDO CO., LTD.AGP KANSAI CO., LTD.AGP KYUSHU CO., LTD.AGS AIR CARGO SERVICE COMPANY, LIMITEDAGS SKYSUPPORT COMPANY, LIMITEDAIRPORT AVIATION SERVICE CO., LTD.AIRPORT FACILITIES CO., LTD.AIRPORT GROUND SERVICE CO., LTD.AMAMI AIRPORT TERMINAL BUILDING CO., LTD.ASAHIKAWA AIRPORT TERMINAL BUILDING CO.,LTD.AVIATION SECURITY TRAINING SYSTEM CO., LTD.CHITOSE AIRPORT MOTOR SERVICE CO., LTD.CHUBU SKY SUPPORT CO., LTD.FUKUOKA AIRPORT BUILDING CO., LTD.FUKUOKA TAS CORPORATIONFUKUSHIMA AIRPORT BUILDING CO., LTD.GROUND AIR SERVICE CO., LTD.HOKKAIDO AIR SERVICE CO., LTD.IWATE PREFECTURE AIRPORT TERMINALBUILDING CO., LTD.IZUMO AIRPORT TERMINAL BUILDING CO., LTD.<strong>JAL</strong> ABC SERVICE, INC.<strong>JAL</strong> ABC, INC.<strong>JAL</strong> AVIATION CONSULTING INCORPORATED<strong>JAL</strong> HAWAII, INCORPORATED<strong>JAL</strong> NAVIA FUKUOKA CO. ,LTD.<strong>JAL</strong> NAVIA OSAKA CO., LTD.<strong>JAL</strong> NAVIA SAPPORO CO., LTD.<strong>JAL</strong> NAVIA TOKYO CO., LTD.<strong>JAL</strong> PASSENGER SERVICES AMERICAINCORPORATED<strong>JAL</strong> PLAZA CO., LTD.<strong>JAL</strong> SKY SERVICE CO., LTD.<strong>JAL</strong> WAVE CO., LTD.<strong>JAL</strong>SKY FUKUSHIMA COMPANY, LTD.<strong>JAL</strong>SKY HAKODATE COMPANY, LTD.<strong>JAL</strong>SKY KANAZAWA COMPANY, LTD.<strong>JAL</strong>SKY KANSAI COMPANY, LTD.<strong>JAL</strong>SKY KYUSHU COMPANY, LTD.<strong>JAL</strong>SKY NAGASAKI COMPANY, LTD.<strong>JAL</strong>SKY NAGOYA COMPANY, LTD.<strong>JAL</strong>SKY OSAKA COMPANY, LTD.<strong>JAL</strong>SKY SAPPORO COMPANY, LTD.<strong>JAL</strong>SKY SENDAI COMPANY, LTD.<strong>JAL</strong>SKY TOKYO COMPANY, LTD.<strong>JAPAN</strong> SECURITY SUPPORT CO., LTD.JTA SOUTHERN SKY SERVICE CO., LTD.JUPITER GROUND SERVICE LIMITEDKANSAI AIRPORT GROUND SERVICE CO., LTD.KOKUNAISEN DOTCOM CO., LTD.KUSHIRO AIRPORT TERMINAL BUILDINGCO., LTD.KYUSHU AIRPORT SERVICE CO., LTD.LAO-<strong>JAPAN</strong> AIRPORT TERMINAL SERVICES CO.,LTD.MATSUMOTO AIRPORT TERMINAL BUILDINGCO., LTD.MEMANBETSU AIRPORT BUILDING CO., LTD.MISAWA AIRPORT TERMINAL CO., LTD.NAGASAKI GRAND AIR SERVICE INC.NAHA AIRPORT GROUND SERVICE CO., LTD.NAHA AIRPORT PASSENGER SERVICE CO., LTD.NANKI-SHIRAHAMA AIRPORT TERMINALBUILDING CO., LTD.NEW CHITOSE AIRPORT SERVICE CO., LTD.NEW TOKYO SERVICE CO., LTD.NISHINIHON AIRPORT SERVICE CO., LTD.NISHINIHON PASSENGER SERVICE CO., LTD.OBIHIRO AIRPORT TERMINAL BUILDING CO.,LTD.ODATE NOSHIRO AIRPORT BUILDING CO., LTD.OKINAWA AIRPORT SERVICE CO., LTD.OKINOERABU AIRPORT TERMINAL BUILDINGCO., LTD.SANEI MAINTENANCE CO., LTD.SERVICE CREATION INC.SHIMOJISHIMA AIRPORT FACILITY CO., LTD.TABINI HOLDINGS, INC.TOA AIR SERVICE CO., LTD.TOKUNOSHIMA AIRPORT BUILDING CO., LTD.TOKUSHIMA AIR TERMINAL BUILDING CO., LTD.TOKYO AIRPORT HEATING & COOLING CO., LTD.TOKYO CITY AIR TERMINAL CO., LTD.TSURUYA KOGYO CO., LTD.CateringINFLIGHT FOODS CO., LTD.INTERNATIONAL CATERING LTD.INTERNATIONAL IN-FLIGHT CATERING CO., LTD.<strong>JAL</strong> ROYAL CATERING CO., LTD.NAGOYA AIR CATERING CO., LTD.NARITA DRY ICE CO., LTD.TFK CORPORATIONTFK DEVELOPMENT CO., LTD.TFK INTERNATIONAL (N,Z) LIMITEDCultural Activities and PublishingAIR FLITE <strong>JAPAN</strong> CORPORATIONHARLEQUIN AIR CO., LTD.<strong>JAL</strong> ACADEMY CO., LTD.<strong>JAL</strong> BRAND COMMUNICATIONS CO., LTD.<strong>JAL</strong> BUSINESS CO., LTD.<strong>JAL</strong> GROUP SENIOR CENTER CO., LTD.<strong>JAL</strong> LIVRE CO., LTD.<strong>JAL</strong> SUNLIGHT CO., LTD.<strong>JAL</strong>UX LIFE DESIGN INC.OFFICIAL FILING CO., LTD.48
TOURISM ESSENTIALS INC.WINDS PUBLICATIONS CO., LTD.Financial ServicesACRES LEASING CO., LTD.AILERON LEASING CO., LTD.AIMS LEASING CO., LTD.AVIONET LEASING LTD.CAMBER LEASING CO., LTD.FAIRING LEASING CO., LTD.FANS LEASING CO., LTD.FILLET LEASING CO., LTD.FLAP LEASING CO., LTD.GEAR LEASING CO., LTD.HIGH SKY LEASING CO., LTD.<strong>JAL</strong> CAPITAL CO., LTD.<strong>JAL</strong> CAPITAL CORPORATION<strong>JAL</strong> FSC LESSEE (CHI) COMPANY, LTD.<strong>JAL</strong> FSC LESSEE (NC2) COMPANY, LTD.<strong>JAL</strong>CARD INC.JET LINER LEASING CO., LTD.JLC INSURANCE COMPANY LIMITEDJLMC AVIATION SERVICE CO., LTD.KEEL LEASING CO., LTD.NACELLE LEASING CO., LTD.PITOT LEASING CO., LTD.PNEUMATIC LEASING CO., LTD.PULSEJET LEASING CO., LTD.PYLON LEASING CO., LTD.RAM JET LEASING CO., LTD.REDOME LEASING CO., LTD.RIB LEASING CO., LTD.RUDDER LEASING CO., LTD.SELCAL LEASING CO., LTD.SLAT LEASING CO., LTD.SPINNER LEASING CO., LTD.STABILIZER LEASING CO., LTD.STAR JET LEASING CO., LTD.STRINGER LEASING CO., LTD.TAB LEASING CO., LTD.TILLER LEASING CO., LTD.TOGA LEASING CO., LTD.TRIM LEASING CO., LTD.TRIPLE A LIMITEDTWIN CRANE LEASING CO., LTD.WINGLET LEASING CO., LTD.Hotel and Travel ServicesAIRPORT HOTEL MANAGEMENT CO., LTD.ASAHI RYOKOUKAI CO., LTD.ASIA CREATIVE TOURS CO., LTD.ASIA CREATIVE TOURS HONGKONG LTD.BENKAY (U.S.A.), INC.BTG NIKKO INTERNATIONAL HOTELMANAGEMENT CO., LTD.CARGO CREATIVE SERVICE LTD.CHITOSE INTERNATIONAL HOTEL CO., LTD.CREATIVE GREETING SERVICE, INC.CREATIVE TOURS (SINGAPORE) PTE. LTD.CREATIVE TOURS LTD.CREATIVE TRAVEL (TAIWAN) LTD.EURO CREATIVE TOURS (UK) LTD.HAKUSAN OGUCHI MANAGEMENT ASSOCIATIONHAWAII HOTEL RESERVATIONS SYSTEMS, INC.HOTEL NIKKO (U.S.A.), INC.HOTEL NIKKO ANNUPURIHOTEL NIKKO OF SAN FRANCISCO, INC.HOTEL NIKKO OSAKA CO., LTD.HOTEL NIKKO SAIPAN, INC.HOTELES NIKKO S.A. DE C.V.HUAYA DEVELOPMENT CO., LTD.IMPERIAL TRAVEL SERVICE CO., LTD.INCONTRA, INC.INDO <strong>JAPAN</strong> AIR SERVICES PVT. LTD.J INTER CO., LTD. *UNOFFICIALJ PRO CO., LTD.<strong>JAL</strong> HOTELS COMPANY LTD.<strong>JAL</strong> HOTELS GMBH DUSSELDORF<strong>JAL</strong> SALES CO., LTD.<strong>JAL</strong> SALES OKINAWA CO., LTD.<strong>JAL</strong> SATELLITE TRAVEL CO., LTD.<strong>JAL</strong> TOURS CO., LTD.<strong>JAL</strong> TRAVEL CO., LTD.<strong>JAL</strong> TRAVEL HOKKAIDO CO., LTD.<strong>JAL</strong> TRAVEL KYUSHU CO., LTD.<strong>JAL</strong> TRAVEL NAGASAKI CO., LTD.<strong>JAL</strong> TRAVEL WESTERN <strong>JAPAN</strong> CO., LTD.<strong>JAL</strong>PAK CO., LTD.<strong>JAL</strong>PAK DE MEXICO S.A. DE C.V.<strong>JAL</strong>PAK HOLDING U.S.A., INC.<strong>JAL</strong>PAK INTERNATIONAL (AUSTRIA) GES. M.B.H.<strong>JAL</strong>PAK INTERNATIONAL (CHINA) CO., LTD.<strong>JAL</strong>PAK INTERNATIONAL (EUROPE) B.V.<strong>JAL</strong>PAK INTERNATIONAL (FRANCE) S.A.S.<strong>JAL</strong>PAK INTERNATIONAL (GERMANY) GMBH<strong>JAL</strong>PAK INTERNATIONAL (SPAIN) S.A.<strong>JAL</strong>PAK INTERNATIONAL (THAILAND) CO., LTD.<strong>JAL</strong>PAK INTERNATIONAL AMERICA, INC.<strong>JAL</strong>PAK INTERNATIONAL ASIA PTE LTD.<strong>JAL</strong>PAK INTERNATIONAL HAWAII, INC.<strong>JAL</strong>PAK INTERNATIONAL HONG KONG CO., LTD.<strong>JAL</strong>PAK INTERNATIONAL MICRONESIA, INC.<strong>JAL</strong>PAK INTERNATIONAL OCEANIA PTY LIMITED<strong>JAL</strong>PAK INTERNATIONAL U.S.A., INC.<strong>JAL</strong>PAK MALAYSIA SDN. BHD.<strong>JAL</strong>PAK SERVICE INC.<strong>JAL</strong>PAK TOUR & TRAVEL (THAILAND) CO., LTD.JDC (PACIFIC) LTD.JDC GUAM INC.JPI TOUR SERVICE, INC.MICRONESIAN HOSPITALITY, INC.NANSEI TOURIST DEVELOPMENT CO., LTD.NARITA NIKKO HOTEL CO., LTD.NEW NIKKO HOTEL CO., LTD.NIKKO HOTEL MANAGEMENT (THAILAND) CO.,LTD.NIKKO HOTELS (U.K.) LTD.OKUMA BEACH LAND CO., LTD.P.T. <strong>JAL</strong>PAK INTERNATIONAL BALIP.T. TAURINA TRAVEL JAYAPACIFIC INVESTMENT HOLDINGS CORPORATIONPARIS LIMOUSINE SERVICE S.A.R.L.SHURI KANKO CO., LTD.SUN INTERNATIONAL TRAVEL, INC.TOKYO HUMANIA ENTERPRISE INC.TOUR CREATE, INC.TRANS QUALITY, INC.TROPICAL LAUNDRY AND LINEN SUPPLYCOMPANY, LTD.UNIVERSAL HOLIDAYS, INC.VIEW WORLD COMPANY LIMITEDInformation ServicesAVICOM <strong>JAPAN</strong> CO., LTD.AVIONET (THAILAND) COMPANY LTD.AXESS INTERNATIONAL NETWORK, INC.E-MILENET LTD.<strong>JAL</strong> AVIONET ASIA LIMITED<strong>JAL</strong> AVIONET EUROPE LIMITED<strong>JAL</strong> AVIONET USA<strong>JAL</strong> INFORMATION TECHNOLOGY CO., LTD.JTA INFORMATION & COMMUNICATION CO., LTD.Leisure and Tourism ServicesASIA WINDS DEVELOPMENT CO., LTD.ASAHIKAWA RESORT DEVELOPMENT CO., LTD.TOMAKOMAI RYOKKA KAIHATSU CO., LTD.Limousine ServicesAIRPORT TRANSPORT SERVICE CO., LTD.AZUMA KOTSU CO., LTD.KANSAI AIRPORT TRANSPORTATION ENTERPRISEOSAKA AIRPORT TRANSPORT CO., LTD.SOUTHERN AIRPORT KOTSU CO., LTD.Real Estate and ConstructionANTARES INTERNATIONAL LIMITEDBLANCO VENDE, LTD.GLOBAL BUILDING CO., LTD.<strong>JAL</strong> CONSTRUCTION CO., LTD.<strong>JAPAN</strong> <strong>AIRLINES</strong> MANAGEMENT CORP.KOKEN CO., LTD.NAHA GENERAL BUILDING SERVICE CO., LTD.PACIFIC BUSINESS BASE, INC.SHEEN CHART LIMITEDTERMINAL ONE MANAGEMENT INC.TOKYO FLIGHT KITCHEN RESTAURANTES LTDA.TradingINTERNATIONAL AIRPORT CLEANING CO., LTD.<strong>JAL</strong> AEROPARTS (USA) CORPORATION<strong>JAL</strong> AEROPARTS CO., LTD.<strong>JAL</strong> AEROPARTS S.A.S.<strong>JAL</strong>-DFS CO., LTD.<strong>JAL</strong>UX (SHANGHAI) CO., LTD.<strong>JAL</strong>UX AIRPORT, INC.<strong>JAL</strong>UX AMERICAS, INC.<strong>JAL</strong>UX ASIA LTD.<strong>JAL</strong>UX ASIA SERVICE LTD.<strong>JAL</strong>UX EUROPE LIMITED<strong>JAL</strong>UX HAWAII, INC.<strong>JAL</strong>UX INC.JET FRESH THAILAND CO., LTD.JTA TRADING CO., LTD.MARUYOSHI CO., LTD.NAA & <strong>JAL</strong>-DFS CORPORATIONNJS COMPANY, LTD.NORDIS CO., LTD.TOKYO BAY RESTAURANT CO., LTD.TOKYO KINAI YOHIN CO., LTD.TOKYO KOKU CLEANING CO., LTD.49
<strong>JAL</strong> GROUP ROUTE NETWORKInternational RoutesLondonAmsterdamHamburgStockholmCopenhagenHelsinkiBerlinDusseldorfMoscowWarsawFrankfurtPragueParisBudapestZurich MunichShenyangMilanStuttgartDalianBeijingMadrid Barcelona RomeIstanbulTianjinSeoulQingdaoXi’anBusanShanghaiJapanDubaiDelhiChengdu HangzhouChongqing XiamenShenzhenKunmingGuangzhouHong KongChiang RaiChiang MaiBangkokHanoiHaikouManilaGuamPhuketKuala LumpurHat YaiHo Chi Minh CitySingaporeJakartaDenpasarCairnsBrisbaneSydneyAucklandMelbourneChristchurch50
KalamazooSyracuseGrand RapidsHarrisburg OttawaMilwaukee ToledoMontrealDetroitBuffaloTorontoRochesterClevelandVancouverMinneapolisColumbusBoston AlbanyMadisonHartfordDaytonOmaha ChicagoNew YorkPhiladelphiaKansas CityBaltimoreIndianapolisPeoriaWashingtonCincinnatiLexingtonRichmondSt. Louis LouisvillePittsburghEvansvilleBloomington NashvilleKnoxvilleRaleigh DurhamNorfolkDenverHuntsvilleMemphisSan FranciscoLas VegasFayettevilleSan JoseJacksonvilleCharlotteFresnoAlbuquerqueGreenvilleDallasSanta BarbaraAtlantaOrlandoLos AngelesEl PasoHoustonTampaOklahoma CityAustin San Antonio New OrleansSanta Ana John WayneMiami Fort LauderdaleMonterreySan DiegoHonoluluHawaii(Kona)Los CabosGuadalajaraMexico CityCancunSan JuanPapeeteSao Paulo• The above routes include code-sharing routes (as of May, <strong>2006</strong>).51
Domestic RoutesAsahikawaMemanbetsuOkadamaNew ChitoseObihiroKushiroOkushiriHakodateAomoriMisawaAkitaHanamakiYamagataNiigataSendaiFukushimaKomatsuIzumoOkiTajimaNagoyaShinshuMatsumotoNaritaHanedaHiroshima-NishiYamaguchiubeKitakyushuFukuoka OitaOkayamaHiroshimaKobeItamiKansaiTakamatsuMatsuyama TokushimaKochiNankiShirahamaChubuNagasakiKumamotoKagoshimaMiyazakiTanegashimaYakushimaTokunoshimaAmami-OshimaKikaiYonaguniHaterumaTaramaIshigakiKumeMiyakoAguniYoronNahaOkinoerabuKita-DaitoMinami-Daito<strong>JAL</strong> GROUP <strong>AIRLINES</strong><strong>JAPAN</strong> <strong>AIRLINES</strong> INTERNATIONAL CO., LTD.<strong>JAPAN</strong> <strong>AIRLINES</strong> DOMESTIC CO., LTD.<strong>JAPAN</strong> TRANS OCEAN AIR CO., LTD.<strong>JAL</strong> EXPRESS CO., LTD.<strong>JAPAN</strong> AIR COMMUTER CO., LTD.HOKKAIDO AIR SYSTEM CO., LTD.RYUKYU AIR COMMUTER CO., LTD.(as of May, <strong>2006</strong>)52
INVESTOR INFORMATIONCompany Name:Japan Airlines Corporation(Japan Airlines Group Holding Company)Date of Foundation: October 2, 2002Head Office:2-4-11, Higashi-shinagawa, Shinagawa-ku, Tokyo 140-8605, Japane-mail irdesk@jal.comPaid-in Capital: ¥100,000,000,000Number of Shares:Authorized7,000,000,000 sharesIssued1,982,383,250 sharesFloating Stock: 47.52%Number of Shareholders:329,922 including 383 non-JapaneseMajor Shareholders:Number of Shares Held (Thousands) /NameRatio of shareholdingTokyu Corporation 80,397/4.05Tokio Marine & Nichido Fire Insurance Co., Ltd. 75,471/3.80The Bank of Tokyo-Mitsubishi UFJ, Ltd. 44,772/2.25Nissay Dowa General Insurance Co., Ltd. 43,076/2.17Nippon Life Insurance Company 41,756/2.10Eitaro Itoyama 40,100/2.02Fukoku Mutual Life Insurance Company 40,001/2.01<strong>JAL</strong> Group Employees’ Stockholding 36,144/1.82Mizuho Corporate Bank, Ltd. 35,303/1.78Japan Trustee Services Bank, Ltd. (trust account) 33,691/1.69Stock Listings:Tokyo, Osaka, and Nagoya stock exchangesDepositary for American Depositary Receipts (ADRs): The Bank of New York101 Barclay Street, New York, NY 10286, U.S.A.Tel: (212) 815-2077U.S. toll free: (888) 269-2377 (888-BNY-ADRS)http://www.adrbny.comRatio: 1 ADR = 5 ordinary shareFiscal Year-End: March 31General Meeting of Stockholders:JuneStock Transfer Agent:Mitsubishi UFJ Trust and Banking corporationShare Handling Office:10-11, Higashi-Suna 7-chome, Koto-ku, Tokyo 137-8081, JapanDate for Confirmation of Stock Ownership: March 31Media for Public Notices:Nihon Keizai Shimbun issued in Tokyo area and our website(http://www.jal.com/ja/ir/stock/kabuka.html)Auditor:Shin Nihon & Co.(As of March 31, <strong>2006</strong>)ISSUE OF NEW SHARES THROUGH PUBLIC OFFERINGAt a meeting of June 30, <strong>2006</strong>, the Board of Directors approved an issue of new shares through public offering and private placement(exercising on overallotment option) as follows, with all payment completed on August 28, <strong>2006</strong>. As a result, a capital increase of¥74,250 million was carried out on August 28, <strong>2006</strong>, increasing the legal reserve by ¥74,250 million.(1) Type and number of shares to be issued: 750,000,000 shares of common stock(2) Price of newly issued shares: ¥198 per share(3) Total value of newly issued shares: ¥148,500 million(4) Total of amounts incorporated into paid-in capital: ¥74,250 million53
Japan Airlines Corporation(Japan Airlines Group Holding Company)2-4-11, Higashi-shinagawa, Shinagawa-ku,Tokyo 140-8605, JapanURL: http://www.jal.com/en/Printed in JapanPrinted on recycled paper