Ecclesiastical Investment Funds annual report and accounts - long ...
Ecclesiastical Investment Funds annual report and accounts - long ...
Ecclesiastical Investment Funds annual report and accounts - long ...
- No tags were found...

You also want an ePaper? Increase the reach of your titles
YUMPU automatically turns print PDFs into web optimized ePapers that Google loves.
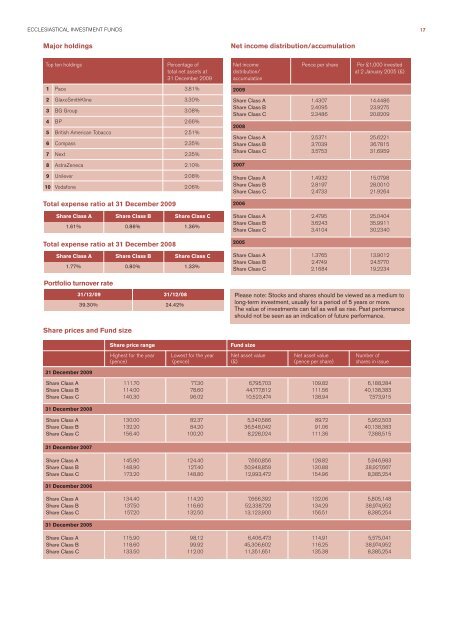
ECCLESIASTICAL <strong>Investment</strong> <strong>Funds</strong> 17Major holdingsNet income distribution/accumulationTop ten holdings12345678Percentage oftotal net assets at31 December 2009Pace 3.81%GlaxoSmithKline 3.30%BG Group 3.08%BP 2.66%British American Tobacco 2.51%Compass 2.35%Next 2.35%AstraZeneca 2.10%Net income Pence per share Per £1,000 investeddistribution/ at 2 January 2005 (£)accumulation2009Share Class A 1.4307 14.4486Share Class B 2.4095 23.9275Share Class C 2.3486 20.82092008Share Class A 2.5371 25.6221Share Class B 3.7039 36.7815Share Class C 3.5753 31.69592007910Unilever 2.08%Vodafone 2.06%Share Class A 1.4932 15.0798Share Class B 2.8197 28.0010Share Class C 2.4733 21.9264Total expense ratio at 31 December 2009Share Class A Share Class B Share Class C1.61% 0.86% 1.36%Total expense ratio at 31 December 2008Share Class A Share Class B Share Class C1.77% 0.80% 1.33%2006Share Class A 2.4795 25.0404Share Class B 3.6243 35.9911Share Class C 3.4104 30.23402005Share Class A 1.3765 13.9012Share Class B 2.4749 24.5770Share Class C 2.1684 19.2234Portfolio turnover rate31/12/09 31/12/0839.30% 24.42%Please note: Stocks <strong>and</strong> shares should be viewed as a medium to<strong>long</strong>-term investment, usually for a period of 5 years or more.The value of investments can fall as well as rise. Past performanceshould not be seen as an indication of future performance.Share prices <strong>and</strong> Fund size31 December 2009Share Class A 111.70 77.30 6,795,703 109.82 6,188,284Share Class B 114.00 78.60 44,777,812 111.56 40,138,383Share Class C 140.30 96.02 10,523,474 138.94 7,573,91531 December 2008Share Class A 130.00 82.37 5,340,586 89.72 5,952,503Share Class B 132.20 84.20 36,548,042 91.06 40,138,383Share Class C 156.40 100.20 8,228,024 111.36 7,388,51531 December 2007Share Class A 145.90 124.40 7,660,856 128.82 5,946,983Share Class B 148.90 127.40 50,948,859 130.88 38,927,667Share Class C 173.20 148.80 12,993,472 154.96 8,385,25431 December 2006Share Class A 134.40 114.20 7,666,392 132.06 5,805,148Share Class B 137.50 116.60 52,338,729 134.29 38,974,952Share Class C 157.20 132.50 13,123,900 156.51 8,385,25431 December 2005Share price rangeFund sizeHighest for the year Lowest for the year Net asset value Net asset value Number of(pence) (pence) (£) (pence per share) shares in issueShare Class A 115.90 98.12 6,406,473 114.91 5,575,041Share Class B 118.60 99.92 45,306,602 116.25 38,974,952Share Class C 133.50 112.00 11,351,651 135.38 8,385,254