- Energi-Indhold-05-UK - Energitilsynet
- Energi-Indhold-05-UK - Energitilsynet
- Energi-Indhold-05-UK - Energitilsynet
- No tags were found...

You also want an ePaper? Increase the reach of your titles
YUMPU automatically turns print PDFs into web optimized ePapers that Google loves.
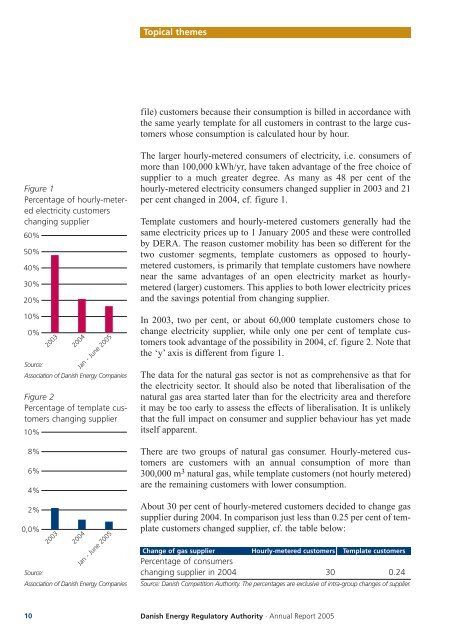
Topical themesfile) customers because their consumption is billed in accordance withthe same yearly template for all customers in contrast to the large customerswhose consumption is calculated hour by hour.Figure 1Percentage of hourly-meteredelectricity customerschanging supplier60%50%40%30%20%10%0%Source:Association of Danish Energy CompaniesFigure 2Percentage of template customerschanging supplier10%8%6%4%2%0,0%2003200320042004Jan - June 20<strong>05</strong>Jan - June 20<strong>05</strong>Source:Association of Danish Energy CompaniesThe larger hourly-metered consumers of electricity, i.e. consumers ofmore than 100,000 kWh/yr, have taken advantage of the free choice ofsupplier to a much greater degree. As many as 48 per cent of thehourly-metered electricity consumers changed supplier in 2003 and 21per cent changed in 2004, cf. figure 1.Template customers and hourly-metered customers generally had thesame electricity prices up to 1 January 20<strong>05</strong> and these were controlledby DERA. The reason customer mobility has been so different for thetwo customer segments, template customers as opposed to hourlymeteredcustomers, is primarily that template customers have nowherenear the same advantages of an open electricity market as hourlymetered(larger) customers. This applies to both lower electricity pricesand the savings potential from changing supplier.In 2003, two per cent, or about 60,000 template customers chose tochange electricity supplier, while only one per cent of template customerstook advantage of the possibility in 2004, cf. figure 2. Note thatthe ‘y’ axis is different from figure 1.The data for the natural gas sector is not as comprehensive as that forthe electricity sector. It should also be noted that liberalisation of thenatural gas area started later than for the electricity area and thereforeit may be too early to assess the effects of liberalisation. It is unlikelythat the full impact on consumer and supplier behaviour has yet madeitself apparent.There are two groups of natural gas consumer. Hourly-metered customersare customers with an annual consumption of more than300,000 m 3 natural gas, while template customers (not hourly metered)are the remaining customers with lower consumption.About 30 per cent of hourly-metered customers decided to change gassupplier during 2004. In comparison just less than 0.25 per cent of templatecustomers changed supplier, cf. the table below:Change of gas supplier Hourly-metered customers Template customersPercentage of consumerschanging supplier in 2004 30 0.24Source: Danish Competition Authority. The percentages are exclusive of intra-group changes of supplier.10 Danish Energy Regulatory Authority · Annual Report 20<strong>05</strong>