Annual report 10/11 - Dstl
Annual report 10/11 - Dstl
Annual report 10/11 - Dstl
- No tags were found...

Create successful ePaper yourself
Turn your PDF publications into a flip-book with our unique Google optimized e-Paper software.
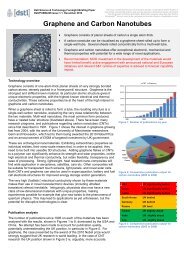
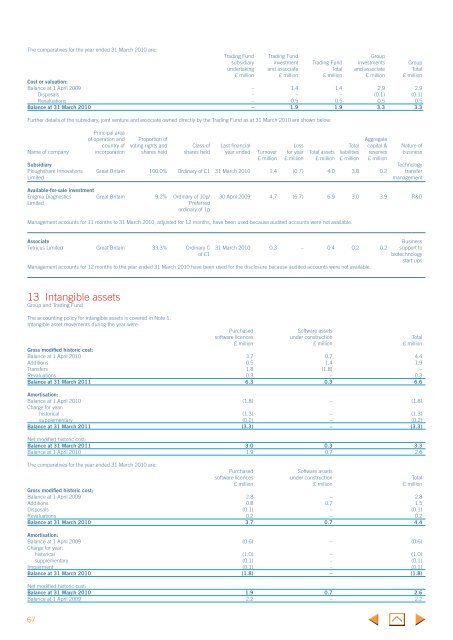
The comparatives for the year ended 31 March 20<strong>10</strong> are:Trading Fund Trading Fund Groupsubsidiary investment Trading Fund investments Groupundertaking and associate Total and associate Total£ million £ million £ million £ million £ millionCost or valuation:Balance at 1 April 2009 – 1.4 1.4 2.9 2.9Disposals – – – (0.1) (0.1)Revaluations – 0.5 0.5 0.5 0.5Balance at 31 March 20<strong>10</strong> – 1.9 1.9 3.3 3.3Further details of the subsidiary, joint venture and associate owned directly by the Trading Fund as at 31 March 20<strong>10</strong> are shown below:Principal areaof operation and Proportion of Aggregatecountry of voting rights and Class of Last financial Loss Total capital & Nature ofName of company incorporation shares held shares held year ended Turnover for year Total assets liabilities reserves business£ million £ million £ million £ million £ millionSubsidiaryTechnologyPloughshare Innovations Great Britain <strong>10</strong>0.0% Ordinary of £1 31 March 20<strong>10</strong> 1.4 (0.7) 4.0 3.8 0.2 transferLimitedmanagementAvailable-for-sale investmentEnigma Diagnostics Great Britain 9.2% Ordinary of <strong>10</strong>p/ 30 April 2009 4.7 (6.7) 6.9 3.0 3.9 R&DLimitedPreferredordinary of 1pManagement accounts for <strong>11</strong> months to 31 March 20<strong>10</strong>, adjusted for 12 months, have been used because audited accounts were not available.AssociateBusinessTetricus Limited Great Britain 33.3% Ordinary C 31 March 20<strong>10</strong> 0.3 – 0.4 0.2 0.2 support toof £1biotechnologystart upsManagement accounts for 12 months to the year ended 31 March 20<strong>10</strong> have been used for the disclosure because audited accounts were not available.13 Intangible assetsGroup and Trading FundThe accounting policy for intangible assets is covered in Note 1.Intangible asset movements during the year were:PurchasedSoftware assetssoftware licences under construction Total£ million £ million £ millionGross modified historic cost:Balance at 1 April 20<strong>10</strong> 3.7 0.7 4.4Additions 0.5 1.4 1.9Transfers 1.8 (1.8) –Revaluations 0.3 – 0.3Balance at 31 March 20<strong>11</strong> 6.3 0.3 6.6Amortisation:Balance at 1 April 20<strong>10</strong> (1.8) – (1.8)Charge for year:historical (1.3) – (1.3)supplementary (0.2) – (0.2)Balance at 31 March 20<strong>11</strong> (3.3) – (3.3)Net modified historic cost:Balance at 31 March 20<strong>11</strong> 3.0 0.3 3.3Balance at 1 April 20<strong>10</strong> 1.9 0.7 2.6The comparatives for the year ended 31 March 20<strong>10</strong> are:PurchasedSoftware assetssoftware licences under construction Total£ million £ million £ millionGross modified historic cost:Balance at 1 April 2009 2.8 – 2.8Additions 0.8 0.7 1.5Disposals (0.1) – (0.1)Revaluations 0.2 – 0.2Balance at 31 March 20<strong>10</strong> 3.7 0.7 4.4Amortisation:Balance at 1 April 2009 (0.6) – (0.6)Charge for year:historical (1.0) – (1.0)supplementary (0.1) – (0.1)Impairment (0.1) – (0.1)Balance at 31 March 20<strong>10</strong> (1.8) – (1.8)Net modified historic cost:Balance at 31 March 20<strong>10</strong> 1.9 0.7 2.6Balance at 1 April 2009 2.2 – 2.267