Danish Acoustical Society Round Robin on room acoustic computer ...
Danish Acoustical Society Round Robin on room acoustic computer ...
Danish Acoustical Society Round Robin on room acoustic computer ...

You also want an ePaper? Increase the reach of your titles
YUMPU automatically turns print PDFs into web optimized ePapers that Google loves.
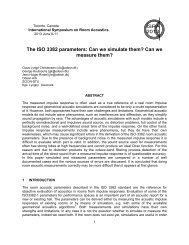
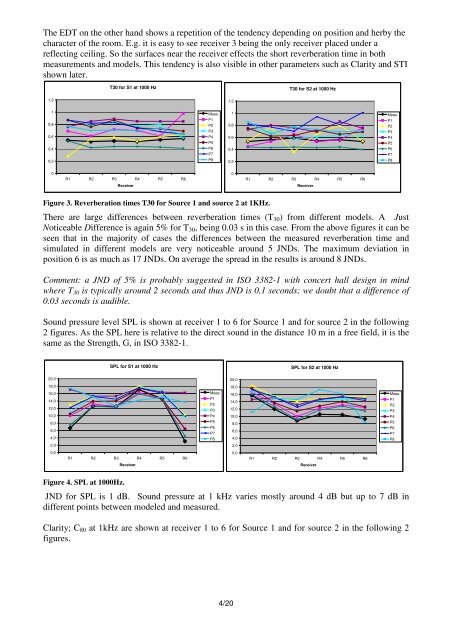
The EDT <strong>on</strong> the other hand shows a repetiti<strong>on</strong> of the tendency depending <strong>on</strong> positi<strong>on</strong> and herby the<br />
character of the <strong>room</strong>. E.g. it is easy to see receiver 3 being the <strong>on</strong>ly receiver placed under a<br />
reflecting ceiling. So the surfaces near the receiver effects the short reverberati<strong>on</strong> time in both<br />
measurements and models. This tendency is also visible in other parameters such as Clarity and STI<br />
shown later.<br />
1,2<br />
1<br />
0,8<br />
0,6<br />
0,4<br />
0,2<br />
0<br />
T30 for S1 at 1000 Hz<br />
R1 R2 R3 R4 R5 R6<br />
Receiver<br />
Meas.<br />
P1<br />
P2<br />
P3<br />
P4<br />
P5<br />
P6<br />
P7<br />
P8<br />
Figure 3. Reverberati<strong>on</strong> times T30 for Source 1 and source 2 at 1KHz.<br />
1,2<br />
1<br />
0,8<br />
0,6<br />
0,4<br />
0,2<br />
0<br />
4/20<br />
T30 for S2 at 1000 Hz<br />
R1 R2 R3 R4 R5 R6<br />
There are large differences between reverberati<strong>on</strong> times (T30) from different models. A Just<br />
Noticeable Difference is again 5% for T30, being 0.03 s in this case. From the above figures it can be<br />
seen that in the majority of cases the differences between the measured reverberati<strong>on</strong> time and<br />
simulated in different models are very noticeable around 5 JNDs. The maximum deviati<strong>on</strong> in<br />
positi<strong>on</strong> 6 is as much as 17 JNDs. On average the spread in the results is around 8 JNDs.<br />
Comment: a JND of 5% is probably suggested in ISO 3382-1 with c<strong>on</strong>cert hall design in mind<br />
where T30 is typically around 2 sec<strong>on</strong>ds and thus JND is 0,1 sec<strong>on</strong>ds; we doubt that a difference of<br />
0.03 sec<strong>on</strong>ds is audible.<br />
Sound pressure level SPL is shown at receiver 1 to 6 for Source 1 and for source 2 in the following<br />
2 figures. As the SPL here is relative to the direct sound in the distance 10 m in a free field, it is the<br />
same as the Strength, G, in ISO 3382-1.<br />
20,0<br />
18,0<br />
16,0<br />
14,0<br />
12,0<br />
10,0<br />
8,0<br />
6,0<br />
4,0<br />
2,0<br />
0,0<br />
SPL for S1 at 1000 Hz<br />
R1 R2 R3 R4 R5 R6<br />
Figure 4. SPL at 1000Hz.<br />
Receiver<br />
Meas.<br />
P1<br />
P2<br />
P3<br />
P4<br />
P5<br />
P6<br />
P7<br />
P8<br />
20,0<br />
18,0<br />
16,0<br />
14,0<br />
12,0<br />
10,0<br />
8,0<br />
6,0<br />
4,0<br />
2,0<br />
0,0<br />
Receiver<br />
SPL for S2 at 1000 Hz<br />
R1 R2 R3 R4 R5 R6<br />
JND for SPL is 1 dB. Sound pressure at 1 kHz varies mostly around 4 dB but up to 7 dB in<br />
different points between modeled and measured.<br />
Clarity; C80 at 1kHz are shown at receiver 1 to 6 for Source 1 and for source 2 in the following 2<br />
figures.<br />
Receiver<br />
Meas.<br />
P1<br />
P2<br />
P3<br />
P4<br />
P5<br />
P6<br />
P7<br />
P8<br />
Meas.<br />
P1<br />
P2<br />
P3<br />
P4<br />
P5<br />
P6<br />
P7<br />
P8