Comparisons between Computer Simulations of Room ... - Odeon
Comparisons between Computer Simulations of Room ... - Odeon
Comparisons between Computer Simulations of Room ... - Odeon

You also want an ePaper? Increase the reach of your titles
YUMPU automatically turns print PDFs into web optimized ePapers that Google loves.
2.2 Sound Source and Receiver Positions<br />
Sound source and receiver positions in simulation<br />
models are defined according to the survey in 1989. S1<br />
(the typical soloist position), S2 (the middle <strong>of</strong> right<br />
side strings <strong>between</strong> violas and cellos) and S3 (far left in<br />
second row <strong>of</strong> the wind) are sound source positions. P1<br />
(the normal position <strong>of</strong> solo oboist), P2 (the middle <strong>of</strong><br />
left side strings <strong>between</strong> the first and second violins) and<br />
P3 (far right in second row <strong>of</strong> the wind) are the receiver<br />
positions on the platform for each source position. The<br />
distance <strong>of</strong> S2-P2 is about 8 meters. The distance <strong>of</strong><br />
S3-P3 is about 6 meters. S1-S3 and P1-P3 positions are<br />
one meter above the floor. R1-R5, R6 or R7 are receiver<br />
positions in the audience area. These positions are 1.2<br />
meters above the floor.<br />
3. Acoustical Parameters<br />
Six acoustical parameters, which are Reverberation<br />
Time “RT”, Early Decay Time “EDT”, Level “L”,<br />
Clarity “C”, Center Time “Ts” and Lateral Energy<br />
Fraction “LEF”, were measured for each concert hall<br />
in 1989. These are also calculated for each model to<br />
compare with those measured. The calculation method<br />
for each acoustical parameter in this sound simulation<br />
follows ISO3382.<br />
4. Accuracy Rating <strong>of</strong> Acoustical Parameter<br />
For examining accuracy rating <strong>of</strong> acoustical parameter,<br />
the relative errors <strong>of</strong> each acoustical parameter<br />
Hiroyoshi SHIOKAWA and Jens Holger RINDEL<br />
– 6 –<br />
<strong>between</strong> measurement data and simulated data are<br />
calculated on the each measurement points. The average<br />
<strong>of</strong> the relative errors for each acoustical parameter<br />
on the audience area and the platform area are<br />
respectively calculated from the formula (1) for RT<br />
and EDT and the formula (2) for C, L, Ts and LEF on<br />
each frequency.<br />
The formula for RT and EDT is as follows.<br />
APmeasured<br />
APsimulated<br />
100<br />
APmeasured<br />
Error<br />
SL<br />
N<br />
∑ − ×<br />
×<br />
=<br />
The formula for C, L, Ts and LEF is as follows.<br />
Error =<br />
measured<br />
NPos<br />
AP measured = Measured value <strong>of</strong> the current acoustic<br />
parameter<br />
AP simulated = Simulated value <strong>of</strong> the current acoustic<br />
parameter<br />
SL = The subjective limen for the current acoustic<br />
parameter<br />
N Pos = Number <strong>of</strong> measuring positions<br />
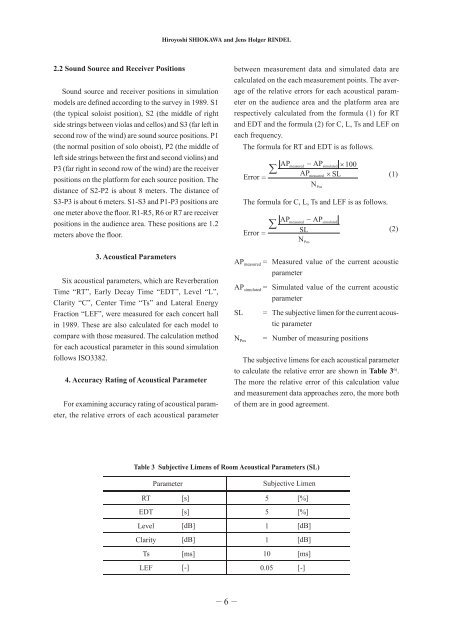
Table 3 Subjective Limens <strong>of</strong> <strong>Room</strong> Acoustical Parameters (SL)<br />
∑<br />
AP<br />
Pos<br />
− AP<br />
SL<br />
simulated<br />
(1)<br />
(2)<br />
The subjective limens for each acoustical parameter<br />
to calculate the relative error are shown in Table 36) .<br />
The more the relative error <strong>of</strong> this calculation value<br />
and measurement data approaches zero, the more both<br />
<strong>of</strong> them are in good agreement.<br />
Parameter Subjective Limen<br />
RT [s] 5 [%]<br />
EDT [s] 5 [%]<br />
Level [dB] 1 [dB]<br />
Clarity [dB] 1 [dB]<br />
Ts [ms] 10 [ms]<br />
LEF [-] 0.05<br />
[-]