MEGAPOLI Megacities: Emissions, urban ... - MEGAPOLI - DMI
MEGAPOLI Megacities: Emissions, urban ... - MEGAPOLI - DMI
MEGAPOLI Megacities: Emissions, urban ... - MEGAPOLI - DMI

Create successful ePaper yourself
Turn your PDF publications into a flip-book with our unique Google optimized e-Paper software.
<strong>MEGAPOLI</strong> Scientific Report 11-17<br />
Evaluation of State-of-the-Art CTMs Using New<br />
Experimental Datasets<br />
<strong>MEGAPOLI</strong> Deliverable D3.6<br />
M. Beekmann, C. Fountoukis, Q.J. Zhang, S. N. Pandis<br />
and the <strong>MEGAPOLI</strong> Campaign Team<br />
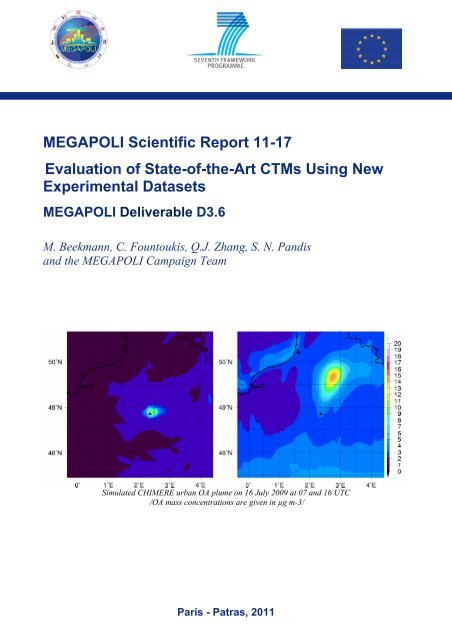
Simulated CHIMERE <strong>urban</strong> OA plume on 16 July 2009 at 07 and 16 UTC<br />
/OA mass concentrations are given in µg m-3/<br />
Paris - Patras, 2011
FP7 EC <strong>MEGAPOLI</strong> Project<br />
Colophon<br />
Serial title:<br />
<strong>MEGAPOLI</strong> Scientific Report 11-17<br />
Title:<br />
Evaluation of state-of-the-art CTMs using new experimental datasets<br />
Subtitle:<br />
<strong>MEGAPOLI</strong> Deliverable D3.6<br />
Editor(s):<br />
-<br />
Main Author(s):<br />
M. Beekmann (1), C. Fountoukis (2), Q.J. Zhang (1), S. N. Pandis (2)<br />
(1) Laboratoire Interuniversitaire des Systèmes Atmosphériques (LISA), Créteil, France<br />
(2) Institute of Chemical Engineering and High Temperature Chemical Processes, Foundation for Research<br />
Technology Hellas (FORTH), Patra, Greece<br />
Contributing Author(s):<br />
-<br />
Responsible institution(s):<br />
Centre National de Recherche, Laboratoire Interuniversitaire des Systèmes Atmosphériques<br />
(CNRS-LISA)<br />
Language:<br />
English<br />
Keywords:<br />
Chemistry-transport model, model evaluation, aerosol, megacity<br />
Url:<br />
http://megapoli.dmi.dk/publ/<strong>MEGAPOLI</strong>_sr11-17.pdf<br />
Digital ISBN:<br />
978-87-92731-21-0<br />
<strong>MEGAPOLI</strong>:<br />
<strong>MEGAPOLI</strong>-43-REP-2011-09<br />
Website:<br />
www.megapoli.info<br />
Copyright:<br />
FP7 EC <strong>MEGAPOLI</strong> Project<br />
www.megapoli.info<br />
2
FP7 EC <strong>MEGAPOLI</strong> Project<br />
Content:<br />
Abstract ................................................................................................................................................4<br />
1. Introduction....................................................................................................................................5<br />
2. Model Description and Application................................................................................................6<br />
2.1 PMCAMx-2008 .........................................................................................................................6<br />
2.1.1 Model description ...............................................................................................................6<br />
2.1.2 Model application ...............................................................................................................7<br />
2.2 CHIMERE model description and set-up ..................................................................................8<br />
3. Evaluation Results..........................................................................................................................11<br />
3.1 PMCAMx-2008 .......................................................................................................................11<br />
3.2 CHIMERE................................................................................................................................16<br />
3.2.1 Comparison for ground based sites...................................................................................16<br />
3.2.2 Simulations of the Paris <strong>urban</strong> plume ...............................................................................17<br />
3.2.3 Comparison between airborne observations and simulations...........................................17<br />
Acknowledgements............................................................................................................................21<br />
References..........................................................................................................................................22<br />
Previous <strong>MEGAPOLI</strong> reports............................................................................................................24<br />
www.megapoli.info<br />
3
FP7 EC <strong>MEGAPOLI</strong> Project<br />
Abstract<br />
Detailed observations obtained during the summer 2009 and winter 2010 <strong>MEGAPOLI</strong> campaign in<br />
and around the Paris agglomeration are used for the evaluation of two state-of-the-art chemical<br />
transport models (CHIMERE and PMCAMx). Aerosol and gas phase measurements obtained at<br />
three sub(<strong>urban</strong>) grand based sites and from research flights in the pollution plume during the<br />
<strong>MEGAPOLI</strong> campaigns are compared against the model predicted concentrations for the same periods.<br />
The simulation of organic aerosol is a major focus of this evaluation, given the inability of<br />
past modeling efforts to reproduce observations in polluted areas. Model predictions are compared<br />
against high time resolution (AMS) measurements of fine particulate matter from the three sites and<br />
from the aircraft.<br />
PMCAMx-2008, a detailed three dimensional chemical transport model (CTM), is applied for the<br />
first time in the European domain to simulate the mass concentration and chemical composition of<br />
particulate matter (PM). The CHIMERE CTM has been largely used for pollution simulation and<br />
air quality forecast over Europe or European sub-domains. Both models have not yet been compared<br />
with detailed aerosol and gas phase measurement such as those obtained within the MEGA-<br />
POLI project. Both models include a state-of-the-art organic aerosol module which is based on the<br />
volatility basis set framework treating both primary and secondary organic components to be semivolatile<br />
and photochemically reactive.<br />
The comparison of the model predictions with the ground and aircraft measurements is encouraging.<br />
Models reproduce successfully the secondary organic aerosol (SOA) transport to the agglomeration,<br />
and its build-up within the Paris plume. This is clearly a positive result, given the difficulty<br />
for chemistry-transport models to correctly simulate SOA.<br />
www.megapoli.info<br />
4
FP7 EC <strong>MEGAPOLI</strong> Project<br />
1. Introduction<br />
Sulfate and organics are the major components of sub-micrometer particles (PM1) in most locations<br />
throughout the world. Organic particulate matter, originating from many different natural and anthropogenic<br />
sources and processes, is the least understood component of atmospheric aerosols.<br />
More than 50% of the atmospheric fine aerosol mass can be comprised of organic compounds at<br />
continental mid-latitudes and as high as 90% in tropical forested areas (Andreae and Crutzen, 1997;<br />
Roberts et al., 2001; Kanakidou et al., 2005). Organic aerosol (OA) is generally categorized into<br />
two types; primary organic aerosol (POA) which is injected into the atmosphere in the particulate<br />
phase and secondary organic aerosol (SOA) which is emitted as volatile organic compounds<br />
(VOCs) in the gas phase and then reacts and condenses in the particulate phase. In order to gain<br />
more insight into sources and processes of organic aerosol, quantification, characterization and<br />
speciation of organic aerosol is needed which was until recently hindered by analytical difficulties<br />
(Kanakidou et al., 2005). For instance, conventional techniques (e.g. GC-MS) can only be used for<br />
the speciation of a small fraction of the OA mass. Within the last decade, several new methods have<br />
emerged that can analyze and quantify the different types of OA present in ambient aerosol. Among<br />
several measurement techniques, the Aerosol Mass Spectrometer (AMS) is the most commonly<br />
used to measure the size-resolved mass concentration and corresponding total mass spectrum of organic<br />
aerosols with a time resolution of minutes (Jayne et al., 2000; Zhang et al., 2005a; Takegawa<br />
et al., 2005). Information about processes or sources contributing to the OA levels can be provided<br />
from the Positive Matrix Factorization (PMF) method (Paatero and Tapper, 1994; Paatero, 1997;<br />
Lanz et al., 2007, 2009; Ng et al., 2009) or the custom principal component analysis (Zhang et al.,<br />
2005b) of the AMS measurements. These methods allow a classification of the OA into two different<br />
types based on their different temporal and mass spectral signatures; the hydrocarbon-like organic<br />
aerosol (HOA) and the oxygenated organic aerosol (OOA) which together usually account for<br />
all the OA mass measured by the AMS (Zhang et al., 2005b). HOA correlates with fossil fuel fresh<br />
POA in <strong>urban</strong> areas while OOA correlates with secondary OA.<br />
During the <strong>MEGAPOLI</strong> summer and winter campaigns, detailed aerosol and gaseous measurements<br />
have been obtained at three ground based sites located within the Paris greater area: LHVP within<br />
Paris (13 Arrondissement), SIRTA at the south-western edge of the agglomeration, and GOLF at its<br />
north-eastern edge (see <strong>MEGAPOLI</strong> Deliverable 3.1). In addition, aircraft measurements were<br />
taken in the Paris pollution plume during more than ten flights (see <strong>MEGAPOLI</strong> Deliverable 3.4).<br />
These data are used for the evaluation of two state-of-the-art chemical transport models (CTMs),<br />
PMCAMx-2008 and CHIMERE. These models and their specific settings for this application are<br />
described in Chapter 2. Evaluation results are given in Section 3. PMCAMx-2008 is compared both<br />
to summer and winter campaign observations at ground based sites. CHIMERE is compared to<br />
summer campaign observations at the ground-based sites and aloft.<br />
www.megapoli.info<br />
5
FP7 EC <strong>MEGAPOLI</strong> Project<br />
2. Model Description and Application<br />
2.1 PMCAMx-2008<br />
2.1.1 Model description<br />
PMCAMx-2008 (Murphy and Pandis, 2009; Tsimpidi et al., 2010; Karydis et al., 2010) uses the<br />
framework of the CAMx air quality model (Environ, 2003) describing the processes of horizontal<br />
and vertical advection, horizontal and vertical dispersion, wet and dry deposition, and gas-phase<br />
chemistry. For the aerosol processes, three detailed aerosol modules are used. The approach of<br />
Fahey and Pandis (2001) is used for the simulation of aqueous-phase chemistry. The inorganic<br />
aerosol growth is described in Gaydos et al., (2003) and Koo et al., (2003), and the secondary organic<br />
aerosol (SOA) formation and growth in Koo et al. (2003). These aerosol modules use a sectional<br />
approach to dynamically track the size evolution of the aerosol mass across 10 size sections<br />
spanning from 40 nm to 40 μm. The aerosol species modeled include sulfate, nitrate, ammonium,<br />
sodium, chloride, potassium, calcium, magnesium, elemental carbon, primary and secondary organics.<br />
The chemical mechanism used in the gas-phase chemistry is based on the SAPRC99 mechanism<br />
(Carter, 2000; Environ, 2003). The mechanism includes 211 reactions of 56 gases and 18<br />
radicals.<br />
Three options are available in PMCAMx-2008 for the simulation of inorganic aerosol growth. The<br />
most computationally efficient approach is the bulk equilibrium approach, which assumes equilibrium<br />
between the bulk inorganic aerosol and gas phase. At a given time step the amount of each<br />
species transferred between the gas and aerosol phases is determined by applying the aerosol thermodynamic<br />
equilibrium model ISORROPIA (Nenes et al., 1998) and is then distributed over the<br />
aerosol size sections by using weighting factors for each size section based on their surface area<br />
(Pandis et al., 1993). The second approach (hybrid approach) assumes equilibrium for the fine particles<br />
(
FP7 EC <strong>MEGAPOLI</strong> Project<br />
Chemical aging through gas-phase oxidation of OA vapors is modeled using a gas-phase OH reaction<br />
with a rate constant of k= 1 × 10 -11 cm 3 molec -1 s -1 for anthropogenic SOA and k = 4 × 10 -11<br />
cm 3 molec -1 s -1 for the primary OA (Atkinson and Arey, 2003). The base-case simulation does not<br />
age biogenic SOA (Ng et al., 2006; Presto et al., 2006; Lane et al., 2008b). Each reaction is assumed<br />
to decrease the volatility of the vapor material by a factor of 10.<br />
2.1.2 Model application<br />
The PMCAMx-2008 coarse grid modeling domain covers a 5400 × 5832 km 2 region in Europe with<br />
36 × 36 km grid resolution and 14 vertical layers covering approximately 6 km. PMCAMx-2008<br />
was set to perform simulations on a rotated polar stereographic map projection. The first three days<br />
of each simulation were excluded from the analysis to limit the effect of the initial conditions on the<br />
results. Concentrations of the major PM1 species at the boundaries of the domain are shown in Table<br />
1 (for the period of July 2009), representing background concentrations with each domain side<br />
having different boundary conditions. The boundary condition organic aerosol (BC-OA) is expected<br />
to consist of both SOA and oxidized POA. Here we assume that the BC-OA is all oxidized and half<br />
of it is biogenic OA and the other half oxidized primary OA (Kanakidou et al., 2005; Farina et al.,<br />
2010). All concentrations reported here are under ambient temperature and pressure conditions.<br />
The necessary inputs to the model include horizontal wind components, vertical diffusivity, temperature,<br />
pressure, water vapor, clouds and rainfall. The meteorological model WRF (Weather Research<br />
and Forecasting; Skamarock et al., 2005) was used to create the above inputs. WRF was<br />
driven by static geographical data and dynamic meteorological data (near real-time and historical<br />
data generated by the Global Forecast System (1 x 1 deg)). 27 sigma-p layers up to 0.1 bars were<br />
used in the vertical dimension. Each layer of PMCAMx-2008 is aligned with the layers used in<br />
WRF. The WRF run for both periods was periodically re-initialized (every 3 days) to ensure accuracy<br />
in the corresponding fields that are used as inputs in PMCAMx-2008.<br />
www.megapoli.info<br />
Table 1: Aerosol concentrations (in μg m -3 ) at the boundaries of the domain.<br />
Species Boundaries<br />
North South West East<br />
OA<br />
1 0.5 0.5 1<br />
Sulfate<br />
1 1 1 1<br />
Ammonium 0.37 0.37 0.37 0.37<br />
Nitrate 0.1 0.02 0.01 0.1<br />
Sodium 0.001 0.005 0.09 0.03<br />
Chloride 0.002 0.01 0.1 0.05<br />
Anthropogenic and biogenic hourly emission gridded fields were developed for the European domain<br />
for gases and primary particulate matter. Volatile organic compounds are split based on the<br />
SAPRC 99 chemical mechanism.<br />
The model was run with coarse grid spacing over the wide regional (European) domain in which a<br />
spatial resolution of 36×36 km 2 was used, while within the same run, a fine grid nest was applied<br />
over the Megacity of Paris where high resolution (4×4 km 2 ) was used (Fig. 1). High resolution<br />
emissions were used for the fine grid nest simulation while for the meteorological input of the fine<br />
grid PMCAMx-2008 was set to interpolate the meteorological fields from the parent grid. The fine<br />
grid contains the same vertical resolution with the parent grid (14 vertical layers). The PMCAMx-<br />
2008 fine grid modeling domain covers a 216 × 180 km 2 region in Paris with the city center cen-<br />
7
FP7 EC <strong>MEGAPOLI</strong> Project<br />
trally located in the domain.<br />
Figure 1: Modeling domain of PMCAMx-2008 for Europe (36×36 km 2 grid resolution) and for the Paris<br />
greater area (4×4 km 2 grid resolution).<br />
2.2 CHIMERE model description and set-up<br />
The model used in this study is the Eulerian regional chemistry-transport model CHIMERE in its<br />
version V2008b (see http://euler.lmd.polytechnique.fr/chimere). The initial gas-phase only version<br />
of the model has been described in Schmidt et al. (2001) and Vautard et al. (2001), the aerosol part<br />
in Bessagnet et al. (2004 and 2008). The model has been largely applied for continental scale air<br />
quality forecast (Honoré et al., 2008; http://www.prevair.org), and simulations, including sensitivity<br />
studies, with respect to anthropogenic (Beekmann and Vautard, 2010) and biogenic emissions<br />
(Curci et al., 2009) and inverse emission modeling (Konovalov et al., 2006). The model has been<br />
extensively applied for simulating gas phase pollution levels over the Paris region (e.g. Deguillaume<br />
et al., 2008), and on several occasions particulate matter (e.g. Bessagnet, 2005; Hodzic et al.,<br />
2006, Sciare et al., 2010).<br />
In this work, we used CHIMERE with nested domains, a continental domain covering Europe<br />
(CONT3) with a resolution of 0.5° ([35–57.5°N; 10.5°W–22.5°E]) and a regional domain over<br />
Northern France (MEG3) covering all the flight patterns during this campaign (see <strong>MEGAPOLI</strong><br />
Deliverable 3.4) with a resolution of 3 km (see Figure 2). 8 hybrid-sigma vertical layers are used,<br />
with the first layer at about 40 m, extending to 500 hPa.<br />
Troposphere photochemistry is represented using the reduced MELCHIOR chemical mechanism<br />
(Lattuati, 1997; Derognat, 2003), including 120 reactions and 44 prognostic gaseous species. For<br />
simulation of the particulate phase, 8 bins of particulate sizes are used in the model from 0.04 to 10<br />
µm. Condensation of semivolatile organic and inorganic gases is simulated with a coupled dynamic-thermodynamic<br />
scheme. The thermodynamic mechanism of inorganic species (sulfate, ni-<br />
www.megapoli.info<br />
8
FP7 EC <strong>MEGAPOLI</strong> Project<br />
trate and ammonium) is interpolated from the tabulation calculated with the ISORROPIA model<br />
(Nenes et al., 1998).<br />
Figure 2: The two nested simulation domains, a continental domain CONT3 (in red) with a resolution of<br />
0.5° and a Northern France domain MEG3 (in blue) with a resolution of 3 km.<br />
For the <strong>MEGAPOLI</strong> project, the VBS approach for SOA formation has been implemented in CHI-<br />
MERE similar to work described in Hodzic et al. (2010). This scheme has already been described in<br />
Section 2.1 for the PMCAMx-2008 model. Here only specific settings in our application are described.<br />
The oxidation and aging of SVOC from evaporated POA is simulated with a kinetic reaction<br />
rate of OH of 4×10 -11 cm 3 molec -1 s -1 (Robinson et al., 2007). The oxidation of anthropogenic<br />
and biogenic VOCs and the aging of their semivolatile products are simulated according to Murphy<br />
and Pandis (2009) with yields corresponding to “low” NOx parameterization. Aging is included<br />
both for anthropogenic and biogenic VOC with a kinetic reaction rate of OH of 1 × 10 -11 cm 3<br />
molec -1 s -1 . Among others, numerical experiments with an explicit chemical mechanism coupled to<br />
a condensation scheme indicate that gas phase aging is important for SOA formation from α-pinene<br />
(Valorso et al., 2010). Sensitivity tests with different settings of the SOA formation scheme are described<br />
in the <strong>MEGAPOLI</strong> Deliverable 3.7.<br />
Meteorological parameters are input for CTM with results from simulations with PSU/NCAR MM5<br />
model (Dudhia, 1993) for the two nested domains with 45 km (European domain) and 15 km<br />
(North-West Europe) resolution. In the vertical, 23 vertical sigma layers extend up to 100hPa MM5<br />
is forced by the analyses from the Global Forecast System (GFS/FNL) operated daily by the American<br />
National Centers for Environmental Prediction (NCEP), using the grid nudging (grid FDDA)<br />
option implemented within MM5.<br />
Anthropogenic gas phase emissions are calculated from EMEP annual totals (http://www.ceip.at/<br />
emission-data-webdab), black carbon (BC) and primary organic aerosol (POA) are prescribed from<br />
the Laboratoire d’Aerologie data-base (Junkle and Louisse, 2008). These emissions are scaled to<br />
hourly emissions applying temporal profiles provided by IER (Friedrich, 1997). They are downscaled<br />
to the high resolution grid over Northern France using an <strong>urban</strong> landuse fraction. Biogenic<br />
emissions are calculated using the MEGAN model data and parameterizations (Guenther et al.,<br />
2006).<br />
CHIMERE simulations use boundary conditions from a monthly climatology simulated with the<br />
LMDz-INCA2 and LMDz-AERO general circulation model. The boundary condition for organic<br />
aerosol concentrations at the western model boundary (Atlantic) is set to 0.7 µg m -3 according to<br />
www.megapoli.info<br />
9
FP7 EC <strong>MEGAPOLI</strong> Project<br />
long-period measurements and climatologic analysis (Seinfeld and Pandis, 2006).<br />
www.megapoli.info<br />
10
FP7 EC <strong>MEGAPOLI</strong> Project<br />
3. Evaluation Results<br />
3.1 PMCAMx-2008<br />
Figures 3 and 4 show the PMCAMx-2008 average ground-level concentrations for PM1 total mass,<br />
organic aerosol, elemental carbon, sulfate, ammonium and nitrate over the two periods of simulation,<br />
respectively. Overall, during the summer period, OA is predicted to account for 25% of total<br />
PM1 at ground level averaged over the entire (nested) domain, followed by nitrate (21%), sulfate<br />
(16%), ammonium (12%), and EC (6%). The remaining is crustal material, sea-salt and metal oxides.<br />
During the winter period the contribution of EC to total PM1 increases to 15% while OA contributes<br />
almost the same as during the summer period, although its absolute concentrations increase<br />
by ~30% compared to the July 2009 period. Concentrations of ammonium, nitrated and sulfate are<br />
predicted to be lower during the January 2010 period, contributing 10, 11 and 8 %, respectively, to<br />
total PM1 over the subdomain of the Paris area.<br />
Figures 5 and 6 show time series of PM1 OA concentrations (predicted vs. observed) at the LHVP,<br />
SIRTA and GOLF sites during the summer 2009 and winter 2010 campaigns in Paris. Model results<br />
include predictions from both the coarse and fine grid resolution. During summertime, in LHVP the<br />
average predicted concentration for total OA is 2.1 μg m -3 with the fine grid and 2.0 μg m -3 with the<br />
coarse grid compared to an AMS measured value of 3.5 μg m -3 . In SIRTA the model captures the<br />
magnitude of the measured OA, predicting an average concentration of 1.8 and 1.9 μg m -3 with the<br />
fine and coarse grid, respectively, compared to an observed average OA concentration of 1.8 μg<br />
m -3 . In GOLF, where concentrations are locally influenced by the nearby road traffic, the model under-predicts<br />
peak concentrations during some days. On average, the fine grid simulation predicts a<br />
concentration of 2.1 μg m -3 while the measured OA value was 2.5 μg m -3 . During the winter period,<br />
concentrations of OA in Paris were higher than the summertime due to increased primary emissions<br />
from combustion processes. In the city center (LHVP site) the fine grid simulation predicts an average<br />
monthly value for OA of 4.0 μg m -3 , considerably higher than the coarse grid simulation prediction<br />
(2.9 μg m -3 ), and closer to the observed values. Contrary to the LHVP site, in the sub<strong>urban</strong> site<br />
of SIRTA, the two simulations predict quite similar OA concentrations throughout the simulation<br />
period. At the GOLF site the 4x4 km simulation gives higher concentrations compared to the 36x36<br />
km run, and closer to the measurements, although an under-prediction is seen as with the summertime<br />
period. The use of the fine grid resolution in the model run seems to be much more necessary<br />
during the winter rather than the summer period in reproducing OA levels in the city center. The 2<br />
different horizontal grid resolutions produce almost identical sulfate concentrations at all sites during<br />
either the July or the January period. Figure 7 is an example of this behavior of the model,<br />
showing average diurnal profile of particulate sulfate at two sites during the summer period. Figure<br />
8 shows time series of elemental carbon concentrations (predicted vs. observed) at LHVP during<br />
both periods. In July the model captures the magnitude of observed values reproducing the majority<br />
(90%) of the hourly average data points within a factor of 2. In winter, however, the model predicted<br />
levels of EC show an overestimation of the peak values of elemental carbon during the rush<br />
hours, which is more pronounced in the 4x4 km grid resolution, indicating possible errors in the<br />
emission rates. Overall the model performance against high time resolution measurements of OA,<br />
EC and sulfate from a highly polluted Megacity seems encouraging.<br />
www.megapoli.info<br />
11
FP7 EC <strong>MEGAPOLI</strong> Project<br />
Figure 3: Ground-level concentration predictions of PMCAMx-2008 averaged over the entire simulation<br />
period (1-30 July 2009) for PM1 (a) total mass, (b) total organic aerosol, (c) elemental carbon, (d) sulfate,<br />
(e) ammonium and (f) nitrate (in μg m -3 ). Different scales are used.<br />
Figure 4: Ground-level concentration predictions of PMCAMx-2008 averaged over the entire simulation<br />
period (January 10 – February 10, 2010) for PM1 (a) total mass, (b) total organic aerosol, (c) elemental<br />
carbon, (d) sulfate, (e) ammonium and (f) nitrate (in μg m -3 ). Different scales are used.<br />
www.megapoli.info<br />
12
FP7 EC <strong>MEGAPOLI</strong> Project<br />
Figure 5: Comparison of PMCAMx-2008 model predictions with AMS measurements of PM1 OA (in μg m -3 )<br />
taken at LHVP, SIRTA and GOLF during the summer 2009 campaign in Paris.<br />
www.megapoli.info<br />
13
FP7 EC <strong>MEGAPOLI</strong> Project<br />
Figure 6: Comparison of PMCAMx-2008 model predictions with AMS measurements of PM1 OA (in μg m -3 )<br />
taken at LHVP, SIRTA and GOLF during the winter 2010 campaign in Paris.<br />
www.megapoli.info<br />
14
FP7 EC <strong>MEGAPOLI</strong> Project<br />
Figure 7: Average PMCAMx-2007 predicted diurnal profiles of PM1 sulfate (in μg m -3 ) in SIRTA and GOLF<br />
during the summer 2009 campaign in Paris. Model predictions are shown for high and low model resolution<br />
in the Paris area.<br />
Figure 8: Comparison of PMCAMx-2008 model predictions with measurements of elemental carbon (in μg<br />
m -3 ) taken at LHVP during the summer 2009 and winter 2010 campaign in Paris. Model predictions are<br />
shown for high (blue) and low (dashed black) model resolution in the Paris area.<br />
www.megapoli.info<br />
15
FP7 EC <strong>MEGAPOLI</strong> Project<br />
3.2 CHIMERE<br />
In the section, gas phase pollutants (NOx and O3) and particulate pollutants (black carbon (BC), sulfate<br />
(SO4 2- ), nitrate (NO3 - ), ammonium (NH4 + ) and organic aerosols (OA) simulated with the CHI-<br />
MERE model for the summer campaign are evaluated by comparisons with the measurements at 3<br />
ground measurement sites GOLF, LHVP and SIRTA. Simulated OA is also compared to airborne<br />
gas phase and aerosol measurements. Common statistical measures as bias (relative bias to the<br />
mean concentration from both the measurements and the model (RB)), root mean square error<br />
(RMSE), relative RMSE) and correlation coefficient for particulates are presented in Table 2 for the<br />
summer campaign.<br />
n mod mes<br />
100 ( V −V<br />
)<br />
RB = ∑ (1)<br />
mod mes<br />
n i=<br />
1 ⎛ V + V ⎞<br />
⎜<br />
⎟<br />
⎜<br />
⎟<br />
⎝<br />
2<br />
⎠<br />
n 1 mod mes 2<br />
RMSE = ∑ ( V −V<br />
)<br />
(2)<br />
n i=<br />
1<br />
where n is the number of observations and, V mod and V mes are the modeled and measured values, respectively.<br />
Table 2: Statics of model results comparing to measurements for BC, inorganic aerosols and organic aerosol<br />
in both PM1 and PM10 sections at GOLF, LHVP and SIRTA in summer.<br />
Statistic in<br />
PM1<br />
PM10<br />
summer 2009<br />
(µg m -3 )<br />
Bias (RB)<br />
RMSE (relative<br />
RMSE)<br />
R Bias (RB)<br />
RMSE (relative<br />
RMSE)<br />
R<br />
BC 1.96 (92%) 2.90 (136%) 0.48 2.07 (94.8%) 3.00 (137%) 0.51<br />
NO3 0.22 (50%) 0.95 (220.5%) 0.45 0.44 (80.9%) 1.11 (206.5%) 0.78<br />
GOLF<br />
SO4<br />
NH4<br />
0.40 (29.6%)<br />
0.14 (22%)<br />
1.06 (82.4%)<br />
0.54 (86.5%)<br />
0.44<br />
0.40<br />
0.97 (59.2%)<br />
0.40 (53.2)<br />
1.40 (85.8%)<br />
0.62 (82.2%)<br />
0.74<br />
0.81<br />
OA -1.61 (-58.8%)<br />
2.65 (96.8%) 0.70 -0.47 (-14.2%) 2.04 (61.7%) 0.79<br />
LHVP<br />
SIRTA<br />
www.megapoli.info<br />
BC 1.98 (88.5%) 2.81 (125.5%) 0.51 2.08 (91%) 2.95 (128.3%) 0.52<br />
NO3 0.02 (5.9%) 0.96 (231%) 0.54 0.23 (44.5) 0.82 (158%) 0.85<br />
SO4 0.26 (18.8%) 0.99 (70.9%) 0.44 0.83 (49.4%) 1.36 (81.4%) 0.70<br />
NH4 0.19 (34%) 0.56 (101.6%) 0.38 0.45 (65.4%) 0.62 (91.1%) 0.82<br />
OA<br />
-1.36 (-52.2%) 2.20 (84.0%) 0.74 -0.27 (-8.6%) 2.14 (67.6%) 0.76<br />
BC -0.29 (58.3%) 0.67 (136.1%) 0.34 -0.24 (-47.4%) 0.66 (128%) 0.36<br />
NO3 0.24 (79.4%) 0.64 (212%) 0.54 0.43 (108%) 1.04 (260%) 0.81<br />
SO4 0.60 (51.7%) 1.07 (92.6%) 0.26 1.16 (80.4%) 1.81 (126%) 0.37<br />
NH4 0.33 (70.5%) 0.48 (103.5%) 0.31 0.58 (98.2%) 0.85 (142.9%) 0.56<br />
OA<br />
-0.79 (-58.4%) 1.25 (92.1%) 0.81 -0.10 (-5.8%) 1.49 (82.7) 0.84<br />
3.2.1 Comparison for ground based sites<br />
Figure 9 shows the daily variation of NOx, BC and O3 at GOLF, LHVP and SIRTA, respectively,<br />
during summer. The simulated and measured peaks of NOx occur at about 8 a.m., while ozone<br />
peaks in late afternoon due to important photochemical production in the afternoon in summer.<br />
NOx values are overestimated with a bias (RB) of 6.1 (44.7%), 2.7 (14.6%) and 1.7 ppb (20.7%) at<br />
GOLF, LHVP and SIRTA, respectively. The O3 concentrations vary between 15 to 40 ppb. It anticorrelates<br />
with NOx and the RB at these three sites are all within 10%.<br />
16
FP7 EC <strong>MEGAPOLI</strong> Project<br />
The BC peaks are correlated with those of NOx, both pollutants being due to traffic emissions. The<br />
correlation coefficients between simulated and observed time series of BC at GOLF and LHVP are<br />
around 0.5 in summer. It is lower in SIRTA (~0.35). However, the daily variation of BC from simulation<br />
agrees well correlated with the measurements at SIRTA, but it is overestimated by a factor of<br />
two to three at GOLF and LHVP. This points to an overestimation in BC emissions in the <strong>urban</strong><br />
area. Inorganic aerosols are often overestimated up to a factor of two for the nitrate concentrations<br />
in PM10 at LHVP. However, the correlation coefficients are often around 0.7-0.8 at these three sites,<br />
except for sulfate and ammonium at SIRTA where they are only 0.37 and 0.56, respectively. Simulated<br />
OA is slightly underestimated in the model by no more than 15% in PM10 in the summer (Fig.<br />
10). Simulations captured almost all peaks for the summer campaign and the correlation coefficients<br />
are around 0.8. In particular the large OA peaks on July 16 and 21, due to long range transport of<br />
biogenic SOA (see <strong>MEGAPOLI</strong> Deliverable 3.5), are well captured, which is encouraging.<br />
Figure 9: Daily variation of NOx (red, in ppb), BC (black, shadow is the range of PM1 to PM10, in µgm -3 )<br />
and O3 (blue, in ppb) from model (lines) and measurement (starred) at GOLF (left), LHVP (middle) and<br />
SIRTA (right) in July 2009. The x axis is in local time.<br />
3.2.2 Simulations of the Paris <strong>urban</strong> plume<br />
The pollutants emitted in the Paris agglomeration have a local impact, such as POA, BC and NOx,<br />
etc. In addition, they may also have regional and continental impact when they form secondary pollutants<br />
such as inorganic aerosols, O3 and SOA during their transport away from the agglomeration.<br />
Fig. 11 gives a classical picture about ground surface OA concentration in the plume from Paris. On<br />
July 16th, a morning peak of OA was formed due to POA emissions and low boundary layer height<br />
and transported towards north-east. It disappeared at midday due to decrease of POA emissions and<br />
increase of PBL height. An OA plume is formed due to SOA production at 13h, in the north of Paris<br />
agglomeration and further transported towards north. The plume concentration reaches its highest<br />
values farther from Paris due to condensation of semivolatile VOC products formed by photochemical<br />
reactions in the afternoon. During evening and night northward transport and SOA formation<br />
continue. Therefore, although OA has a high value of about 13 µg m -3 in the morning in Paris<br />
related to local POA emissions, its highest value about (17 µg m -3 ) occurs during the early night at<br />
about 150 km north of the agglomeration, due to SOA build-up from anthropogenic VOC emissions<br />
in the Paris agglomeration and additional biogenic VOC showing enhanced emissions under the<br />
high temperatures prevailing in the afternoon of this day.<br />
3.2.3 Comparison between airborne observations and simulations<br />
AMS measurements from 8 flights are of good quality and are used for evaluation of the simulations.<br />
Here, as an example the flight N°30 on July 16 is analyzed. This day was cloudless with high<br />
temperature, and southerly winds. Large primary pollution peaks were observed in the <strong>urban</strong> area in<br />
www.megapoli.info<br />
17
FP7 EC <strong>MEGAPOLI</strong> Project<br />
the morning, due to low winds. The Paris <strong>urban</strong> pollution plume was found from measurements and<br />
in simulations as heading towards north of France, with slight differences (about 15° in the plume<br />
direction) (Fig. 12). Enhanced BC and nitrate concentrations were observed within the plume both<br />
in the models and from measurements, with somewhat larger values in the simulations. Scaling nitrate<br />
with BC as a primary pollution tracer to take into account plume dilution (not shown), indicates<br />
a NO3 build-up when the plume is moving away from Paris. Background sulfate concentrations<br />
are slightly overestimated in simulations (2.5 instead of 2 µg m -3 ). The production of sulfate<br />
was underestimated within the plume in simulations (about 0.5 µg m -3 compared to 1 µg m -3 observed).<br />
µg/m3<br />
µg/m3<br />
µg/m3<br />
Figure 10: Comparisons of modeled OA (PM1-PM10) from simulation (green) at GOLF (top), LHVP (middle)<br />
and SIRTA (bottom) and measurement (x in black) in summer. The green area shows the range of values<br />
for PM1 to PM10 aerosol which best corresponds to the PM1 observations, due uncertainty in the simulated<br />
particle size. All values are given in µg m -3 .<br />
Simulated background OA concentrations are about 1 µg m -3 lower than the observations (2–3 instead<br />
of 3 – 4 µg m -3 ). Highest concentrations were measured when the aircraft returned to the airport<br />
on the northwest of Paris agglomeration. Enhanced plume values increments for OA are larger<br />
in simulations than observed (about 2–3 instead of 1–2 µg m -3 ). OA build-up in the plume was more<br />
closely analysed. OA (POA+SOA) is plotted against Ox (NO2+O3) (Fig. 13). Ox is used here as a<br />
tracer of photochemical activity. The idea is that under polluted conditions both SOA and Ox are<br />
related to the oxidation of VOC. The slope of OA vs. Ox thus should indicate the accuracy of the<br />
representation of SOA formation in the model. From PMF analysis of the AMS measurements (Deliverable<br />
3.5), it appears that SOA related fractions are dominant with respect to POA. Thus in this<br />
analysis the more robust OA value is preferred to SOA. First, a good correlation of OA with Ox is<br />
observed both in simulations and observations (Fig. 13). The slope is 0.27 in the simulation compared<br />
to 0.13 in the observations. Thus the level of normalized SOA production in the Paris plume<br />
is thought to be correct within a factor of two. This is an encouraging result when considering the<br />
www.megapoli.info<br />
18
FP7 EC <strong>MEGAPOLI</strong> Project<br />
www.megapoli.info<br />
07h<br />
13h<br />
19h<br />
Figure 11: Simulated CHIMERE <strong>urban</strong> OA plume on July 16 at different times of the day. Surface OA mass<br />
concentrations are given in µg m -3 .<br />
µg/m3<br />
y = 0.13 x + 3.0<br />
y = 0.27 x + 12.2<br />
Figure 13: OA/Ox ratio from measurements (black) and simulations CHIMERE (green) for the flight on July<br />
16. The x-axis denotes Ox (O3+NO2) in ppb, the y-axis denotes OA in µg m -3 .<br />
10h<br />
16h<br />
22h<br />
ppb<br />
19
FP7 EC <strong>MEGAPOLI</strong> Project<br />
uncertainties of the SOA scheme of VBS approach, and when keeping in mind the traditional difficulty<br />
of models to simulate SOA formation.<br />
Figure 12: Comparisons of OA, nitrate, sulfate, ammonium, BC from measurement (left, with suffix m) and<br />
from the simulation with CHIMERE (right, with suffix v) for the flight on July 16. All values are given in µg<br />
m -3 .<br />
www.megapoli.info<br />
20
FP7 EC <strong>MEGAPOLI</strong> Project<br />
Acknowledgements<br />
The <strong>MEGAPOLI</strong> project is very thankful and acknowleges the Laboratoire d’Hygiène de Paris (LHVP), The<br />
SIRTA/IPSL, le Golf de la Poudrérie à Livry-Gargan for hosting campaign sites. Without this help, the campaign<br />
would not have been possible. Also University Paris-Est, Créteil, INRA/Gignon, Météo-France, Roissy<br />
and ENPC, Marne la Vallée are thanked to host lidar instruments. It is also grateful to all voluntary participants<br />
who made this campaign a great success.<br />
The research leading to these results has received funding from the European Union’s Seventh Framework<br />
Programme FP/2007-2011 within the project <strong>MEGAPOLI</strong>, grant agreement n°212520. In additions the project<br />
has been supported through the French ANR MEGAPARIS and LEFE- CHAT <strong>MEGAPOLI</strong>-FRANCE<br />
projects, and through an Ile de France SEPPE project.<br />
All contributions from the <strong>MEGAPOLI</strong> campaign team are acknowledged:<br />
• M. Beekmann 1 , U. Baltensperger 2 , A. Borbon 1 , J. Sciare 3 , V. Gros 3 , A. Baklanov 4 , M. Lawrence 5 , S.<br />
Pandis 6 , V.Kostenidou 6 , M.Psichoudaki 6 , L. Gomes 7 , P. Tulet 7 , A. Wiedensohler 8 , A. Held * , L. Poulain<br />
8 , K.Kamilli 8 , W. Birmli 8 , A. Schwarzenboeck 9 , K. Sellegri 9 , A. Colomb 9 , J.M. Pichon 9 , E.Fernay 9 ,<br />
J.L. Jaffrezo 10 , P. Laj 10 , C. Afif 1 , V. Ait-Helal 1 *, B. Aumont 1 , S. Chevailler 1 , P. Chelin 1 , I. Coll 1 , J.F.<br />
Doussin 1 , R. Durand-Jolibois 1 , H. Mac Leod 1 , V. Michoud 1 , K. Miet 1 , N. Grand 1 , S. Perrier 1 , H.<br />
Petetin 1 , T. Raventos 1 , C. Schmechtig 1 , G. Siour 1 , C. Viatte 1 , Q. Zhang 1 **, P. Chazette 3 , M. Bressi 3 ,<br />
M. Lopez 5 , P. Royer 3 , R. Sarda-Esteve 3 , F. Drewnick 5 , J. Schneider 5 , M. Brands 5 , S. Bormann 5 , K.<br />
Dzepina 5 , F. Freutel 5 , S. Gallavardin 5 , T. Klimach 5 , T. Marbach 5 , R. Shaiganfar 5 , S.L. Von der Weiden<br />
5 , T. Wagner 5 , S.Zorn 5 , P. De Carlo 2 , A. Prevot 2 , M. Crippa 2 , C. Mohr 2 , Marie Laborde 2 , M.<br />
Gysel 2 , Roberto Chirico 2 , Maarten Heringa 2 , A. Butet 11 , A. Bourdon 11 , E. Mathieu 11 , T. Perrin 11 ,<br />
SAFIRE team, J.Wenger 12 , R. Healy 12 , I.O. Connor 12 , E. Mc Gillicuddy 12 , P. Alto 13 , J.P.Jalkanen 13 ,<br />
M. Kulmala 13 , P Lameloise 14 , V. Ghersi 14 , O. Sanchez 14 , A. Kauffman 14 , H. Marfaing 14 , C. Honoré 14 ,<br />
L. Chiappini 15 , O. Favez 15 , F. Melleux 15 , G. Aymoz 15 , B. Bessagnet 15 , L. Rouil 15 , S. Rossignol 15 , M.<br />
Haeffelin 16 , C. Pietras 16 , J. C. Dupont 16 , and the SIRTA team, S. Kukui 17 , E. Dieudonné 17 , F. Ravetta<br />
17 , J.C.Raut 17 ,G. Ancellet 17, F. Goutail 17 , J.L Besombes 18 , N. Marchand 19 , Y. Le Moullec 20 , J.<br />
Cuesta 21 , Y. Té 22 , N. Laccoge 23 , S. Lolli 24 , L. Sauvage 24 , S.Loannec 24 , D. Ptak 25 , A. Schmidt 25 , S.<br />
Conil 26 , M. Boquet 27 ,<br />
1 Laboratoire InterUniversitaire des Systèmes Atmosphériques (LISA), Université Paris Est et 7, CNRS, Créteil,<br />
France, 2 Paul Scherrer Institut, Villigen, Switzerland, 3 Laboratoire des Sciences du Climat et de<br />
l’Environnement (LSCE), Gif sur Yvette, France, 4 Danish Meteorological Institute, Copenhagen, Denmark,<br />
5 Max-Planck-Institute for Chemistry, Mainz, Germany, 6 Foundation for Research and Technology, Hellas,<br />
University of Patras, Greece, 7 Game,Centre National de Recherche Météorologique, Toulouse , France ,<br />
8 Institut für Troposphärenforschung, Leipzig, Germany, 9 Laboratoire de Météorologie Physique, Clermont-<br />
Ferrand, France, 10 Laboratoire de Glaciologie et Géophysique de l’Environnement, Grenoble, France ,<br />
11 SAFIRE, Toulouse, France, 12 University College Cork, Ireland, 13 University of Helsinki, Finland ,<br />
14 AIRPARIF, Paris, France, 15 INERIS, France, , 16 SIRTA/IPSL, Palaiseau, France, 17 Laboratoire Atmosphères,<br />
Milieux, Observations Spatiales, Paris, France, , 18 Laboratoire de Chimie Moléculaire et Environnement,<br />
Chambery, France, 19 Laboratoire de Chimie Provence, Marseille, France, 20 Laboratoire de l’Hygiène de la<br />
Ville de Paris, France,, 21 Laboratorie de Météorologie Dynamique, Palaiseau, France , 22 Laboratorie de Physique<br />
Moléculaire pour l'Atmosphère et l'Astrophysique, 23 Département Environnement et Chimie, Ecole de<br />
Mines de Douais, France, , 24 LEOSPHERE, France, 25 Universität Duisburg-Essen), Germany, 26 ANDRA,<br />
Châtenay-Malabry, France, 27 CEREA, Marne La Vallée, France ,**also ARIA-Technologie. France<br />
www.megapoli.info<br />
21
FP7 EC <strong>MEGAPOLI</strong> Project<br />
References<br />
Andreae, M. O. and Crutzen, P. J.: Atmospheric aerosols: biogeochemical sources and role in atmospheric<br />
chemistry, Science, 276, 1052-1058, 1997.<br />
Atkinson, R. and Arey, J.: Atmospheric degradation of volatile organic compounds, Chem. Rev., 103, 4605-<br />
4638, 2003.<br />
Beekmann, M., and Derognat, C., Monte Carlo uncertainty analysis of a regional scale transport chemistry<br />
model constrained by Measurements from the Esquif campaign, J. Geophys. Res., 108, 8559,<br />
doi:10.1029/2003JD003391, 2003.<br />
Bessagnet , B., Hodzic A., Vautard R., Beekmann M., Cheinet S., Honoré C., Liousse C., Rouil L., Aerosol<br />
modelling with Chimere - Preliminary evaluation at the continental scale, Atmos. Environ., 38, 2803-<br />
2817, 2004.<br />
Bessagnet, B., Menut, L., Curci, G., Hodzic, A., Guillaume, B., Liousse, C., Moukhtar, S., Pun, B., Seigneur<br />
C., and Schulz, M., Regional modeling of carbonaceous aerosols over Europe - focus on secondary organic<br />
aerosols, J. Atmos. Chem., 61, 175-202, 2008.<br />
Capaldo, K. P., Pilinis, C., and Pandis, S. N.: A computationally efficient hybrid approach for dynamic<br />
gas/aerosol transfer in air quality models, Atmos. Environ., 34, 3617-3627, 2000.<br />
Carter, W. P. L.: Programs and Files Implementing the SAPRC-99 Mechanism and its Associates <strong>Emissions</strong><br />
Processing Procedures for Models-3 and Other Regional Models:<br />
http://pah.cert.ucr.edu/~carter/SAPRC99.htm, last access: 31 January 2000.<br />
Donahue, N. M., Robinson, A. L., Stanier, C. O., and Pandis, S. N.: Coupled partitioning, dilution, and<br />
chemical aging of semivolatile organics. Environ. Sci. Technol., 40, 2635-2643, 2006.<br />
ENVIRON: User's Guide to the Comprehensive Air Quality Model with Extensions (CAMx), Version 4.02,<br />
Report, ENVIRON Int. Corp., Novato, Calif. Available at: http://www.camx.com, 2003.<br />
Fahey, K. and Pandis, S. N.: Optimizing model performance: variable size resolution in cloud chemistry<br />
modeling, Atmos. Environ., 35, 4471–4478, 2001.<br />
Farina, S. C., Adams, P. J., and Pandis, S. N.: Modeling global secondary organic aerosol formation and<br />
processing with the volatility basis set: Implications for anthropogenic secondary organic aerosol, J.<br />
Geophys. Res., 115, D09202, doi:10.1029/2009JD013046, 2010.<br />
Friedrich, R., GENEMIS: assessment, improvement, temporal and spatial disaggregation of European emission<br />
data. In: Ebel, A., Friedrich, R., Rhode, H. (Eds.), Tropospheric Modelling and Emission Estimation,<br />
Part 2. Springer, New York, pp. 181-214, 1997.<br />
Gaydos, T., Koo, B., and Pandis, S. N.: Development and application of an efficient moving sectional approach<br />
for the solution of the atmospheric aerosol condensation/evaporation equations. Atmos. Environ.,<br />
37, 3303-3316, 2003.<br />
Guenther, A., Karl, T., Harley, P., Wiedinmyer, C., Palmer, P. I., and Geron, C., Estimates of global terrestrial<br />
isoprene emissions using MEGAN (Model of <strong>Emissions</strong> of Gases and Aerosols from Nature), Atmos.<br />
Chem. Phys., 6, 3181-3210, 2006.<br />
Hildebrandt, L., Donahue, N. M., and Pandis, S. N.: High formation of secondary organic aerosol from the<br />
photo-oxidation of toluene, Atmos. Chem. Phys., 9, 2973-2986, 2009.<br />
Jayne, J. T., Leard, D. C., Zhang, X. F., Davidovits, P., Smith, K.A., Kolb, C.E., Worsnop, D.R.: Development<br />
of an aerosol mass spectrometer for size and composition analysis of submicron particles, Aerosol<br />
Sci. Tech., 33, 49-70, 2000.<br />
Junker C. and Liousse C., "A global emission inventory of carbonaceous aerosol from historic records of<br />
fossil fuel and biofuel consumption for the period 1860–1997", Atmos. Chem. and Phys., 8, 1207, 2008.<br />
Kanakidou, M., Seinfeld, J. H., Pandis, S. N., Barnes, I., et al.: Organic aerosol and global climate modeling:<br />
a review, Atmos. Chem. Phys., 5, 1053-1123, 2005.<br />
Karydis, V. A., Tsimpidi, A. P., Fountoukis, C., Nenes A., Zavala, M., Lei, W., Molina, L. T., and Pandis, S.<br />
N.: Simulating the fine and coarse inorganic particulate matter concentrations in a polluted megacity,<br />
Atmos. Environ., 44, 608-620, 2010.<br />
Koo, B., Pandis, S. N., and Ansari, A.: Integrated approaches to modeling the organic and inorganic atmospheric<br />
aerosol components, Atmos. Environ., 37, 4757-4768, 2003.<br />
Lane, T. E., Donahue, N. M., and Pandis, S. N.: Simulating secondary organic aerosol formation using the<br />
volatility basis-set approach in a chemical transport model, Atmos. Environ., 42, 7439-7451, 2008a.<br />
Lane, T. E., Donahue, N. M., and Pandis, S. N.: Effect of NOx on secondary organic aerosol concentrations,<br />
Environ. Sci. Technol., 42, 6022-6027, 2008b.<br />
Lattuati, M., Contribution à l’étude du bilan de l’ozone troposphérique à l’interface de l’Europe et de<br />
www.megapoli.info<br />
22
FP7 EC <strong>MEGAPOLI</strong> Project<br />
l’Atlantique Nord: Modélisation lagrangienne et mesures en altitude, Ph.D. Thesis, Univ. Pierre et<br />
Marie Curie, Paris, France, 1997.<br />
Murphy, B. N. and Pandis, S. N.: Simulating the formation of semivolatile primary and secondary organic<br />
aerosol in a regional chemical transport model, Environ. Sci. Technol., 43, 4722-4728, 2009.<br />
Nenes, A., Pandis, S. N., and Pilinis, C.: ISORROPIA: a new thermodynamic equilibrium model for multiphase<br />
multicomponent inorganic aerosols, Aquatic Geochemistry, 4, 123-152, 1998.<br />
Ng, N. L., Kroll, J. H., Keywood, M. D., Bahreini, R., Varutbangkul, V., Flagan, R. C., and Seinfeld, J. H.:<br />
Contribution of first- versus second-generation products to secondary organic aerosols formed in the<br />
oxidation of biogenic hydrocarbons, Environ. Sci. Technol., 40, 2283-2297, 2006.<br />
O’Dowd, C. D., Langmann, B., Varghese, S., Scannell, C., Ceburnis, D., and Facchini, M. C.: A Combined<br />
Organic-Inorganic Sea-Spray Source Function, Geophys. Res. Lett., 35, L01801,<br />
doi:10.1029/2007GL030331, 2008.<br />
Paatero, P. and Tapper, U.: Positive matrix factorization: a nonnegative factor model with optimal utilization<br />
of error estimates of data values, Environmetrics, 5, 111-126, 1994.<br />
Paatero, P.: Least squares formulation of robust non-negative factor analysis, Chemometr. Intell. Lab., 37,<br />
23-35, 1997.<br />
Pandis, S. N., Wexler, A. S., and Seinfeld, J. H.: Secondary organic aerosol formation and transport. 2. Predicting<br />
the ambient secondary organic aerosol size distribution, Atmos. Environ., 27A, 2403-2416,<br />
1993.<br />
Pilinis, C., Capaldo, K. P., Nenes, A., and Pandis, S. N.: MADM - a new multicomponent aerosol dynamics<br />
model. Aerosol Science and Technology 32, 482–502, 2000.<br />
Pun, B., Seigneur, C., and Lohman, K., Modeling secondary organic aerosol via multiphase partitioning with<br />
molecular data, Environ. Sci. Technol. 40, 4722-4731, 2006.<br />
Roberts, G. C., Andreae, M. O., Zhou, J., and Artaxo, P.: Cloud condensation nuclei in the Amazon Basin:<br />
“Marine” conditions over a continent?, Geophys. Res. Lett., 28(14), 2807-2810, 2001.<br />
Robinson, A. L., Donahue, N. M., Shrivastava, M. K., Weitkamp, E. A., Sage, A. M., Grieshop, A. P., Lane, T.<br />
E., Pierce, J. R., Pandis, S. N.: Rethinking organic aerosol: semivolatile emissions and photochemical<br />
aging, Science, 315, 1259-1262, 2007.<br />
Shrivastava, M. K., Lane, T. E., Donahue, N. M., Pandis, S.N., and Robinson, A. L.: Effects of gas-particle<br />
partitioning and aging of primary emissions on <strong>urban</strong> and regional organic aerosol concentrations, J.<br />
Geophys. Res., 113, D18301, doi:10.1029/2007JD009735, 2008.<br />
Skamarock, W. C., Klemp, J. B., Dudhia, J., Gill, D. O., Barker, D. M., Wang, W., and Powers, J. G.: A Description<br />
of the Advanced Research WRF Version 2, NCAR Technical Note<br />
(http://www.mmm.ucar.edu/wrf/users/docs/arw_v2.pdf), 2005.<br />
Takegawa, N., Miyazaki, Y., Kondo, Y., Komazaki, Y., Miyakawa, T., Jimenez, J. L., Jayne, J. T., Worsnop,<br />
D. R., Allan, J. D., and Weber, R. J.: Characterization of an Aerodyne Aerosol Mass Spectrometer<br />
(AMS): Intercomparison with other aerosol instruments, Aerosol Sci. Tech., 39 (8), 760-770, 2005.<br />
Tsimpidi, A. P., Karydis, V. A., Zavala, M., Lei, W., Molina, L., Ulbrich, I. M., Jimenez, J. L., and Pandis, S.<br />
N.: Evaluation of the volatility basis-set approach for the simulation of organic aerosol formation in the<br />
Mexico City metropolitan area, Atmos. Chem. Phys., 10, 525-546, 2010.<br />
Zhang, Q., Canagaratna, M. C., Jayne, J. T., Worsnop, D. R., and Jimenez, J. L: Time and size-resolved<br />
chemical composition of submicron particles in Pittsburgh Implications for aerosol sources and processes,<br />
J. Geophys. Res., 110, D07S09, doi:10.1029/2004JD004649, 2005a.<br />
Zhang, Q., Worsnop, D. R., Canagaratna, M. R., and Jimenez, J. L.: Hydrocarbon-like and oxygenated organic<br />
aerosols in Pittsburgh: insights into sources and processes of organic aerosols, Atmos. Chem.<br />
Phys., 5, 3289-3311, 2005b.<br />
www.megapoli.info<br />
23
FP7 EC <strong>MEGAPOLI</strong> Project<br />
Previous <strong>MEGAPOLI</strong> reports<br />
Previous reports from the FP7 EC <strong>MEGAPOLI</strong> Project can be found at:<br />
http://www.megapoli.info/<br />
Collins W.J. (2009): Global radiative forcing from megacity emissions of long-lived greenhouse<br />
gases. Deliverable 6.1, <strong>MEGAPOLI</strong> Scientific Report 09-01, 17p, <strong>MEGAPOLI</strong>-01-REP-2009-<br />
10, ISBN: 978-87-992924-1-7<br />
http://megapoli.dmi.dk/publ/<strong>MEGAPOLI</strong>_sr09-01.pdf<br />
Denier van der Gon, HAC, AJH Visschedijk, H. van der Brugh, R. Dröge, J. Kuenen (2009): A base<br />
year (2005) <strong>MEGAPOLI</strong> European gridded emission inventory (1st version). Deliverable 1.2,<br />
<strong>MEGAPOLI</strong> Scientific Report 09-02, 17p, <strong>MEGAPOLI</strong>-02-REP-2009-10, ISBN: 978-87-<br />
992924-2-4<br />
http://megapoli.dmi.dk/publ/<strong>MEGAPOLI</strong>_sr09-02.pdf<br />
Baklanov A., Mahura A. (Eds) (2009): First Year <strong>MEGAPOLI</strong> Dissemination Report. Deliverable<br />
9.4.1, <strong>MEGAPOLI</strong> Scientific Report 09-03, 57p, <strong>MEGAPOLI</strong>-03-REP-2009-12, ISBN: 978-<br />
87-992924-3-1<br />
http://megapoli.dmi.dk/publ/<strong>MEGAPOLI</strong>_sr09-03.pdf<br />
Allen L., S Beevers, F Lindberg, Mario Iamarino, N Kitiwiroon, CSB Grimmond (2010): Global to<br />
City Scale Urban Anthropogenic Heat Flux: Model and Variability. Deliverable 1.4, MEGA-<br />
POLI Scientific Report 10-01, <strong>MEGAPOLI</strong>-04-REP-2010-03, 87p, ISBN: 978-87-992924-4-8<br />
http://megapoli.dmi.dk/publ/<strong>MEGAPOLI</strong>_sr10-01.pdf<br />
Pauli Sievinen, Antti Hellsten, Jaan Praks, Jarkko Koskinen, Jaakko Kukkonen (2010): Urban Morphological<br />
Database for Paris, France. Deliverable D2.1, <strong>MEGAPOLI</strong> Scientific Report 10-02,<br />
<strong>MEGAPOLI</strong>-05-REP-2010-03, 13p, ISBN: 978-87-992924-5-5<br />
http://megapoli.dmi.dk/publ/<strong>MEGAPOLI</strong>_sr10-02.pdf<br />
Moussiopoulos N., Douros J., Tsegas G. (Eds.) (2010): Evaluation of Zooming Approaches Describing<br />
Multiscale Physical Processes. Deliverable D4.1, <strong>MEGAPOLI</strong> Scientific Report 10-<br />
03, <strong>MEGAPOLI</strong>-06-REP-2010-01, 41p, ISBN: 978-87-992924-6-2<br />
http://megapoli.dmi.dk/publ/<strong>MEGAPOLI</strong>_sr10-03.pdf<br />
Mahura A., Baklanov A. (Eds.) (2010): Hierarchy of Urban Canopy Parameterisations for Different<br />
Scale Models. Deliverable D2.2, <strong>MEGAPOLI</strong> Scientific Report 10-04, <strong>MEGAPOLI</strong>-07-REP-<br />
2010-03, 50p, ISBN: 978-87-992924-7-9<br />
http://megapoli.dmi.dk/publ/<strong>MEGAPOLI</strong>_sr10-04.pdf<br />
Dhurata Koraj, Spyros N. Pandis (2010): Evaluation of Zooming Approaches Describing Multiscale<br />
Chemical Transformations. Deliverable D4.2, <strong>MEGAPOLI</strong> Scientific Report 10-05,<br />
<strong>MEGAPOLI</strong>-08-REP-2010-01, 29p, ISBN: 978-87-992924-8-6<br />
http://megapoli.dmi.dk/publ/<strong>MEGAPOLI</strong>_sr10-05.pdf<br />
Igor Esau (2010): Urbanized Turbulence-Resolving Model and Evaluation for Paris. Deliverable<br />
D2.4.1, <strong>MEGAPOLI</strong> Scientific Report 10-06, <strong>MEGAPOLI</strong>-09-REP-2010-03, 20p, ISBN: 978-<br />
87-992924-9-3<br />
http://megapoli.dmi.dk/publ/<strong>MEGAPOLI</strong>_sr10-06.pdf<br />
Grimmond CSB., M. Blackett, M.J. Best, et al. (2010): Urban Energy Balance Models Comparison.<br />
Deliverable D2.3, <strong>MEGAPOLI</strong> Scientific Report 10-07, <strong>MEGAPOLI</strong>-10-REP-2010-03, 72p,<br />
ISBN: 978-87-993898-0-3<br />
http://megapoli.dmi.dk/publ/<strong>MEGAPOLI</strong>_sr10-07.pdf<br />
Gerd A. Folberth, Steve Rumbold, William J. Collins, Tim Butler (2010): Determination of Radia-<br />
www.megapoli.info<br />
24
FP7 EC <strong>MEGAPOLI</strong> Project<br />
tive Forcing from Megacity <strong>Emissions</strong> on the Global Scale. Deliverable D6.2, <strong>MEGAPOLI</strong><br />
Scientific Report 10-08, <strong>MEGAPOLI</strong>-11-REP-2010-03, 19p, ISBN: 978-87-993898-1-0<br />
http://megapoli.dmi.dk/publ/<strong>MEGAPOLI</strong>_sr10-08.pdf<br />
Thomas Wagner, Steffen Beirle, Reza Shaiganfar (2010): Characterization of Megacity Impact on<br />
Regional and Global Scales Using Satellite Data. Deliverable D5.1, <strong>MEGAPOLI</strong> Scientific<br />
Report 10-09, <strong>MEGAPOLI</strong>-12-REP-2010-03, 25p, ISBN: 978-87-993898-2-7<br />
http://megapoli.dmi.dk/publ/<strong>MEGAPOLI</strong>_sr10-09.pdf<br />
Baklanov A., Mahura A. (Eds.) (2010): Interactions between Air Quality and Meteorology, Deliverable<br />
D4.3, <strong>MEGAPOLI</strong> Scientific Report 10-10, <strong>MEGAPOLI</strong>-13-REP-2010-03, 48p, ISBN:<br />
978-87-993898-3-4<br />
http://megapoli.dmi.dk/publ/<strong>MEGAPOLI</strong>_sr10-10.pdf<br />
Baklanov A. (Ed.) (2010): Framework for Integrating Tools. Deliverable D7.1, <strong>MEGAPOLI</strong> Scientific<br />
Report 10-11, <strong>MEGAPOLI</strong>-14-REP-2010-03, 68p, ISBN: 978-87-993898-4-1<br />
http://megapoli.dmi.dk/publ/<strong>MEGAPOLI</strong>_sr10-11.pdf<br />
Sofiev M., Prank M., Vira J., and <strong>MEGAPOLI</strong> Modelling Teams (2010): Provision of global and<br />
regional concentrations fields from initial baseline runs. Deliverable D5.2, <strong>MEGAPOLI</strong> Technical<br />
Note 10-12, <strong>MEGAPOLI</strong>-15-REP-2010-03, 10p.<br />
http://megapoli.dmi.dk/publ/<strong>MEGAPOLI</strong>_sr10-12.pdf<br />
H.A.C. Denier van der Gon, J. Kuenen, T. Butler (2010): A Base Year (2005) <strong>MEGAPOLI</strong> Global<br />
Gridded Emission Inventory (1st Version). Deliverable D1.1, <strong>MEGAPOLI</strong> Scientific Report<br />
10-13, <strong>MEGAPOLI</strong>-16-REP-2010-06, 20p, ISBN: 978-87-993898-5-8<br />
http://megapoli.dmi.dk/publ/<strong>MEGAPOLI</strong>_sr10-13.pdf<br />
Lawrence M. G., Butler T. M., Collins W., Folberth G., Zakey A., Giorgi F. (2010): Meteorological<br />
Fields for Present and Future Climate Conditions. Deliverable D6.5, <strong>MEGAPOLI</strong> Technical<br />
Note 10-14, <strong>MEGAPOLI</strong>-17-REP-2010-09, 9p.<br />
http://megapoli.dmi.dk/publ/<strong>MEGAPOLI</strong>_sr10-14.pdf<br />
Beekmann M., Baltensperger U., and the <strong>MEGAPOLI</strong> campaign team (2010): Database of Chemical<br />
Composition, Size Distribution and Optical Parameters of Urban and Sub<strong>urban</strong> PM and its<br />
Temporal Variability (Hourly to Seasonal). Deliverable D3.1, <strong>MEGAPOLI</strong> Scientific Report<br />
10-15, <strong>MEGAPOLI</strong>-18-REP-2010-10, 21p, ISBN: 978-87-993898-6-5<br />
http://megapoli.dmi.dk/publ/<strong>MEGAPOLI</strong>_sr10-15.pdf<br />
Beekmann M., Baltensperger U., and the <strong>MEGAPOLI</strong> campaign team (2010): Database of the Impact<br />
of Megacity <strong>Emissions</strong> on Regional Scale PM Levels. Deliverable D3.4, <strong>MEGAPOLI</strong><br />
Scientific Report 10-16, <strong>MEGAPOLI</strong>-19-REP-2010-10, 29p, ISBN: 978-87-993898-7-2<br />
http://megapoli.dmi.dk/publ/<strong>MEGAPOLI</strong>_sr10-16.pdf<br />
Kuenen J., H. Denier van der Gon, A. Visschedijk, H. van der Brugh, S. Finardi, P. Radice, A.<br />
d’Allura, S. Beevers, J. Theloke, M. Uz-basich, C. Honoré, O. Perrussel (2010): A Base Year<br />
(2005) <strong>MEGAPOLI</strong> European Gridded Emission Inventory (Final Version). Deliverable D1.6,<br />
<strong>MEGAPOLI</strong> Scientific Report 10-17, <strong>MEGAPOLI</strong>-20-REP-2010-10, 37p, ISBN: 978-87-<br />
993898-8-9<br />
http://megapoli.dmi.dk/publ/<strong>MEGAPOLI</strong>_sr10-17.pdf<br />
Karppinen A., Kangas L., Riikonen K., Kukkonen J., Soares J., Denby B., Cassiani M., Finardi S.,<br />
Radice P., (2010): Evaluation of Methodologies for Exposure Analysis in Urban Areas and<br />
Application to Selected <strong>Megacities</strong>. Deliverable D4.4, <strong>MEGAPOLI</strong> Scientific Report 10-18,<br />
<strong>MEGAPOLI</strong>-21-REP-2010-11, 29p, ISBN: 978-87-993898-9-6<br />
http://megapoli.dmi.dk/publ/<strong>MEGAPOLI</strong>_sr10-18.pdf<br />
Soares J., A. Karppinen, B. Denby, S. Finardi, J. Kukkonen, M. Cassiani, P. Radice, M.Williams<br />
www.megapoli.info<br />
25
FP7 EC <strong>MEGAPOLI</strong> Project<br />
(2010): Exposure Maps for Selected <strong>Megacities</strong>. Deliverable D4.5, <strong>MEGAPOLI</strong> Scientific Report<br />
10-19, <strong>MEGAPOLI</strong>-22-REP-2010-11, 26p, ISBN: 978-87-92731-00-5<br />
http://megapoli.dmi.dk/publ/<strong>MEGAPOLI</strong>_sr10-19.pdf<br />
Rumbold S.T., W.J. Collins, G.A. Folberth (2010): Comparison of Coupled and Uncoupled Models.<br />
Deliverable D6.4, <strong>MEGAPOLI</strong> Scientific Report 10-20, <strong>MEGAPOLI</strong>-23-REP-2010-11, 15p,<br />
ISBN: 978-87-92731-01-2<br />
http://megapoli.dmi.dk/publ/<strong>MEGAPOLI</strong>_sr10-20.pdf<br />
Baklanov A., Mahura A. (Eds) (2010): Second Year <strong>MEGAPOLI</strong> Dissemination Report. Deliverable<br />
D9.4.2, <strong>MEGAPOLI</strong> Scientific Report 10-21, <strong>MEGAPOLI</strong>-24-REP-2010-12, 89p, ISBN:<br />
978-87-92731-02-9<br />
http://megapoli.dmi.dk/publ/<strong>MEGAPOLI</strong>_sr10-21.pdf<br />
Moussiopoulos N., Douros J., Tsegas G. (Eds) (2010): Evaluation of Source Apportionment Methods.<br />
Deliverable D4.6, <strong>MEGAPOLI</strong> Scientific Report 10-22, <strong>MEGAPOLI</strong>-25-REP-2010-12,<br />
54p, ISBN: 978-87-92731-03-6<br />
http://megapoli.dmi.dk/publ/<strong>MEGAPOLI</strong>_sr10-22.pdf<br />
Theloke J., M.Blesl, D. Bruchhof, T.Kampffmeyer, U. Kugler, M. Uzbasich, K. Schenk, H. Denier<br />
van der Gon, S. Finardi, P. Radice, R. S. Sokhi, K. Ravindra, S. Beevers, S. Grimmond, I.<br />
Coll, R. Frie-drich, D. van den Hout (2010): European and megacity baseline scenarios for<br />
2020, 2030 and 2050. Deliverable D1.3, <strong>MEGAPOLI</strong> Scientific Report 10-23, <strong>MEGAPOLI</strong>-<br />
26-REP-2010-12, 57p, ISBN: 978-87-92731-04-3<br />
http://megapoli.dmi.dk/publ/<strong>MEGAPOLI</strong>_sr10-23.pdf<br />
Galmarini S., Vinuesa J.F., Cassiani M., Denby B., Martilli A., (2011): Evaluation of Sub-Grid<br />
Models with Interactions between Turbulence and Urban Chemistry. Recommendations for<br />
Emission Inventories Improvement. Deliverable D2.6, <strong>MEGAPOLI</strong> Scientific Report 11-01,<br />
<strong>MEGAPOLI</strong>-27-REP-2011-01, 41p, ISBN: 978-87-92731-05-0<br />
http://megapoli.dmi.dk/publ/<strong>MEGAPOLI</strong>_sr11-01.pdf<br />
Butler T., H.A.C. Denier van der Gon, J. Kuenen (2011): The Base Year (2005) Global Gridded<br />
Emission Inventory used in the EU FP7 Project <strong>MEGAPOLI</strong> (Final Version). Deliverable<br />
D1.5, <strong>MEGAPOLI</strong> Scientific Report 11-02, <strong>MEGAPOLI</strong>-28-REP-2011-01, 27p, 978-87-<br />
92731-06-7<br />
http://megapoli.dmi.dk/publ/<strong>MEGAPOLI</strong>_sr11-02.pdf<br />
Schlünzen K.H., M. Haller (Eds) (2011): Evaluation of Integrated Tools. Deliverable D7.2 MEGA-<br />
POLI Scientific Report 11-03, <strong>MEGAPOLI</strong>-29-REP-2011-03, 50p, 978-87-92731-07-4<br />
http://megapoli.dmi.dk/publ/<strong>MEGAPOLI</strong>_sr11-03.pdf<br />
Sofiev M., M. Prank, J. Kukkonen (Eds) (2011): Evaluation and Improvement of Regional Model<br />
Simulations for Megacity Plumes. Deliverable D5.3, <strong>MEGAPOLI</strong> Scientific Report 11-04,<br />
<strong>MEGAPOLI</strong>-30-REP-2011-03, 88p, 978-87-92731-08-1<br />
http://megapoli.dmi.dk/publ/<strong>MEGAPOLI</strong>_sr11-04.pdf<br />
Baltensperger U., Beekmann M., and the <strong>MEGAPOLI</strong> campaign team (2011): Source Apportionment<br />
of Major Urban Aerosol Components Including Primary and Secondary PM Sources.<br />
Deliverable D3.2, <strong>MEGAPOLI</strong> Scientific Report 11-05, <strong>MEGAPOLI</strong>-31-REP-2011-05, 20p,<br />
ISBN: 978-87-92731-09-8<br />
http://megapoli.dmi.dk/publ/<strong>MEGAPOLI</strong>_sr11-05.pdf<br />
Kampffmeyer T., U. Kugler, M. Uzbasich, J. Theloke, R. Friedrich, D. van den Hout (2011): Short,<br />
Medium and Long Term Abatement and Mitigation Strategies for <strong>Megacities</strong>. Deliverable<br />
D8.1, <strong>MEGAPOLI</strong> Scientific Report 11-06, <strong>MEGAPOLI</strong>-32-REP-2011-05, 40p, ISBN: 978-<br />
87-92731-10-4<br />
http://megapoli.dmi.dk/publ/<strong>MEGAPOLI</strong>_sr11-06.pdf<br />
www.megapoli.info<br />
26
FP7 EC <strong>MEGAPOLI</strong> Project<br />
Folberth G.A., S. Rumbold, W.J. Collins, T. Butler (2011): Regional and Global Climate Changes<br />
due to <strong>Megacities</strong> using Coupled and Uncoupled Models. Deliverable D6.6, <strong>MEGAPOLI</strong> Scientific<br />
Report 11-07, <strong>MEGAPOLI</strong>-33-REP-2011-06, 18p, ISBN: 978-87-92731-11-1<br />
http://megapoli.dmi.dk/publ/<strong>MEGAPOLI</strong>_sr11-07.pdf<br />
Petetin H., M. Beekmann, V. Michoud, A. Borbon, J.-F. Doussin, A. Colomb, A. Schwarzenboeck,<br />
H. Denier van der Gon, C. Honore, A. Wiedensohler, U. Baltensperger, and the <strong>MEGAPOLI</strong><br />
Campaign Team (2011): Effective Emission Factors for OC and BC for Urban Type <strong>Emissions</strong>.<br />
Deliverable D3.3, <strong>MEGAPOLI</strong> Scientific Report 11-08, <strong>MEGAPOLI</strong>-34-REP-2011-06,<br />
30p, ISBN: 978-87-92731-12-8<br />
http://megapoli.dmi.dk/publ/<strong>MEGAPOLI</strong>_sr11-08.pdf<br />
Folberth G.A., S. Rumbold, W.J. Collins, T. Butler (2011): Estimate of Megacity Impacts in a Future<br />
Climate. Deliverable D5.7, <strong>MEGAPOLI</strong> Scientific Report 11-09, <strong>MEGAPOLI</strong>-35-REP-<br />
2011-06, 21p, ISBN: 978-87-92731-13-5<br />
http://megapoli.dmi.dk/publ/<strong>MEGAPOLI</strong>_sr11-09.pdf<br />
Eckhardt S., M. Cassiani, A. Stohl (2011): Influence of North American <strong>Megacities</strong> on European<br />
Atmospheric Composition. Deliverable D5.6, <strong>MEGAPOLI</strong> Scientific Report 11-10, MEGA-<br />
POLI-36-REP-2011-06, 28p, ISBN: 978-87-92731-14-2<br />
http://megapoli.dmi.dk/publ/<strong>MEGAPOLI</strong>_sr11-10.pdf<br />
Cassiani M., Stohl S., Eckhardt S., Sovief M., Prank M., Butler T., Lawrence M., Collins W.J., Folberth<br />
G.A., Rumbold S., Pyle J.A., Russo M.R., Stock Z., Siour G., Coll I., D’Allura A., Finardi<br />
S., Radice P., Silibello C. (2011): Prediction of <strong>Megacities</strong> Impact on Regional and<br />
Global Atmospheric Composition. Deliverable D5.4, <strong>MEGAPOLI</strong> Scientific Report 11-11,<br />
<strong>MEGAPOLI</strong>-37-REP-2011-06, 55p, ISBN: 978-87-92731-15-9<br />
http://megapoli.dmi.dk/publ/<strong>MEGAPOLI</strong>_sr11-11.pdf<br />
Sofiev M., M. Prank, A. Baklanov (Eds) (2011): Influence of Regional Scale <strong>Emissions</strong> on<br />
Megacity Air Quality. Deliverable D5.5, <strong>MEGAPOLI</strong> Scientific Report 11-12, <strong>MEGAPOLI</strong>-<br />
38-REP-2011-06, 60p, ISBN: 978-87-92731-16-6<br />
http://megapoli.dmi.dk/publ/<strong>MEGAPOLI</strong>_sr11-12.pdf<br />
Hannukainen M., de Leeuw G., Collins W.J. (2011): Comparison of Measured and Modeled Radiative<br />
Effects. Deliverable D6.3, <strong>MEGAPOLI</strong> Scientific Report 11-13, <strong>MEGAPOLI</strong>-39-REP-<br />
2011-08, 22p, ISBN: 978-87-92731-17-3<br />
http://megapoli.dmi.dk/publ/<strong>MEGAPOLI</strong>_sr11-13.pdf<br />
Esau I., Baklanov A., Zilitinkevich S. (2011): Improved Urban Parameterizations Based on Prognostic<br />
Equations, Utilizing LES Results. Deliverable D2.5, <strong>MEGAPOLI</strong> Scientific Report 11-<br />
14, <strong>MEGAPOLI</strong>-40-REP-2011-09, 61p, ISBN: 978-87-92731-18-0<br />
http://megapoli.dmi.dk/publ/<strong>MEGAPOLI</strong>_sr11-14.pdf<br />
Esau I. (2011): Improved Urban Parameterizations Based on Prognostic Equations, Utilizing LES<br />
Results. Deliverable D2.4.2. <strong>MEGAPOLI</strong> Scientific Report 11-15, <strong>MEGAPOLI</strong>-41-REP-2011-<br />
09, 47p, ISBN: 978-87-92731-19-7<br />
http://megapoli.dmi.dk/publ/<strong>MEGAPOLI</strong>_sr11-15.pdf<br />
Borbon A., E. Freney, N. Marchand, M. Beekmann, E. Abidi, W. Ait-Helal, A. Colomb, J. Cozic,<br />
N. Locoge, S. Sauvage, K. Sellegri, B. Temine-Roussel, J. Sciare, V. Gros, J.L. Jaffrezo, U.<br />
Baltensperger, and the <strong>MEGAPOLI</strong> campaign team (2011): Evaluation of Links between Secondary<br />
VOCs and Secondary Organic Aerosols of Anthropogenic and Biogenic Origin. Deliverable<br />
D3.5, <strong>MEGAPOLI</strong> Scientific Report 11-16, <strong>MEGAPOLI</strong>-42-REP-2011-09, 42p, ISBN:<br />
978-87-92731-20-3<br />
http://megapoli.dmi.dk/publ/<strong>MEGAPOLI</strong>_sr11-16.pdf<br />
Beekmann M., C. Fountoukis, Q.J. Zhang, S. N. Pandis, and the <strong>MEGAPOLI</strong> campaign team<br />
(2011): Evaluation of State-of-the-Art CTMs Using New Experimental Datasets. Deliverable<br />
D3.6, <strong>MEGAPOLI</strong> Scientific Report 11-17, <strong>MEGAPOLI</strong>-43-REP-2011-09, 28p, ISBN: 978-<br />
www.megapoli.info<br />
27
FP7 EC <strong>MEGAPOLI</strong> Project<br />
87-92731-21-0<br />
http://megapoli.dmi.dk/publ/<strong>MEGAPOLI</strong>_sr11-17.pdf<br />
www.megapoli.info<br />
28
FP7 EC <strong>MEGAPOLI</strong> Project<br />
<strong>MEGAPOLI</strong><br />
<strong>Megacities</strong>: <strong>Emissions</strong>, <strong>urban</strong>,<br />
regional and Global Atmospheric<br />
POLlution and climate<br />
effects, and Integrated tools for<br />
assessment and mitigation<br />
EC FP7 Collaborative Project<br />
www.megapoli.info<br />
2008-2011<br />
Theme 6: Environment (including climate change)<br />
Sub-Area: ENV-2007.1.1.2.1:<br />
<strong>Megacities</strong> and regional hot-spots air quality and climate<br />
<strong>MEGAPOLI</strong> Project web-site<br />
http://www.megapoli.info<br />
<strong>MEGAPOLI</strong> Project Office<br />
Danish Meteorological Institute (<strong>DMI</strong>)<br />
Lyngbyvej 100, DK-2100<br />
Copenhagen, Denmark<br />
E-mail: alb@dmi.dk<br />
Phone: +45-3915-7441<br />
Fax: +45-3915-7400<br />
<strong>MEGAPOLI</strong> Project Partners<br />
• <strong>DMI</strong> - Danish Meteorological Institute (Denmark)<br />
- Contact Persons: Prof. Alexander Baklanov (coordinator),<br />
Dr. Alexander Mahura (manager)<br />
• FORTH - Foundation for Research and Technology,<br />
Hellas and University of Patras (Greece) -<br />
Prof. Spyros Pandis (vice-coordinator)<br />
• MPIC - Max Planck Institute for Chemistry (Germany)<br />
- Dr. Mark Lawrence (vice-coordinator)<br />
• ARIANET Consulting (Italy) – Dr. Sandro Finardi<br />
• AUTH - Aristotle University Thessaloniki (Greece)<br />
- Prof. Nicolas Moussiopoulos<br />
• CNRS - Centre National de Recherche Scientifique<br />
(incl. LISA, LaMP, LSCE, GAME, LGGE) (France) –<br />
Dr. Matthias Beekmann<br />
• FMI - Finnish Meteorological Institute (Finland) –<br />
Prof. Jaakko Kukkonen<br />
• JRC - Joint Research Center (Italy) – Dr. Stefano<br />
Galmarini<br />
• ICTP - International Centre for Theoretical Physics<br />
(Italy) - Prof. Filippo Giorgi<br />
• KCL - King's College London (UK) – Prof. Sue<br />
Grimmond<br />
• NERSC - Nansen Environmental and Remote<br />
Sensing Center (Norway) – Dr. Igor Esau<br />
• NILU - Norwegian Institute for Air Research<br />
(Norway) – Dr. Andreas Stohl<br />
• PSI - Paul Scherrer Institute (Switzerland) – Prof.<br />
Urs Baltensperger<br />
• TNO-Built Environment and Geosciences (The<br />
Netherlands) – Prof. Peter Builtjes<br />
• MetO - UK MetOffice (UK) – Dr. Bill Collins<br />
• UHam - University of Hamburg (Germany) – Prof.<br />
Heinke Schluenzen<br />
• UHel - University of Helsinki (Finland) – Prof.<br />
Markku Kulmala<br />
• UH-CAIR - University of Hertfordshire, Centre for<br />
Atmospheric and Instrumentation Research (UK)<br />
– Prof. Ranjeet Sokhi<br />
• USTUTT - University of Stuttgart (Germany) –<br />
Prof. Rainer Friedrich<br />
• WMO - World Meteorological Organization (Switzerland)<br />
– Dr. Liisa Jalkanen<br />
• CUNI - Charles University Prague (Czech Republic)<br />
– Dr. Tomas Halenka<br />
• IfT - Institute of Tropospheric Research (Germany)<br />
– Prof. Alfred Wiedensohler<br />
• UCam - Centre for Atmospheric Science, University<br />
of Cambridge (UK) – Prof. John Pyle<br />
Work Packages<br />
WP1: <strong>Emissions</strong><br />
(H. Denier van der Gon, P. Builtjes)<br />
WP2: Megacity features<br />
(S. Grimmond, I. Esau)<br />
WP3: Megacity plume case study<br />
(M. Beekmann, U. Baltensperger)<br />
WP4: Megacity air quality<br />
(N. Moussiopoulos)<br />
WP5: Regional and global atmospheric composition<br />
(J. Kukkonen, A. Stohl)<br />
WP6: Regional and global climate impacts<br />
(W. Collins, F. Giorgii)<br />
WP7: Integrated tools and implementation<br />
(R. Sokhi, H. Schlünzen)<br />
WP8: Mitigation, policy options and impact assessment<br />
(R. Friedrich, D. van den Hout)<br />
WP9: Dissemination and Coordination<br />
(A. Baklanov, M. Lawrence, S. Pandis)<br />
29