ATAR 2012 Preliminary report
ATAR 2012 Preliminary report
ATAR 2012 Preliminary report
- No tags were found...

You also want an ePaper? Increase the reach of your titles
YUMPU automatically turns print PDFs into web optimized ePapers that Google loves.
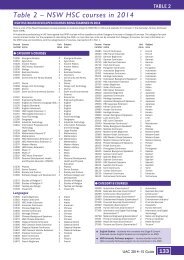
<strong>ATAR</strong> 2014<strong>Preliminary</strong> <strong>report</strong>This preliminary <strong>report</strong> has been prepared to provide some information on the calculation of theAustralian Tertiary Admission Rank (<strong>ATAR</strong>) in 2014 – a more detailed <strong>report</strong> will be released in 2015.Please see the booklet All About Your <strong>ATAR</strong> for more background on the <strong>ATAR</strong>.There were no changes to the scaling procedures in 2014 for the various NSW HSC courses. Theaggregate over the best 10 eligible units following the <strong>ATAR</strong> rules was calculated in the same way as inrecent years.1. OverviewIn 2014 a total of 55,482 students received an <strong>ATAR</strong>, 840 more than in 2013. The gender balancewas similar to 2013.Of the total students, 16.5% received an <strong>ATAR</strong> of 90.00 or above, 32.8% received an <strong>ATAR</strong> of atleast 80.00, 48.4% at least 70.00, and 63.0% at least 60.00. The median <strong>ATAR</strong> was 68.95,slightly lower than in 2013. The median <strong>ATAR</strong> for females was 70.3 whereas the median <strong>ATAR</strong>for males was 67.20.Of the 47 students who received the top <strong>ATAR</strong> of 99.95, there were 14 females and 33 malescoming from a mix of government and non-government schools and studying a wide range ofcourses. The list of courses studied by candidates awarded an <strong>ATAR</strong> of 99.95 contained 37different courses out of the 118 courses offered.When reading the tables attached it must be remembered that the Board of Studies, Teaching, andEducational Standards NSW’s (the Board) HSC mark in a course indicates a standard reached inthat course whereas a scaled mark indicates a student’s position in the course candidature if allstudents had completed that course. Because HSC marks and scaled marks serve these twodifferent purposes, comparing HSC and scaled marks can lead to misinterpretations that mayaffect student choices of courses to study.Because of the different procedures used to calculate the Board’s HSC marks and the scaledmarks, scaled marks are generally lower than the Board’s HSC marks, except near the top. Fewstudents receive HSC marks less than 25 (on a one-unit basis) and the average HSC mark liesbetween 35 and 40 for most courses. In contrast, the average scaled mark for the total HSCcandidature is close to 25, and relatively few scaled means are greater than 35.2. Candidature – Table A1Table A1 provides, for each course, the size of the candidature, the number of candidates whowere awarded an HSC in 2014, the number of candidates who were awarded an <strong>ATAR</strong> in 2014,the percentage of female candidates and the maximum <strong>ATAR</strong> gained by a student enrolled in thatcourse. In the majority of courses some students gained an <strong>ATAR</strong> in excess of 95.00.3. HSC results – Table A2Table A2 provides information on the distributions of the Board’s HSC marks in 2014. In 2014the course Mathematics General 2 was examined for the first time and the new VET Frameworkcourse Information and Digital Technology Exam was introduced. Data are not provided forcourses with less than 10 candidates.<strong>ATAR</strong> 2014 – <strong>Preliminary</strong> Report Page 1 of 4
4. Distributions of scaled marks – Table A3In general, for the larger courses, the patterns of scaled marks from the HSC 2014 were similar tothose from the HSC 2013. Table A3 contains a summary of the distributions of scaled marks ineach course providing information on the number of students; the mean, standard deviation andmaximum mark; and the 99th, 90th, 75th, 50th and 25th percentiles of both the Board’s HSCmarks and the scaled marks. Percentiles are not provided for courses with candidatures lessthan 40.Marks are shown on a one-unit basis, so the range is 0 to 50. The percentiles in a course arebased on all students completing that course irrespective of whether they were eligible for an<strong>ATAR</strong> or not.Table A3 should not be used as a simple HSC to scaled mark conversion table.The Board <strong>report</strong>s HSC marks rounded to the nearest integer whereas the scaled marks arecalculated using the raw HSC marks based on the HSC examinations and moderated schoolassessments. The raw HSC marks are calculated to one decimal place. The Board aligns the rawmarks to bands that best describe the standards that the students achieve. This can compress arange of raw marks to a smaller number of HSC marks. For example, all Band E4 performancesin English Extension 1, say, are allocated one of the six integer grades 45.0 to 50.0. Thus afteraligning and rounding, for each HSC mark there can be a range of corresponding raw marks andhence a range of scaled marks. In general there is no unique scaled mark for an HSC mark.Table A3 gives the HSC mark at the specified percentile. Not all students with that HSC markwill be at that percentile when the raw marks are considered. For example, in Dance themaximum mark and the 99th percentile of the HSC distribution are both 49.5 whereas the scaledmarks at the corresponding percentiles are 47.1 and 46.4.This issue has been discussed in full in the Report on the Scaling of the 2013 NSW HSC, pages 14and 15.5. Variation in patterns of HSC and scaled marks – Tables A4, A5A concern that is frequently raised is that the observed variation in the patterns of HSC marksacross different courses (Table A2) affects scaling and the ranking calculation. Since it is the rawHSC marks that are scaled, not the HSC marks by which the Board <strong>report</strong>s student achievement,this observed variation does not affect the ranking calculation. A full discussion of this can befound in the Report on Scaling of the 2013 NSW HSC, Section 3.It is to be expected that the patterns of HSC marks will change from year to year, reflectingdifferences in student achievement against the published standards in individual courses. Incontrast, one would expect to see differences in the patterns of scaled marks of large candidaturecourses only if the overall academic quality of a course candidature changed, usually as a result ofa substantial change in the size of the candidature. Table A4 shows the variation in thedistributions of HSC marks from 2013 to 2014, for each course, while Table A5 provides thesame information for scaled marks. The data show that while some distributions of HSC markschange from 2013 to 2014 the distributions of scaled marks are generally stable. The exceptionsare for small courses where the candidature can change noticeably from year to year.6. The courses that contribute towards the <strong>ATAR</strong> – Table A6The <strong>ATAR</strong> Advice Notice shows which units contribute to a student’s <strong>ATAR</strong>. Some students arepuzzled as to why one course is included and not another. The scaled mark a student receives fora course depends both on the scaled mean of the course and the student’s position.A frequently asked question is whether there are systematic differences between groups ofcourses. The concern is that some courses contribute towards the <strong>ATAR</strong> less that other courses.<strong>ATAR</strong> 2014 – <strong>Preliminary</strong> Report Page 2 of 4
For each course, Table A6 provides information on the percentage of students who counted allunits of that course towards their <strong>ATAR</strong>. The data indicate that while there is some variability inthe percentage of students who count the course towards their <strong>ATAR</strong>s, there appears to be noevidence of systematic differences between different groups of courses. This year Table A6 alsoincludes, for each course, the maximum <strong>ATAR</strong> for a candidate including all units of that coursein their aggregate.7. The <strong>ATAR</strong> distribution – Tables A7 and A8The data given in Table A7 show the number of students awarded a particular <strong>ATAR</strong> in 2014 for<strong>ATAR</strong>s of 99.00 or more, and the frequencies associated with different <strong>ATAR</strong> classes from 99.00to 30.00.Table A8 gives the <strong>ATAR</strong> corresponding to selected percentiles of the <strong>ATAR</strong> cohort for 2010 to2014.8. The <strong>ATAR</strong> and the aggregate – Table A9Table A9 shows the lowest aggregate of scaled marks out of 500 corresponding to each of theselected <strong>ATAR</strong>s for 2010 to 2014.9. General comparisonsNote that <strong>ATAR</strong>s are, in general, lower than the average of the HSC marks <strong>report</strong>ed to students.This is a consequence of the different ways student achievement is <strong>report</strong>ed.The Board <strong>report</strong>s against standards, with students being placed in bands that indicate thestandards they have reached in their individual courses. An HSC mark indicates where a studentis situated in a performance band and as there are few students in performance band 1, most HSCmarks lie between 50 and 100. In contrast, a student’s <strong>ATAR</strong> indicates their overall position inrelation to their cohort.The median <strong>ATAR</strong> in 2014 was 68.95. A middle student will generally have HSC marks that liebetween 70 and 80. Because of the large percentage of students placed in performance band 4, the<strong>ATAR</strong>s of students with HSC marks around 80 will often be very different from the <strong>ATAR</strong>s ofstudents with HSC marks around 70. This is discussed in the All about your <strong>ATAR</strong> booklet.Professor Neville WeberChair, Technical Committee on Scaling.December 2014<strong>ATAR</strong> 2014 – <strong>Preliminary</strong> Report Page 3 of 4
AppendixCommentThe following courses are not included in the Tables as they have less than 10 students.• Arabic Beginners• Dutch• Hungarian• Heritage Indonesian• Malay Background Speakers• Maltese• Ukrainian.Some other courses do not appear in all tables if they have less than the minimum number of candidatesrequired for a particular table.Table descriptionsTable A1Table A2Table A3Gender, <strong>ATAR</strong> eligibility and maximum <strong>ATAR</strong> by courseExcludes courses with fewer than 10 studentsDistributions of 2014 HSC marks by courseExcludes courses with fewer than 10 studentsDescriptive statistics and selected percentiles for HSC and scaled marks by courseExcludes courses with fewer than 10 students or fewer than 4 <strong>ATAR</strong>-eligible students.No percentile data are given for courses with less than 40 students.Table A4 Distributions of HSC marks by course: 2013–2014Excludes courses with fewer than 40 students in either yearTable A5 Distributions of scaled marks by course: 2013–2014Excludes courses with fewer than 40 students in either yearTable A6Table A7Courses that contribute to the <strong>ATAR</strong>Excludes courses with fewer than 10 students<strong>ATAR</strong> distributionTable A8 <strong>ATAR</strong> percentiles: 2010–2014Table A9 Relationship between the <strong>ATAR</strong> and aggregates: 2010–2014<strong>ATAR</strong> 2014 – <strong>Preliminary</strong> Report Page 4 of 4