Eukaryotic Gene Prediction - Rice Genome Annotation Project
Eukaryotic Gene Prediction - Rice Genome Annotation Project
Eukaryotic Gene Prediction - Rice Genome Annotation Project
- No tags were found...

You also want an ePaper? Increase the reach of your titles
YUMPU automatically turns print PDFs into web optimized ePapers that Google loves.
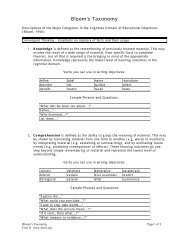
<strong>Gene</strong> Structure
Signal SensorsA signal sensor evaluates fixed-length featuresin DNA. Start codons Stop codons Donor sites Acceptor sites Promoters Poly-A signals
<strong>Gene</strong> <strong>Prediction</strong> Approaches Intrinsic (ab(initio)GENSCAN, FGENESH, <strong>Gene</strong>Mark.hmmGlimmerM,Genie; Extrinsic (similarity-based)Spliced alignment: <strong>Genome</strong>Scan, Eu<strong>Gene</strong>, , FGENESH+,FGENESH_C, <strong>Gene</strong>Id+, etc;Genomic comparison: TwinScan, , TWAIN, SLAM, SGP,FGENESH_2, etc;Integrated<strong>Gene</strong>Scope, <strong>Gene</strong>Machine, , JIGSAW, <strong>Rice</strong>GAAS,Ensembl, , EVM etc.
ab initio <strong>Gene</strong> <strong>Prediction</strong>Adopt a rigorous probabilistic model of sequencestructure and choose the most probable parseaccording to that probabilistic model.ProsConsFast and efficientRemarkable accuracy at the nucleotide levelLess than 50% accuracy at the gene level
Development of a <strong>Gene</strong> Finder Build the model Train the model to generate the relatedparameters Predict/Evaluate
Imperfect ModelGT…………..AG…A|G| |G|T…1-bp intron
Nucleotide level Exon level <strong>Gene</strong> levelAccuracy Evaluation
Nucleotide/Base Level<strong>Prediction</strong> accuracy per base coding/non-coding
Exon Level<strong>Prediction</strong> accuracy with respect to exact prediction of exon startand end points
<strong>Gene</strong>/Protein Level<strong>Prediction</strong> accuracy with respect to the protein productencoded by the predicted gene
A Simple CalculationGiven x accuracy at exon level, the accuracy of the prediction atthe gene level is:P = P (all exons correctly predicted) =x n ,where n is the number of exons in the gene.Typically, x
Performance Species-specific setting GC content <strong>Gene</strong> density <strong>Gene</strong>/Exon/Intron length distribution Codon usage Benchmark training data set test data set
Maize <strong>Gene</strong> <strong>Prediction</strong>
<strong>Gene</strong> Finders
Accuracy
Challenges of Intrinsic ApproachesAlternative splicingNested/overlapped genesExtremely long/short genesExtremely long intronsExtremely short exonsNon-canonical intronsFrame-shift errorsSplit start codons (that is, the start codon is split by an intronin the genomic sequence)UTR intronsNon-ATG triplet as the start codonPolycistronic genes
<strong>Gene</strong> <strong>Prediction</strong> Approaches Intrinsic (ab(initio)GENSCAN, FGENESH, <strong>Gene</strong>Mark.hmmGlimmerM,Genie; Extrinsic (similarity-based)Spliced alignment: <strong>Genome</strong>Scan, Eu<strong>Gene</strong>, , FGENESH+,FGENESH_C, <strong>Gene</strong>Id+, etc;Genomic comparison: TwinScan, , TWAIN, SLAM, SGP,FGENESH_2, etc;Integrated<strong>Gene</strong>Scope, <strong>Gene</strong>Machine, , JIGSAW, <strong>Rice</strong>GAAS,Ensembl, , etc.
Similarity-based <strong>Gene</strong> <strong>Prediction</strong> EST/cDNA spliced alignment Protein spliced alignment Genomic comparison Intra-genomic Inter-genomic
EST/cDNA Spliced Alignment
Pros and ConsProsConsHigh accuracyUnavailability or incompleteness of transcript sequencedataExtra computation to generate alignmentsDiverse sequence qualityIncomplete full-length cDNAContaminationIncorrect sequence orientations
Genomic ComparisonMicrosynteny between M. truncatula and ArabidopsisHongyan et al, 2003
<strong>Gene</strong> Structure of Syntenic and non-SyntenicHomologous <strong>Gene</strong>sHongyan et al, 2003
Comparative Analysis of Cereal<strong>Gene</strong> Structures
Comparative Analysis of Cereal<strong>Gene</strong> Promoters
Pros and ConsProsAid to identify low expressed genesIdentify genes in multiple species simultaneouslyAid to identify transcription factor binding sitesUncover non-protein coding genesConsPerformance will depend on the evolutionary distancebetween the compared sequences.Exon/intron boundaries may not be conserved
Tiling Array
ARTADE-ARabidopsisTiling-Array-based Detection of Exons
<strong>Gene</strong> <strong>Prediction</strong> Approaches Intrinsic (ab(initio)GENSCAN, FGENESH, <strong>Gene</strong>Mark.hmmGlimmerM,Genie; Extrinsic (similarity-based)Spliced alignment: <strong>Genome</strong>Scan, Eu<strong>Gene</strong>, , FGENESH+,FGENESH_C, <strong>Gene</strong>Id+, etc;Genomic comparison: TwinScan, , TWAIN, SLAM, SGP,FGENESH_2, etc;Integrated<strong>Gene</strong>Scope, <strong>Gene</strong>Machine, , JIGSAW (combiner),<strong>Rice</strong>GAAS, Ensembl, , etc.
<strong>Gene</strong> Discovery via Multiple <strong>Gene</strong>Finders
EVM
TIGR <strong>Rice</strong> <strong>Genome</strong> <strong>Annotation</strong>Pipeline
<strong>Rice</strong>GAAC
Ensembl<strong>Gene</strong><strong>Prediction</strong>Procedure
SummaryNothing is perfectEach gene identification approach has its ownfeatures and limitations;<strong>Genome</strong> annotation is an on-going process, and theaccuracy is being improved along with theaccumulation of the evidence data;tRNAsnoRNAtRNAsnoRNA
Case Study
Sorghum-<strong>Rice</strong> Synteny and EST Read Pair
Create a <strong>Gene</strong> Model
Expression DataData TypeEST/FL-cDNAPeptideMPSSSAGEMicroarrayTiling arrayData SourcePASA/Manual curationKoller et al., PNAS, 2002 (6,296peptides/2,528 fgenesh models)Blake Meyers (http://mpss.udel.edumpss.udel.edu/rice/)126,663 tags from MGOS(http://www.mgosdb.orgwww.mgosdb.org/sage/)NSF <strong>Rice</strong> Oligonucleotide Array project(http://www.ricearraryricearrary.org)Deng lab, Yale University
Expression Data in Gbrowse
GATCGATCI. Library constructionBrenner et al., PNAS 97:1665-70.AAAAAAAAAAAAAAAAAAAAAAAAAAAA AAAAAAAAAAAAAAAAAAAAA AAAAAAAAAAAAAAAAAAAAAAAAAAAAAAAAAAAAAAAAAAAAAAAAA AAAAAAAAAAAAAA AAAAAAAAAAAAAAAAAAAAA AAAAAAAAAAAAAA AAAAAAAAAAAAAAAAAAAAAAAAAAAAmRNAMPSS SEQUENCINGTECHNOLOGY1) Cut w/ DpnII2) Ligate MmeI adapterMmeITTTTTAAAAA3) Cut to capture 21-22 bp “signature”4) Add ‘DNA barcode’, amplify &capture on beadsEach beadcontains theamplifiedproductderived fromthe 3’ end ofa singletranscript.II. Loading the ‘flow cell’+NNNN4 3 2 1III. Sequencing of tagsBrenner et al., Nat. Biotech. 18:630-4.NNNXNNXNRSRSCODEX1CODEX22) Sequence byhybridizationNXNN RS CODEX3XNNN RS CODEX41) Add adaptors16 cyclesfor 4 bp3) Digest with Type IIS enzyme touncover next 4 bases, repeat cycle
Ovary and mature stigma
Refine <strong>Gene</strong> Structure
“Have no fear of perfection -you'll never reach it.”- Salvador Dalí