In Situ Raman Spectroscopy of Supported Chromium Oxide ...
In Situ Raman Spectroscopy of Supported Chromium Oxide ...
In Situ Raman Spectroscopy of Supported Chromium Oxide ...
- No tags were found...

Create successful ePaper yourself
Turn your PDF publications into a flip-book with our unique Google optimized e-Paper software.
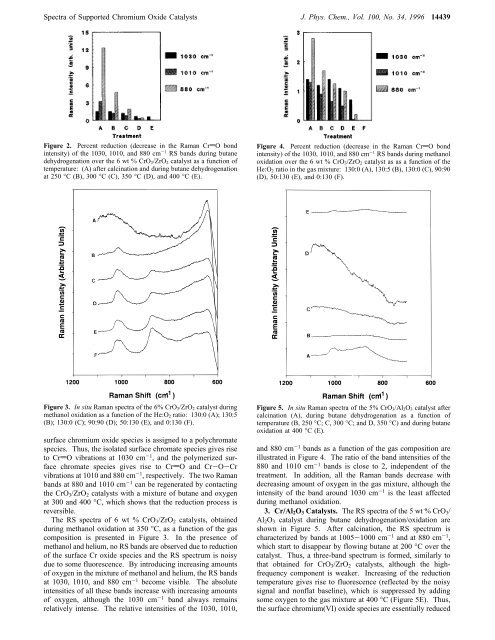
Spectra <strong>of</strong> <strong>Supported</strong> <strong>Chromium</strong> <strong>Oxide</strong> Catalysts J. Phys. Chem., Vol. 100, No. 34, 1996 14439Figure 2. Percent reduction (decrease in the <strong>Raman</strong> CrdO bondintensity) <strong>of</strong> the 1030, 1010, and 880 cm -1 RS bands during butanedehydrogenation over the 6 wt % CrO 3/ZrO 2 catalyst as a function <strong>of</strong>temperature: (A) after calcination and during butane dehydrogenationat 250 °C (B), 300 °C (C), 350 °C (D), and 400 °C (E).Figure 4. Percent reduction (decrease in the <strong>Raman</strong> CrdO bondintensity) <strong>of</strong> the 1030, 1010, and 880 cm -1 RS bands during methanoloxidation over the 6 wt % CrO 3/ZrO 2 catalyst as as a function <strong>of</strong> theHe:O 2 ratio in the gas mixture: 130:0 (A), 130:5 (B), 130:0 (C), 90:90(D), 50:130 (E), and 0:130 (F).Figure 3. <strong>In</strong> situ <strong>Raman</strong> spectra <strong>of</strong> the 6% CrO 3/ZrO 2 catalyst duringmethanol oxidation as a function <strong>of</strong> the He:O 2 ratio: 130:0 (A); 130:5(B); 130:0 (C); 90:90 (D); 50:130 (E), and 0:130 (F).surface chromium oxide species is assigned to a polychromatespecies. Thus, the isolated surface chromate species gives riseto CrdO vibrations at 1030 cm -1 , and the polymerized surfacechromate species gives rise to CrdO and Cr-O-Crvibrations at 1010 and 880 cm -1 , respectively. The two <strong>Raman</strong>bands at 880 and 1010 cm -1 can be regenerated by contactingthe CrO 3 /ZrO 2 catalysts with a mixture <strong>of</strong> butane and oxygenat 300 and 400 °C, which shows that the reduction process isreversible.The RS spectra <strong>of</strong> 6 wt % CrO 3 /ZrO 2 catalysts, obtainedduring methanol oxidation at 350 °C, as a function <strong>of</strong> the gascomposition is presented in Figure 3. <strong>In</strong> the presence <strong>of</strong>methanol and helium, no RS bands are observed due to reduction<strong>of</strong> the surface Cr oxide species and the RS spectrum is noisydue to some fluorescence. By introducing increasing amounts<strong>of</strong> oxygen in the mixture <strong>of</strong> methanol and helium, the RS bandsat 1030, 1010, and 880 cm -1 become visible. The absoluteintensities <strong>of</strong> all these bands increase with increasing amounts<strong>of</strong> oxygen, although the 1030 cm -1 band always remainsrelatively intense. The relative intensities <strong>of</strong> the 1030, 1010,Figure 5. <strong>In</strong> situ <strong>Raman</strong> spectra <strong>of</strong> the 5% CrO 3/Al 2O 3 catalyst aftercalcination (A), during butane dehydrogenation as a function <strong>of</strong>temperature (B, 250 °C; C, 300 °C; and D, 350 °C) and during butaneoxidation at 400 °C (E).and 880 cm -1 bands as a function <strong>of</strong> the gas composition areillustrated in Figure 4. The ratio <strong>of</strong> the band intensities <strong>of</strong> the880 and 1010 cm -1 bands is close to 2, independent <strong>of</strong> thetreatment. <strong>In</strong> addition, all the <strong>Raman</strong> bands decrease withdecreasing amount <strong>of</strong> oxygen in the gas mixture, although theintensity <strong>of</strong> the band around 1030 cm -1 is the least affectedduring methanol oxidation.3. Cr/Al 2 O 3 Catalysts. The RS spectra <strong>of</strong> the 5 wt % CrO 3 /Al 2 O 3 catalyst during butane dehydrogenation/oxidation areshown in Figure 5. After calcination, the RS spectrum ischaracterized by bands at 1005-1000 cm -1 and at 880 cm -1 ,which start to disappear by flowing butane at 200 °C over thecatalyst. Thus, a three-band spectrum is formed, similarly tothat obtained for CrO 3 /ZrO 2 catalysts, although the highfrequencycomponent is weaker. <strong>In</strong>creasing <strong>of</strong> the reductiontemperature gives rise to fluorescence (reflected by the noisysignal and nonflat baseline), which is suppressed by addingsome oxygen to the gas mixture at 400 °C (Figure 5E). Thus,the surface chromium(VI) oxide species are essentially reduced