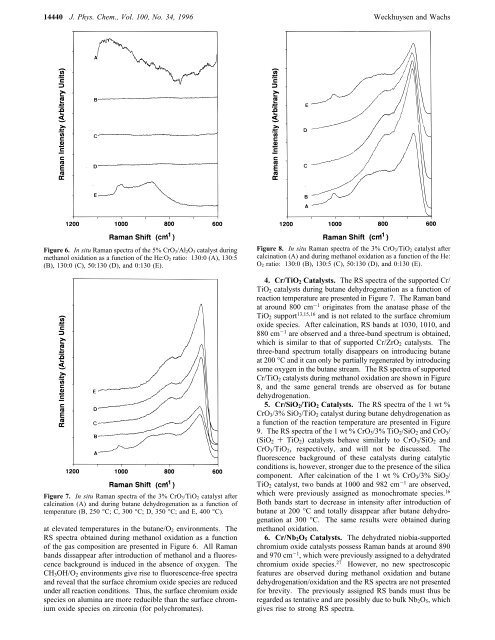
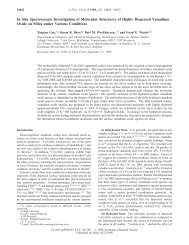
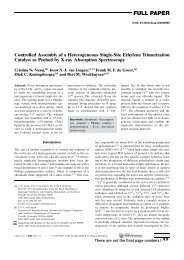
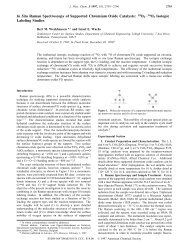
14440 J. Phys. Chem., Vol. 100, No. 34, 1996 Weckhuysen and WachsFigure 6. <strong>In</strong> situ <strong>Raman</strong> spectra <strong>of</strong> the 5% CrO 3/Al 2O 3 catalyst duringmethanol oxidation as a function <strong>of</strong> the He:O 2 ratio: 130:0 (A), 130:5(B), 130:0 (C), 50:130 (D), and 0:130 (E).Figure 7. <strong>In</strong> situ <strong>Raman</strong> spectra <strong>of</strong> the 3% CrO 3/TiO 2 catalyst aftercalcination (A) and during butane dehydrogenation as a function <strong>of</strong>temperature (B, 250 °C; C, 300 °C; D, 350 °C; and E, 400 °C).at elevated temperatures in the butane/O 2 environments. TheRS spectra obtained during methanol oxidation as a function<strong>of</strong> the gas composition are presented in Figure 6. All <strong>Raman</strong>bands dissappear after introduction <strong>of</strong> methanol and a fluorescencebackground is induced in the absence <strong>of</strong> oxygen. TheCH 3 OH/O 2 environments give rise to fluorescence-free spectraand reveal that the surface chromium oxide species are reducedunder all reaction conditions. Thus, the surface chromium oxidespecies on alumina are more reducible than the surface chromiumoxide species on zirconia (for polychromates).Figure 8. <strong>In</strong> situ <strong>Raman</strong> spectra <strong>of</strong> the 3% CrO 3/TiO 2 catalyst aftercalcination (A) and during methanol oxidation as a function <strong>of</strong> the He:O 2 ratio: 130:0 (B), 130:5 (C), 50:130 (D), and 0:130 (E).4. Cr/TiO 2 Catalysts. The RS spectra <strong>of</strong> the supported Cr/TiO 2 catalysts during butane dehydrogenation as a function <strong>of</strong>reaction temperature are presented in Figure 7. The <strong>Raman</strong> bandat around 800 cm -1 originates from the anatase phase <strong>of</strong> theTiO 2 support 13,15,16 and is not related to the surface chromiumoxide species. After calcination, RS bands at 1030, 1010, and880 cm -1 are observed and a three-band spectrum is obtained,which is similar to that <strong>of</strong> supported Cr/ZrO 2 catalysts. Thethree-band spectrum totally disappears on introducing butaneat 200 °C and it can only be partially regenerated by introducingsome oxygen in the butane stream. The RS spectra <strong>of</strong> supportedCr/TiO 2 catalysts during methanol oxidation are shown in Figure8, and the same general trends are observed as for butanedehydrogenation.5. Cr/SiO 2 /TiO 2 Catalysts. The RS spectra <strong>of</strong> the 1 wt %CrO 3 /3% SiO 2 /TiO 2 catalyst during butane dehydrogenation asa function <strong>of</strong> the reaction temperature are presented in Figure9. The RS spectra <strong>of</strong> the 1 wt % CrO 3 /3% TiO 2 /SiO 2 and CrO 3 /(SiO 2 + TiO 2 ) catalysts behave similarly to CrO 3 /SiO 2 andCrO 3 /TiO 2 , respectively, and will not be discussed. Thefluorescence background <strong>of</strong> these catalysts during catalyticconditions is, however, stronger due to the presence <strong>of</strong> the silicacomponent. After calcination <strong>of</strong> the 1 wt % CrO 3 /3% SiO 2 /TiO 2 catalyst, two bands at 1000 and 982 cm -1 are observed,which were previously assigned as monochromate species. 16Both bands start to decrease in intensity after introduction <strong>of</strong>butane at 200 °C and totally disappear after butane dehydrogenationat 300 °C. The same results were obtained duringmethanol oxidation.6. Cr/Nb 2 O 5 Catalysts. The dehydrated niobia-supportedchromium oxide catalysts possess <strong>Raman</strong> bands at around 890and 970 cm -1 , which were previously assigned to a dehydratedchromium oxide species. 27 However, no new spectroscopicfeatures are observed during methanol oxidation and butanedehydrogenation/oxidation and the RS spectra are not presentedfor brevity. The previously assigned RS bands must thus beregarded as tentative and are possibly due to bulk Nb 2 O 5 , whichgives rise to strong RS spectra.
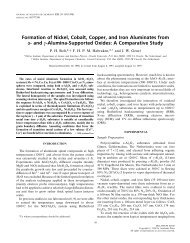
Spectra <strong>of</strong> <strong>Supported</strong> <strong>Chromium</strong> <strong>Oxide</strong> Catalysts J. Phys. Chem., Vol. 100, No. 34, 1996 14441Figure 9. <strong>In</strong> situ <strong>Raman</strong> spectra <strong>of</strong> the 1% CrO 3/SiO 2/TiO 2 catalystafter calcination (A) and during butane dehydrogenation as a function<strong>of</strong> temperature (B, 200 °C; C, 250 °C; D, 300 °C; E, 350 °C; and F,400 °C).DiscussionSpectroscopic techniques, like <strong>Raman</strong> spectroscopy, have tobe developed which allow measurements under conditions asclose as possible to “real” catalytic conditions. Thus, in general,in situ spectroscopic studies are required to fully understandthe catalytic action <strong>of</strong> supported metal oxide catalysts. <strong>In</strong> thiswork, the extent <strong>of</strong> reduction <strong>of</strong> supported chromium oxidecatalysts in methanol oxidation and butane dehydrogenation/oxidation has been probed using in situ <strong>Raman</strong> spectroscopy.The extent <strong>of</strong> reduction <strong>of</strong> surface chromium oxides duringcatalysis is strongly dependent on the support type and meritsa more detailed discussion, which will cover the followingtopics: (1) the potential <strong>of</strong> in situ <strong>Raman</strong> spectroscopy to probesurface chromium oxide species during catalysis and (2) theredox behavior <strong>of</strong> supported chromium oxides.1. Evaluation <strong>of</strong> in <strong>Situ</strong> <strong>Raman</strong> <strong>Spectroscopy</strong>. <strong>Raman</strong>spectroscopy is an optical technique and, therefore, is applicablefor studying the structural changes <strong>of</strong> the surface chromiumoxide species under in situ conditions where the temperatureand gas composition <strong>of</strong> the catalyst can be controlled. <strong>In</strong> thepresent characterization study, the reaction temperature wasvaried between 200 and 500 °C and various gas compositionwere examined. Although <strong>Raman</strong> spectroscopy is a bulktechnique, it provides detailed information about the surfacechromium oxide species during catalytic reactions since thesupported chromium oxides are all located on the surface <strong>of</strong>the inorganic oxides (100% dispersed). The same band patternswere obtained under catalytic reaction conditions as underdehydrated conditions and only small shifts to lower energyvalues were observed. These small <strong>Raman</strong> band shifts are dueto the relatively high temperatures (CrdO vibrations changeslightly with temperature) and to some hydrogen bonding <strong>of</strong>the probe molecules during catalysis.The biggest advantage <strong>of</strong> RS is that it is able to distinguishbetween different polymerization degrees <strong>of</strong> Cr 6+ . The molecularvibrations <strong>of</strong> surface Cr 6+ are always easy to measurebecause <strong>of</strong> the large change in polarizability <strong>of</strong> the CrdO andCr-O-Cr bands during vibration. This results in relativelystrong <strong>Raman</strong> bands, but this is not the case for the loweroxidation states <strong>of</strong> Cr (i.e., Cr 3+ and Cr 2+ ). Thus, the decrease<strong>of</strong> intensity <strong>of</strong> the Cr 6+ <strong>Raman</strong> bands during butane dehydrogenationand methanol oxidation is not compensated by anincrease in intensity <strong>of</strong> the RS bands <strong>of</strong> reduced Cr species.Consequently, information about redox behavior can only beobtained by following the relative intensities <strong>of</strong> the Cr 6+ RSbands as a function <strong>of</strong> reaction temperature. However, suchreduction studies enable us to clearly distinguish for the firsttime two surfaces Cr 6+ species differing in redox behavior, i.e.a difficult to reduce monochromate species characterized by aRS band around 1030 cm -1 and a more easily reduciblepolychromate species with RS bands at 1010 and 880 cm -1 .The copresence <strong>of</strong> chromate and polychromate surface specieswas already proposed by one <strong>of</strong> us from diffuse reflectancespectroscopy, 28,29 and the present results complete the picture<strong>of</strong> surface chemistry and spectroscopy <strong>of</strong> chromium oxides.One possible limitation <strong>of</strong> <strong>Raman</strong> spectroscopy for thecharacterization <strong>of</strong> supported chromium oxide catalysts occurswhen the vibrations <strong>of</strong> the oxide support overlap with thevibrations arising <strong>of</strong> the surface chromium oxide phase.However, most oxide supports give only weak <strong>Raman</strong> signals(i.e. weak backgrounds) and in this work some minor problemswere encountered with niobia and to a lesser extent with titania.The weak support <strong>Raman</strong> signals make this characterizationpreferable for supported metal oxide catalysts than infraredspectroscopy, which gives rise to strong support IR signals.<strong>Raman</strong> spectroscopy can suffer from fluorescence duringcatalytic action. This is especially true for silica- and aluminabasedcatalysts and at high reaction temperatures. Suchfluorescence complicates the quantitative interpretation <strong>of</strong> theobtained RS spectra, especially in the absence <strong>of</strong> oxygen in thegas phase.2. Redox Behavior <strong>of</strong> <strong>Supported</strong> <strong>Chromium</strong> <strong>Oxide</strong>s. Theredox behavior <strong>of</strong> supported chromium oxides is stronglydependent on the specific support and can be evaluated byfollowing the relative intensities <strong>of</strong> the Cr 6+ RS bands as afunction <strong>of</strong> the reaction temperature during butane dehydrogenation.The following sequence in redox behavior can bededuced from the reported <strong>Raman</strong> spectra: 3% TiO 2 /SiO 2 ≈3% SiO 2 /TiO 2 ≈ (SiO 2 + TiO 2 ) ≈ TiO 2 > ZrO 2 . The SiO 2and Al 2 O 3 supports cannot be evaluated because <strong>of</strong> thefluorescence background. The differences in redox behavior<strong>of</strong> surface chromium oxides between different supports havebeen previously observed by diffuse reflectance spectroscopyand were explained in terms <strong>of</strong> hardness-s<strong>of</strong>tness concepts,first introduced by Pearson. 30 The present investigation,however, gives an important extension to other support typesand preparation methods. The obtained sequence also revealsthat the order <strong>of</strong> magnitude variation in turnover frequencies(TOF, the number <strong>of</strong> methanol molecules converted to redoxproducts per surface chromium species per second) previouslyobserved for methanol oxidation does not correlate with thereducibility <strong>of</strong> the supported chromium oxide catalysts. 12,13Although an inorganic support acts as an important ligandinfluencing the stability <strong>of</strong> supported chromium oxide species,the catalytic action <strong>of</strong> supported chromium oxide catalysts inredox reactions is determined by its reduction and reoxidationproperties. Thus, supported metal oxides need to behave as areversible redox couple to be active in gas phase catalysis.Conclusions<strong>In</strong> situ <strong>Raman</strong> spectroscopy is a valuable tool for thecharacterization <strong>of</strong> supported chromium oxide catalysts under