national house price index - Permanent TSB Group
national house price index - Permanent TSB Group
national house price index - Permanent TSB Group
- No tags were found...
You also want an ePaper? Increase the reach of your titles
YUMPU automatically turns print PDFs into web optimized ePapers that Google loves.
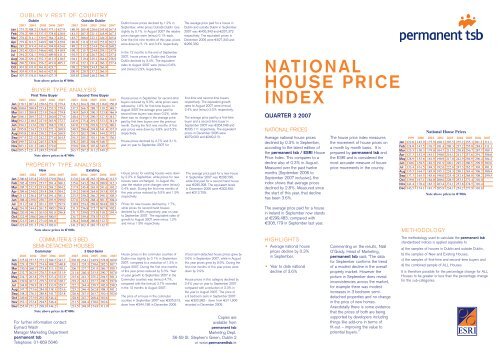
8354-<strong>house</strong><strong>price</strong> <strong>index</strong> 06/11/2007 14:14 Page 1DUBLIN V REST OF COUNTRYDublinOutside Dublin2003 2004 2005 2006 2007 2003 2004 2005 2006 2007Jan 275.7 308.2 336.0 373.1 427.9 180.9 205.4 220.6 243.8 267.5Feb 278.2 309.3 337.5 378.8 428.9 181.5 207.3 221.1 245.9 267.3Mar 278.6 314.1 339.9 384.3 429.2 183.7 208.6 222.1 249.2 265.8Apr 279.8 316.5 340.9 388.5 429.8 186.0 211.8 223.0 252.0 262.3May 285.2 319.4 343.6 394.8 424.6 189.2 213.2 224.4 256.4 260.2Jun 292.4 320.5 346.6 402.3 418.9 190.3 215.7 224.9 259.1 257.9Jul 294.2 324.1 350.2 409.0 411.1 192.5 217.4 226.7 262.1 257.4Aug 298.2 329.4 352.3 412.9 410.5 194.1 219.4 229.1 264.6 256.9Sep 296.5 330.6 356.2 419.8 405.3 195.4 222.1 231.4 266.3 257.4Oct 301.9 333.9 361.0 423.7 198.2 220.9 234.5 266.9Nov 303.4 333.6 365.6 427.0 200.9 220.7 237.2 266.5Dec 307.3 334.8 368.6 427.3 203.8 220.0 240.2 266.3Note above <strong>price</strong>s in €’000sBUYER TYPE ANALYSISFirst Time BuyerSecond Time Buyer2003 2004 2005 2006 2007 2003 2004 2005 2006 2007Jan 178.7 207.4 220.6 251.3 279.4 236.2 264.2 288.2 316.0 350.0Feb 180.6 208.8 223.4 253.5 279.4 237.5 266.7 288.7 319.2 348.7Mar 183.1 208.8 223.9 256.8 279.8 238.9 269.5 290.3 323.8 346.9Apr 188.1 209.7 227.3 260.8 277.6 240.4 273.5 290.3 327.3 343.7May 192.3 210.5 227.9 263.9 272.7 243.9 275.4 291.5 333.3 341.9Jun 194.3 213.6 230.7 268.5 270.1 247.0 277.0 292.8 337.6 340.1Jul 195.8 214.7 233.9 272.1 268.9 249.5 280.4 294.8 341.4 337.9Aug 195.8 218.4 238.2 275.6 268.9 253.7 282.7 298.1 344.2 337.1Sep 197.5 221.0 242.2 277.6 264.5 254.3 285.2 301.1 346.7 336.1Oct 199.7 223.4 245.3 278.8 258.2 285.2 304.9 348.7Nov 203.1 221.2 248.1 279.6 259.8 286.5 307.6 349.5Dec 205.2 221.4 249.5 279.0 263.7 287.2 311.2 349.2Note above <strong>price</strong>s in €’000sPROPERTY TYPE ANALYSISNewExisting2003 2004 2005 2006 2007 2003 2004 2005 2006 2007Jan 200.6 225.8 252.0 279.0 304.2 213.6 241.8 263.3 286.4 312.5Feb 202.4 229.9 253.7 281.4 306.3 215.6 243.2 263.9 288.9 312.3Mar 205.7 232.5 253.9 284.2 304.2 217.9 245.4 263.9 291.6 310.2Apr 209.6 234.0 255.4 288.3 304.2 219.2 248.9 264.8 293.8 307.8May 211.1 236.4 257.6 291.4 301.1 223.5 250.2 266.2 298.1 305.3Jun 208.4 239.0 258.7 293.9 299.0 227.6 252.0 268.4 301.5 304.4Jul 211.2 241.2 261.1 297.7 297.9 230.9 254.3 269.8 304.8 303.5Aug 216.9 244.4 261.5 300.5 296.8 231.5 256.8 272.7 307.8 302.1Sep 220.9 248.1 263.0 301.8 296.8 231.7 259.0 275.0 310.2 295.4Oct 222.9 250.0 266.9 300.5 234.7 259.4 278.5 312.7Nov 221.5 249.1 271.0 301.8 238.4 260.8 280.8 312.7Dec 223.6 251.3 276.2 302.6 241.2 262.1 283.7 312.7Note above <strong>price</strong>s in €’000sCOMMUTER & 3 BEDSEMI-DETACHED HOUSESCommuter3 Bed-Semi2003 2004 2005 2006 2007 2003 2004 2005 2006 2007Jan 225.6 257.5 272.2 304.5 343.7 202.0 234.1 249.9 278.0 309.0Feb 229.3 259.7 274.6 308.2 340.8 203.1 235.3 250.6 282.5 307.7Mar 230.5 260.7 275.8 313.1 338.1 206.7 237.7 251.9 286.7 309.7Apr 232.7 262.9 278.3 316.8 331.9 211.6 240.4 253.5 290.7 307.0May 234.7 263.8 279.5 323.4 332.9 215.6 241.3 255.2 294.5 301.2Jun 239.8 267.3 279.3 327.8 330.7 219.2 243.1 257.7 296.5 297.0Jul 244.0 270.9 281.5 333.9 329.7 222.3 244.4 259.7 302.8 298.5Aug 247.7 273.6 284.0 338.1 325.6 225.2 246.4 262.8 308.3 301.2Sep 248.2 276.1 288.8 341.7 325.8 226.6 247.5 263.7 310.4 303.0Oct 249.6 273.9 292.0 344.4 228.8 247.7 268.4 310.6Nov 252.1 272.4 294.5 346.4 231.5 248.4 270.6 310.6Dec 255.8 271.2 298.9 344.2 233.5 248.9 274.9 311.9Note above <strong>price</strong>s in €’000sFor further information contact:Eymard WalshManager Marketing Departmentpermanent tsbTelephone: 01-669 5646Dublin <strong>house</strong> <strong>price</strong>s declined by 1.2% inSeptember, while <strong>price</strong>s Outside Dublin roseslightly by 0.1%. In August 2007 the relative<strong>price</strong> changes were (minus) 0.1% each.Over the first nine months of this year, <strong>price</strong>swere down by 5.1% and 3.4% respectively.In the 12 months to the end of September2007, <strong>house</strong> <strong>price</strong>s in Dublin and OutsideDublin declined by 3.4%. The equivalentrates to August 2007 were (minus) 0.6%and (minus) 2.9% respectively.House <strong>price</strong>s in September for second-timebuyers reduced by 0.3%, while <strong>price</strong>s werereduced by 1.6% for first-time buyers. InAugust 2007 the average <strong>price</strong> paid forsecond time buyers was down 0.2%, whilethere was no change in the average <strong>price</strong>paid by first time buyers over the previousmonth. During the first nine months of thisyear <strong>price</strong>s were down by 3.8% and 5.2%respectively.House <strong>price</strong>s declined by 4.7% and 3.1%year on year to September 2007 forHouse <strong>price</strong>s for existing <strong>house</strong>s were downby 2.2% in September, while <strong>price</strong>s for new<strong>house</strong>s were unchanged. In August thisyear the relative <strong>price</strong> changes were (minus)0.4% each. During the first nine months ofthis year <strong>price</strong>s reduced by 5.5% and 1.9%respectively.Prices for new <strong>house</strong>s declined by 1.7%,while <strong>price</strong>s for second hand <strong>house</strong>sdeclined by 4.8% respectively year on yearto September 2007. The equivalent rates ofgrowth to August 2007 were minus 1.2%and minus 1.8% respectively.House <strong>price</strong>s in the commuter counties ofDublin rose slightly by 0.1% in September2007, compared to a reduction of 1.3% inAugust 2007. During the first nine monthsof this year <strong>price</strong>s reduced by 5.3%. Yearon year growth to September 2007 in theCommuter counties was (minus) 4.7%,compared with the (minus) 3.7% recordedin the 12 months to August 2007.The <strong>price</strong> of a <strong>house</strong> in the commutercounties in September 2007 was €325,813,down from €344,186 in December 2006.The average <strong>price</strong> paid for a <strong>house</strong> inDublin and outside Dublin in September2007 was €405,343 and €257,372respectively. The equivalent <strong>price</strong>s inDecember 2006 were €427,343 and€266,339.first-time and second-time buyersrespectively. The equivalent growthrates to August 2007 were (minus)2.4% and (minus) 2.0% respectively.The average <strong>price</strong> paid by a first-timebuyer and a second-time buyer inSeptember 2007 was €264,548 and€336,111 respectively. The equivalent<strong>price</strong>s in December 2006 were€279,003 and €349,213.The average <strong>price</strong> paid for a new <strong>house</strong>in September 2007 was €296,796,while that paid for a second hand <strong>house</strong>was €295,398. The equivalent levelsin December 2006 were €302,645and €312,709.3 bed semi-detached <strong>house</strong> <strong>price</strong>s grew by0.6% in September 2007, while in Augustthis year <strong>price</strong>s grew by 0.9%. During thefirst nine months of this year <strong>price</strong>s weredown by 2.9%.House <strong>price</strong>s in this category declined by2.4% year on year to September 2007compared with a reduction of 2.3% inthe year to August 2007. The <strong>price</strong> ofa 3 bedroom semi in September 2007was €302,982 - down from €311,906recorded in December 2006.Copies areavailable frompermanent tsbMarketing Dept.56-59 St. Stephen’s Green, Dublin 2or www.permanenttsb.ieNATIONALHOUSE PRICEINDEXQUARTER 3 2007NATIONAL PRICESAverage <strong>national</strong> <strong>house</strong> <strong>price</strong>sdeclined by 0.3% in September,according to the latest edition ofthe permanent tsb / ESRI HousePrice Index. This compares to adecline also of 0.3% in August.Measured over the past twelvemonths [September 2006 toSeptember 2007 inclusive], the<strong>index</strong> shows that average <strong>price</strong>sdeclined by 2.8%. Measured sincethe start of this year, that declinehas been 3.6%.The average <strong>price</strong> paid for a <strong>house</strong>in Ireland in September now standsat €299,483, compared with€308,179 in September last year.HIGHLIGHTS• Average <strong>national</strong> <strong>house</strong><strong>price</strong>s decline by 0.3%in September.• Year to date <strong>national</strong>decline of 3.6%The <strong>house</strong> <strong>price</strong> <strong>index</strong> measuresthe movement of <strong>house</strong> <strong>price</strong>s ona month by month basis. It isprepared by permanent tsb andthe ESRI and is considered themost accurate measure of <strong>house</strong><strong>price</strong> movements in the country.Commenting on the results, NiallO’Grady, Head of Marketing,permanent tsb said; “The datafor September confirms the trendof a modest decline in the overallproperty market. However thepicture in September does revealinconsistencies across the market,for example there was modestincreases in 3 bedroom semidetachedproperties and no changein the <strong>price</strong> of new homes.Anecdotally there is some evidencethat the <strong>price</strong>s of both are beingsupported by developers includingthings like add-ons in terms offit-out – improving the value topotential buyers.”METHODOLOGYNational House Prices1999 2000 2001 2002 2003 2004 2005 2006 2007Jan 122.0 145.9 175.9 180.1 207.5 235.2 255.1 281.2 311.1Feb 124.0 147.5 176.7 181.4 209.3 237.2 255.8 284.1 311.1Mar 125.5 150.3 179.0 184.7 211.5 238.8 256.7 287.7 309.1Apr 127.3 152.9 181.1 190.0 214.1 241.7 257.6 291.7 306.6May 128.9 155.6 181.9 190.9 217.8 242.9 258.9 296.4 304.2Jun 130.6 158.5 182.5 191.9 220.1 245.2 260.5 299.9 302.6Jul 133.4 161.5 184.3 192.6 222.6 247.3 262.7 303.3 301.3Aug 135.5 164.7 185.9 195.1 224.3 250.1 265.4 306.2 300.4Sep 137.3 165.5 185.6 198.0 225.4 252.4 268.0 308.2 299.5Oct 139.0 167.1 184.0 200.6 228.5 253.1 271.4 310.0Nov 141.4 170.4 183.3 203.4 231.1 253.8 274.5 310.4Dec 143.5 174.1 181.7 205.9 234.1 254.2 277.9 310.6Note above <strong>price</strong>s in €’000sThe methodology used to calculate the permanent tsbstandardised indices is applied separately toa) the samples of <strong>house</strong>s in Dublin and outside Dublin,b) the samples of New and Existing Houses,c) the samples of first-time and second-time buyers andd) the combined sample of ALL Houses.It is therefore possible for the percentage change for ALLHouses to be greater or less than the percentage changefor the sub-categories.
8354-<strong>house</strong><strong>price</strong> <strong>index</strong> 06/11/2007 14:14 Page 3REPUBLIC OF IRELANDREGIONAL HOUSE PRICE ANALYSIS1996/2003/2004/2005/2006Average House Prices1996 Growth 2003 Growth 2004 Growth 2005 Growth 2006€ ‘96-’03 € ‘03-’04 € ‘04-’05 € ‘05-’06 €Dublin* 92,342 233% 307,343 9% 334,822 10% 368,576 16% 427,343Wicklow 84,763 240% 287,801 9% 313,547 11% 347,158 12% 388,827Cork City 76,855 217% 243,766 13% 276,267 11% 306,117 14% 348,806Kildare 80,371 228% 263,610 10% 289,306 6% 307,589 10% 337,757Meath 86,152 180% 241,470 12% 269,606 10% 296,508 14% 336,959Cork County 73,114 198% 218,038 16% 252,850 12% 284,355 12% 317,973Galway 92,588 160% 240,831 11% 267,920 7% 286,478 10% 314,801Louth 66,753 210% 206,713 11% 228,943 14% 259,892 17% 303,533Wexford 65,953 188% 189,910 14% 216,673 13% 244,042 18% 289,128Kilkenny 72,218 191% 210,187 9% 228,282 14% 260,992 11% 288,554Monaghan 83,813 142% 202,725 13% 228,654 14% 260,559 10% 285,798Westmeath 67,922 189% 196,428 12% 220,864 11% 245,664 16% 284,036Waterford 64,609 213% 202,494 14% 229,873 6% 244,629 11% 271,324Kerry 67,874 183% 192,180 15% 220,484 15% 253,673 7% 270,492Clare 69,330 189% 200,195 10% 220,652 11% 244,415 8% 263,883Cavan 67,626 169% 181,683 14% 206,993 14% 236,749 11% 262,954Offaly 61,146 197% 181,852 15% 209,208 9% 227,470 15% 262,484Leitrim 66,077 173% 180,638 9% 196,800 2% 199,827 29% 257,816Sligo 75,801 178% 211,020 10% 231,582 4% 241,217 6% 256,602Laois 57,090 225% 185,415 15% 212,982 6% 225,231 14% 256,340Limerick 72,940 173% 199,092 9% 217,208 7% 231,332 10% 254,557Carlow 61,041 229% 200,719 9% 218,291 9% 237,685 7% 253,908Roscommon 75,129 148% 186,208 7% 198,533 12% 221,509 12% 247,087Mayo 69,838 160% 181,449 14% 207,091 11% 229,121 8% 246,460Tipperary 57,006 213% 178,501 12% 199,526 13% 225,415 9% 246,094Longford 67,986 169% 183,123 5% 193,106 11% 214,527 7% 230,096Donegal 61,463 181% 172,408 16% 199,973 3% 205,155 9% 223,237* Dublin city and county combined <strong>index</strong> <strong>price</strong>sAnalysis of 1st Time Buyers by RegionIndex levels 2003 = 100OutsideDublin QoQ YoY Dublin QoQ YoY2004Q4 274.1 -0.5% 9.5% 209.3 0.6% 8.3%2005Q1 278.7 1.7% 7.3% 210.6 0.7% 7.3%2005Q2 291.6 4.6% 10.0% 217.0 3.0% 7.7%2005Q3 296.2 1.6% 7.6% 223.3 2.9% 7.4%2005Q4 307.4 3.8% 12.2% 233.2 4.4% 11.5%2006Q1 323.2 5.1% 16.0% 239.9 2.9% 13.9%2006Q2 327.9 1.5% 12.5% 249.5 4.0% 15.0%2006Q3 341.2 4.1% 15.2% 255.9 2.5% 14.6%2006Q4 353.8 3.7% 15.1% 257.2 0.5% 10.3%2007Q1 350.4 -1.0% 8.4% 259.0 0.7% 8.0%2007Q2 344.9 -1.6% 5.2% 252.3 -2.6% 1.1%2007Q3 345.9 0.3% 1.4% 253.3 0.4% -1.0%Note above <strong>price</strong>s in €’000sAnalysis of 2nd Time Buyers by RegionIndex levels 2003 = 100OutsideDublin QoQ YoY Dublin QoQ YoY2004Q4 355.5 1.3% 7.4% 259.4 0.1% 9.7%2005Q1 360.6 1.4% 7.3% 262.2 1.1% 8.1%2005Q2 366.1 1.5% 6.8% 264.0 0.7% 5.0%2005Q3 376.6 2.9% 7.3% 271.5 2.8% 4.7%2005Q4 390.7 3.7% 9.9% 281.3 3.6% 8.4%2006Q1 406.4 4.0% 12.7% 293.5 4.4% 11.9%2006Q2 427.2 5.1% 16.7% 304.4 3.7% 15.3%2006Q3 445.4 4.3% 18.3% 312.3 2.6% 15.0%2006Q4 451.5 1.4% 15.6% 313.0 0.2% 11.3%2007Q1 457.6 1.3% 12.6% 311.4 -0.5% 6.1%2007Q2 446.7 -2.4% 4.6% 300.5 -3.5% -1.3%2007Q3 429.7 -3.8% -3.5% 301.7 0.4% -3.4%Note above <strong>price</strong>s in €’000sAnalysis of New Homes by RegionIndex levels 2003 = 100OutsideDublin QoQ YoY Dublin QoQ YoY2004Q4 301.9 0.0% 10.4% 210.9 0.4% 12.1%2005Q1 308.8 2.3% 7.4% 212.3 0.8% 9.0%2005Q2 318.9 3.3% 10.3% 216.6 2.1% 7.6%2005Q3 323.9 1.6% 7.3% 220.0 1.5% 4.8%2005Q4 324.9 0.3% 7.6% 231.9 5.5% 10.1%2006Q1 343.7 5.8% 11.3% 238.3 2.7% 12.2%2006Q2 350.0 1.8% 9.7% 245.7 3.1% 13.4%2006Q3 372.7 6.5% 15.1% 252.6 2.8% 14.9%2006Q4 383.7 2.9% 18.1% 251.2 -0.6% 8.3%2007Q1 379.8 -1.0% 10.5% 255.7 1.8% 7.3%2007Q2 371.7 -2.1% 6.2% 246.5 -3.6% 0.3%2007Q3 381.8 2.7% 2.5% 248.3 0.7% -1.7%Note above <strong>price</strong>s in €’000sAnalysis of Existing Houses by RegionIndex levels 2003 = 100OutsideDublin QoQ YoY Dublin QoQ YoY2004Q4 341.9 1.0% 7.5% 222.1 0.0% 8.7%2005Q1 346.4 1.4% 7.7% 224.2 1.0% 7.4%2005Q2 353.5 2.0% 6.9% 226.3 1.0% 4.8%2005Q3 363.4 2.8% 7.3% 234.3 3.5% 5.5%2005Q4 378.9 4.3% 10.9% 241.5 3.1% 8.8%2006Q1 394.5 4.1% 13.9% 252.0 4.4% 12.4%2006Q2 412.8 4.6% 16.8% 261.8 3.9% 15.6%2006Q3 429.3 4.0% 18.1% 269.5 3.0% 15.0%2006Q4 434.6 1.2% 14.7% 270.7 0.4% 12.1%2007Q1 442.9 1.9% 12.3% 267.8 -1.1% 6.3%2007Q2 429.9 -2.9% 4.1% 259.8 -3.0% -0.7%2007Q3 413.4 -3.8% -3.7% 259.8 0.0% -3.6%Note above <strong>price</strong>s in €’000s


