STOCKS TO WATCH - CommSec
STOCKS TO WATCH - CommSec
STOCKS TO WATCH - CommSec
- No tags were found...
You also want an ePaper? Increase the reach of your titles
YUMPU automatically turns print PDFs into web optimized ePapers that Google loves.
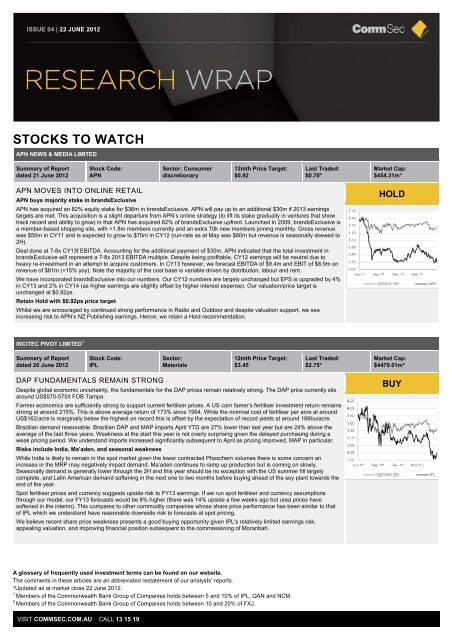
ISSUE 04 | 22 JUNE 2012QANTAS AIRWAYS LIMITED 1Summary of Reportdated 19 June 2012Stock Code:QANSector:Industrials12mth Price Target:$1.53Last Traded:$1.12*Market Cap:$2536.94m*DEFINING THE OBLIGATIONWe assess the risks associated with Qantas’ Defined Benefit Plan (DBP) superannuation scheme. We estimate the reporteddeficit on the Qantas DBP is likely to increase from $173m in FY11 to $471m at FY12f. The main driver of the expected higherreported deficit is an increase in the present value of the scheme’s liabilities to $2.6b. We estimate liabilities have increased$338m, from $2,274m, mostly due to lower bond yields. We anticipate the scheme’s $2.1b in assets has increased 1.5%,reflecting a 50% exposure to equities which have performed poorly since 30 June 2011.However cash impact likely smallerWe estimate that Qantas may need to contribute cash in coming years but the amount is likely to be significantly less than thereported DBP deficit. The process for determining required cash contributions requires actuarial review and the development of afunding plan. However future cash contributions do not depend on bond rates. As a result we don’t expect cash contributions tobe materially higher in the near term.Further pressure on credit metricsMoody’s treats the DBP deficit as if it was debt which will likely put further pressure on Qantas’ credit metrics. We estimate aDBP deficit of $471m would see FY12f Debt/EBITDA rise to 5.8x from 5.6x (already above the threshold of 4.5x). RCF/Net Debtwould fall from 19.0% to 18.5% but still above Moody’s 15.0% threshold. S&P adds 70% of the DBP deficit to its adjusted debtbringing FFO/debt close to the 20% lower rating threshold.The increased DBP deficit may have an impact on NTA per share, however the increased liability would have no impact on debtcovenants since Qantas’ debt is covenant free.Maintain HOLDQantas International will likely lose $450m in FY12f. Even if planned cost reductions take place we think it will take more thanthree years to break even given the deterioration in revenue. The Qantas balance sheet looks challenged to us. When demandrecovers and Qantas reinstates deferred capex, we expect the balance sheet to again come under scrutiny.HOLDFAIRFAX MEDIA LIMITED 2Summary of Reportdated 18 June 2012Stock Code:FXJSector: Consumerdiscretionary12mth Price Target:$0.74Last Traded:$0.58*Market Cap:$1364.13m*SECOND TRADE ME SELL DOWN AND MAJOR RESTRUCTUREFairfax’s changing faceFairfax has announced several structural changes, including changing the metro papers (The SMH and The Age) to tabloidformats, adopting digital subscriptions, and the closure of Chullora and Tullamarine printing plants. These are expected togenerate cost savings of $235m pa by FY15f. In addition, Fairfax has sold down its stake in Trade Me to 51% from 66%.Costs to be significantly re-basedFXJ expects to generate cost savings of $235m pa by FY15f (vs $170m previous target). Within that, 70% is expected to comeout of the Metros division, 10% from Regionals, 10% from NZ, 5% from Corporate and 50% from ‘Other’. Note $248m of one-offpre-tax cash costs are expected to be incurred to achieve those savings. We forecast group costs of $1.74b by FY15f (down from$1.86b in FY11) after inflation.Near-term EPS impact is minimal; EPS up 1.5% in FY12f and 0.5% in FY13f. However FY14f lifts by a greater 10%. Blendedvaluation lifts by 1% to $0.74psRetain HOLD with $0.74 price target (was $0.73)Despite valuation support, we expect revenue will remain under pressure given we are increasingly of the view that advertiserswill continue to re-allocate spend away from print within their ad budgets. We therefore see ongoing earnings risk (although weregard the cost restructures announced today as clearly positive).HOLDNEWCREST MINING 1Summary of Reportdated 18 June 2012Stock Code:NCMSector:Resources12mth Price Target:$32.04Last Traded:$23.05*Market Cap:$17633.25m*CASH FLOW POINTS <strong>TO</strong> HIGHER DIVIDEND AND RE-RATINGWe expect significant volume growth and reduced growth capex from FY13f are set to generate large surplus free cash flows,increasing NCM’s capacity to pay higher and/or special dividends. We believe returning funds to shareholders ahead of long-termgrowth project funding could provide a major share-price catalyst.On our estimates NCM has capacity to increase its dividend yield above its global peers whilst operating within its policy target of15% gearing and maintaining its BBB+/Baa2 credit ratings.Dividends could lead to a re-rate. A consistent theme across the resource sector for the past 12-18 months has been forincreased shareholder returns. Newmont announced an enhanced dividend policy in April 2011 linking quarterly dividendpayments to the gold price. Over the next six months Newmont outperformed its global peers by over 19% and NCM by 38%,respectively.Maintain BuyDisappointing operating performance in FY12 and the recent cooling off in the gold price has dampened investor confidence inNCM. We are believers in NCM’s near-term earnings growth through key development assets and see strong free cash flows inthe short term. We believe the current share price presents an excellent buying opportunity against our AUD32.04 price target.BUYVISIT COMMSEC.COM.AU CALL 13 15 19
ISSUE 04 | 22 JUNE 2012LEIGH<strong>TO</strong>N HOLDINGS LIMITEDSummary of Reportdated 15 June 2012Stock Code:LEISector:Industrials12mth Price Target:$24.22Last Traded:$16.69*Market Cap:$5625.99m*GORGON FEARS REDUCEDLEI announced the value of the Gorgon jetty and marine structures contract, held by the Leighton Contractors/Saipemconsortium, has been increased to $1.85b.Negative share price catalyst removed. A number of market participants had previously identified the Gorgon jetty project as thenext problem project for LEI. In our view today’s announcement likely means the probability of the Gorgon Jetty being a lossmaking project has significantly diminished. While it is likely costs have exceeded original estimates, we think a negotiationprocess between LEI and the client has completed and resulted in legitimate extensions/variations being paid.Vic DeSal remains a risk, but more than priced in. Key risks are the commissioning phase of Vic Desal, however given theliquidated damages cap, we only see ~$100m downside here. The deterioration at Vic Desal announced in March of $148m likelycovered material costs. Labour costs will be limited due to the site being largely demobilised. In the absence of the plant notworking, we see downside past $100m less likely.Maintain BuyThe stock is not without risk, but many are more quantifiable with some work. At ~8.5x FY13f EPS, we believe there is already ahigh degree of earnings loss priced into the stock at these levels from projects that should finish in the next 6 8 months.Capitalising this risk is overdone in our view.BUYVISIT COMMSEC.COM.AU CALL 13 15 19
ISSUE 04 | 22 JUNE 2012All market data in this section is as at market close 22 June 2012 unless otherwise statedECONOMIC FORECASTS2009/10 (actual) 2010/11 (actual) 2011/12 (forecast) 2012/13 (forecast)Economic growth (annual %) 2.3 2.1 3.0 3.5Inflation (CPI, average annual %) 2.3 3.1 2.75 2.75Unemployment rate (end June %) 5.2 5.0 5.4 4.8Current June 21 2012 End Jun (forecast) End Sep (forecast) End Dec (forecast)90 day bills (%) 3.54 3.40 3.30 3.1010 year bonds (%) 3.06 2.80 2.60 2.50AUD/USD 1.0164 0.9800 1.0300 1.0500All Ordinaries index 4133.7 4250 4450 4650DIVIDEND DATESStock Code Company Name Ex-Dividend Date Dividend Amount Last Traded Record Date Date PayableAAD Ardent Leisure Group 25 June 5.2 cents $1.325 29 June 31 AugustABW Aurora Absolute 25 June 2.2 cents $1.10 29 June 24 AugustAEU Australian Education 25 June 2.65 cents $1.05 29 June 20 JulyAGJ Agricultural Land 25 June 3.18 cents $1.70 29 June 8 OctoberAIX Australian Infrastr. 25 June 5.5 cents $2.29 29 June 30 AugustAJA Astro Jap Prop Group 25 June 5 cents $2.84 29 June 31 AugustALZ Australand Property 25 June 10.5 cents $2.54 29 June 7 AugustAOD Aurora Sandringham 25 June 1.5 cents $0.935 29 June 25 AugustAPA APA Group 25 June 18 cents $5.10 29 June 14 SeptemberAUP Aurora Property 25 June 10 cents $5.13 29 June 14 SeptemberAYF Australian Enhanced 25 June 11.25 cents $6.04 29 June 16 JulyAZF Aus Social Infr Fund 25 June 4 cents $1.80 29 June 20 JulyBPA Brookfield Prime 25 June 2 cents $4.15 29 June 31 JulyBWP BWP Trust 25 June 6.83 cents $1.945 29 June 29 AugustBWP BWP Trust (S) 25 June 1.17 cents $1.945 29 June 29 AugustCDI Challenger Div.Pro. 25 June 2.15 cents $0.560 29 June 30 AugustCDP Carindale Property 25 June 13.9 cents $4.60 29 June 31 AugustCFX CFS Retail Trust Grp 25 June 6.6 cents $1.905 29 June 28 AugustCHC Charter Hall Group 25 June 9.1 cents $2.33 29 June 28 AugustCIF Challenger Infrast. 25 June 5 cents $1.21 29 June 30 AugustCMW Cromwell Prop 25 June 1.75 cents $0.700 29 June 16 AugustCPA Commonwealth Prop 25 June 3.2 cents $1.01 29 June 28 AugustCQR Charter Hall Retail 25 June 13.1 cents $3.42 29 June 21 AugustCRF Centro Retail Aust 25 June 6.5 cents $2.00 29 June 28 AugustDUE Duet Group 25 June 8 cents $1.93 29 June 14 AugustDXS Dexus Property Group 25 June 2.68 cents $9.3 29 June 31 AugustEPX Ethane Pipeline 25 June 4.15 cents $2.27 29 June 13 JulyFKP FKP Property Group 25 June 1.4 cents $0.41 29 June 28 SeptemberGEM G8 Education Limited 25 June 1.5 cents $9.3 29 June 9 JulyGHC Gen Healthcare REIT 25 June 3.34 cents $0.85 29 June 31 AugustGMG Goodman Group 25 June 9 cents $3.55 29 June 27 AugustGOZ Growthpoint Property 25 June 8.9 cents $2.17 29 June 31 AugustVISIT COMMSEC.COM.AU CALL 13 15 19
ISSUE 04 | 22 JUNE 2012Stock Code Company Name Ex-Dividend Date Dividend Amount Last Traded Record Date Date PayableGOZNA Growthpoint Property - Stapled New 25 June 7.6 cents $2.10 29 June 31 AugustHDF Hastings Diversified 25 June 2.5 cents $2.41 29 June 6 AugustHHY Hastings High Yield 25 June 3.75 cents $1.27 29 June 24 AugustHNG HGL Limited 25 June 4 cents $0.87 29 June 13 JulyIOF Investa Office Fund 25 June 7.8 cents $2.69 29 June 31 AugustIOF Investa Office Fund (S) 25 June 1.9 cents $2.69 29 June 31 AugustJHX James Hardie Industries 25 June 38 cents $7.57 29 June 23 JulyLEP ALE Property Group 25 June 8 cents $2.23 29 June 5 SeptemberLRF LinQ Resources Fund 25 June 2.5 cents $0.525 29 June 31 AugustMGR Mirvac Group 25 June 2.4 cents $1.245 29 June 27 JulyOZF SPDR 200 Financials 25 June 0 cents $13.47 29 June 9 JulyOZR SPDR 200 Resources 25 June 0 cents $9.66 29 June 9 JulyRCT Reef Casino Trust 25 June 9 cents $2.32 29 June 20 SeptemberSFY SPDR 50 Fund 25 June 0 cents $40.10 29 June 9 JulySGP Stockland 25 June 12 cents $3.29 29 June 31 AugustSLF SPDR S&P/ASX Prop Fu 25 June 0 cents $7.94 29 June 28 AugustSSO SPDR Small Ords 25 June 0 cents $11.57 29 June 9 JulySTW SPDR 200 Fund 25 June 0 cents $38.46 29 June 9 JulySYD SYD Airport 25 June 11 cents $2.93 29 June 16 AugustSYI Spdrmsciauselecthdy 25 June 0 cents $22.40 29 June 9 JulyTCL Transurban Group 25 June 15 cents $5.74 29 June 14 AugustVBP Van Eyk Blueprint 25 June 53 cents $7.49 29 June 26 JulyTJN Trojan Equity 27 June 13.5 cents $0.545 3 July 10 July<strong>TO</strong>P 200: MOVERS AND SHAKERS<strong>TO</strong>P 5 BOT<strong>TO</strong>M 5No.ASXCodeCompanyMarketCap($m)ThisWeek’sprice ($)LastWeek’sprice ($)Change No. ASXCodeCompanyMarketCap ($m)ThisWeek’sprice ($)LastWeek’sprice ($)Change1. EWC Energy World CorporationLimited650.31 0.38 0.34 10.29% 1. AQP Aquarius PlatinumLimited357.44 0.76 0.92 -17.84%2. LYC LYNAS CORP LTD 1620.53 0.95 0.88 7.39% 2. SXY SENEX ENERGY 812.16 0.76 0.88 -13.19%3. MSB MESOBLAST LTD 1681.27 5.91 5.53 6.87% 3. GCL GLOUCESTER COAL 835.54 3.82 4.36 -12.39%4. CDU Cudeco Limited 597.83 3.16 2.96 6.76% 4. AQG Alacer Gold Corp 527.31 5.71 6.47 -11.75%5. SVW Seven Group Holdings 2490.02 8.10 7.68 5.47% 5. CPL Coalspur Mines Limited 468.65 0.76 0.85 -11.70%CORPORATE AND ECONOMIC CALENDARWEEK BEGINNING 25 JUNE 2012AUSTRALIAOVERSEAS26 June Reserve Bank speech 25 June US New home sales (May)28 June Financial accounts (March quarter) 26 June US Home prices (April)28 June Job vacancies (May) 26 June US Richmond Fed index (June)28 June New home sales (May) 27 June US Durable goods orders (May)29 June Private sector credit (May) 27 June US Pending home sales (May)28 June US Economic growth (March qtr)29 June US Personal income (May)VISIT COMMSEC.COM.AU CALL 13 15 19
ISSUE 04 | 22 JUNE 2012Current recommendation definitionsCommonwealth Bank of Australia ABN 48 123 123 124 AFSL 234945 (“the Bank”) investment recommendations are determined by the covering analyst and reflect theanalyst’s assessment of a stock’s expected total shareholder return (TSR). TSR is calculated as the difference between the analyst’s 12-month price target and thecurrent share price plus the forecast dividend yield.Buy: Stocks with a Buy recommendation represent the most attractive stocks under the analyst’s coverage. They are forecast to generate significantly positive expectedtotal shareholder returns.Hold: Stocks with a Hold recommendation are less attractive than stocks with a Buy recommendation. They are forecast to generate flat to slightly positive expected totalshareholder returns.Sell: Stocks with a Sell recommendation are the least attractive stocks. They are forecast to generate flat or negative expected total shareholder returns.Note: the Bank’s previous recommendations prior to 25 January 2010 were:Short term (over 6 months): Buy – appreciate by >10%, Accumulate – increase between 2% and 10%, Reduce – increase by less than 2% or fall by up to 5%,Sell – fallby >5%.Long term (24 months) Outperform (O / P) – exceed market return by >5%, Market Perform (M / P) – be in line with market return, +/-5%, Under Perform (U / P) – be lessthan market return by >5%.Disclosure and Important InformationThis summary is based on information contained in the research reports published, approved and distributed by the Bank. This document is a summary of the reportspreviously produced by the Bank and is distributed by Commonwealth Securities Limited ABN 60 067 254 399 AFSL 238814 (“<strong>CommSec</strong>”), a wholly owned, but nonguaranteed,subsidiary of the Bank, and both are incorporated in Australia with limited liability. <strong>CommSec</strong> Research is a unit of the Bank.Analyst Certification: Each research analyst, primarily responsible for the research report of which this summary is based upon (“report”), in whole or in part, certifies thatwith respect to each security or issuer that the analyst covered in the report, (1) all the views expressed accurately reflect his or her personal views about those securitiesor issuers; and (2) no part of his or her compensation was, is, or will be, directly or indirectly, related to the specific recommendations or views expressed by thatresearch analyst in the report. That analyst(s) responsible for the preparation of the report may interact with the trading desk personnel, sales personnel and otherconstituencies for the purpose of gathering, synthesizing, and interpreting market information. Directors or employees of the Bank may serve or may have served asofficers or directors of the subject company in the report. The compensation of analysts who prepared the report is determined exclusively by research management andsenior management (not including investment banking). No inducement has been or will be received by the Bank from the subject of the report or its associates toundertake research or make the recommendations. The research staff responsible for the report receive a salary and a bonus that is dependent on a number of factors,including their performance and the overall financial performance of the Bank, including its profits derived from investment banking, sales and trading revenue.This document has been prepared without taking account of the objectives, financial situation or needs of any particular individual. Any individual should, before actingon the information in this document, consider the appropriateness of the information, having regard to the individual's objectives, financial situation and needs and, ifnecessary, seek appropriate professional advice.We believe that the information in this document is correct and any opinions, conclusions or recommendations are reasonably held or made, based on the informationavailable at the time of its compilation, but no warranty is made as to accuracy, reliability or completeness of any statement in the report. Any opinions, conclusions orrecommendations set forth in the report are subject to change without notice and may differ or be contrary to the opinions, conclusions or recommendations expressedelsewhere by the Bank. We are under no obligation to, and do not, update and keep current the information contained in the report. The Bank does not accept anyliability for any loss or damage arising out of the use of all or any part of the report. Any valuations, projections and forecasts contained in this document are based on anumber of assumptions and estimates and are subject to contingencies and uncertainties. Different assumptions and estimates could result in materially different results.The Bank does not represent or warrant that any of these valuations, projections, forecasts or any of the underlying assumptions or estimates will be met. The Bank hasprovided, provides or seeks to provide, investment banking, capital markets and/or other services, including financial services, to the companies described in the reportand their associates.To the extent permitted by law, the Bank does not accept liability to any person for loss or damage arising from the use of this document. Any valuations, projections andforecasts contained in this document are based on a number of assumptions and estimates and are subject to contingencies and uncertainties. The inclusion of anysuch valuations, projections and forecasts in this document should not be regarded as a representation or warranty by or on behalf of the Bank or any other person thatsuch valuations, projections and forecasts or their underlying assumptions and estimates will be met. Past performance is not a reliable indicator of future performance.The Bank have effected or may effect transactions for their own account in any investments or related investments referred to in this document, including selling to orbuying from clients on a principal basis. The Bank may engage in transactions in a manner inconsistent with this research document. In the case of certain productsthe Bank is or may be the only market maker.This document is not directed to, or intended for distribution to or use by, any person or entity who is a citizen or resident of or located in any locality, state, country orother jurisdiction where such distribution, publication, availability or use would be contrary to law or regulation or which would subject the Bank to any registration orlicensing requirement within such jurisdiction. All material presented in this document, unless specifically indicated otherwise, is under copyright to the Bank. None ofthe material, nor its content, nor any copy of it, may be altered in any way, transmitted to, copied or distributed to any other party, without the prior express writtenpermission of the Bank.More information on our research methodology, organisation structure, summary documenting frequency and recommendations can be obtained atresearch.commsec.com.auUnless agreed separately, we do not charge any fee for any information provided in this document. You may be charged fees in relation to the financial products or otherservices <strong>CommSec</strong> provides, these are set out in the <strong>CommSec</strong> Financial Services Guide (FSG) and relevant Product Disclosure Statements (PDS). Our employeesmay be eligible for an annual bonus payment. Some representatives’ bonus payments may be up to 50% of initial fees, and 10% of ongoing fees and commissions that<strong>CommSec</strong> receives from the placement of a financial product. Bonus payments are discretionary and based on objectives that include business outcomes, customerservice, people engagement, special tasks and people principals. Our employees may also receive benefits such as tickets to sporting and cultural events, corporatepromotional merchandise and other similar benefits. If you have a complaint, <strong>CommSec</strong>’s dispute resolution process can be accessed on 13 15 19.VISIT COMMSEC.COM.AU CALL 13 15 19


