Business and Private Banking - CommSec
Business and Private Banking - CommSec
Business and Private Banking - CommSec
- No tags were found...

You also want an ePaper? Increase the reach of your titles
YUMPU automatically turns print PDFs into web optimized ePapers that Google loves.
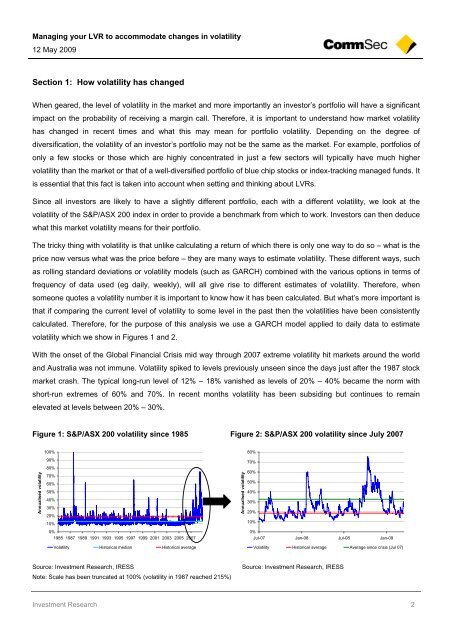
Managing your LVR to accommodate changes in volatility12 May 2009Section 1: How volatility has changedWhen geared, the level of volatility in the market <strong>and</strong> more importantly an investor’s portfolio will have a significantimpact on the probability of receiving a margin call. Therefore, it is important to underst<strong>and</strong> how market volatilityhas changed in recent times <strong>and</strong> what this may mean for portfolio volatility. Depending on the degree ofdiversification, the volatility of an investor’s portfolio may not be the same as the market. For example, portfolios ofonly a few stocks or those which are highly concentrated in just a few sectors will typically have much highervolatility than the market or that of a well-diversified portfolio of blue chip stocks or index-tracking managed funds. Itis essential that this fact is taken into account when setting <strong>and</strong> thinking about LVRs.Since all investors are likely to have a slightly different portfolio, each with a different volatility, we look at thevolatility of the S&P/ASX 200 index in order to provide a benchmark from which to work. Investors can then deducewhat this market volatility means for their portfolio.The tricky thing with volatility is that unlike calculating a return of which there is only one way to do so – what is theprice now versus what was the price before – they are many ways to estimate volatility. These different ways, suchas rolling st<strong>and</strong>ard deviations or volatility models (such as GARCH) combined with the various options in terms offrequency of data used (eg daily, weekly), will all give rise to different estimates of volatility. Therefore, whensomeone quotes a volatility number it is important to know how it has been calculated. But what’s more important isthat if comparing the current level of volatility to some level in the past then the volatilities have been consistentlycalculated. Therefore, for the purpose of this analysis we use a GARCH model applied to daily data to estimatevolatility which we show in Figures 1 <strong>and</strong> 2.With the onset of the Global Financial Crisis mid way through 2007 extreme volatility hit markets around the world<strong>and</strong> Australia was not immune. Volatility spiked to levels previously unseen since the days just after the 1987 stockmarket crash. The typical long-run level of 12% – 18% vanished as levels of 20% – 40% became the norm withshort-run extremes of 60% <strong>and</strong> 70%. In recent months volatility has been subsiding but continues to remainelevated at levels between 20% – 30%.Figure 1: S&P/ASX 200 volatility since 1985 Figure 2: S&P/ASX 200 volatility since July 2007Annualised volatility100%90%80%70%60%50%40%30%20%10%0%1985 1987 1989 1991 1993 1995 1997 1999 2001 2003 2005 2007Volatility Historical median Historical averageAnnualised volatility80%70%60%50%40%30%20%10%0%Jul-07 Jan-08 Jul-08 Jan-09Volatility Historical average Average since crisis (Jul 07)Source: Investment Research, IRESSNote: Scale has been truncated at 100% (volatility in 1987 reached 215%)Source: Investment Research, IRESSInvestment Research 2