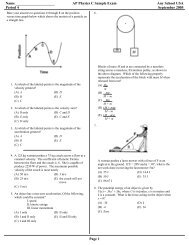
Wizard Test Maker - Eduware
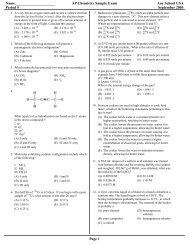
Wizard Test Maker - Eduware
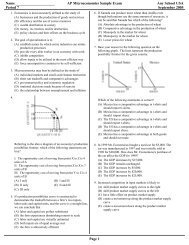
Wizard Test Maker - Eduware
- No tags were found...

You also want an ePaper? Increase the reach of your titles
YUMPU automatically turns print PDFs into web optimized ePapers that Google loves.
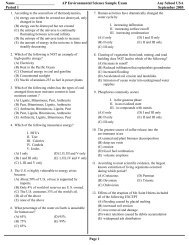
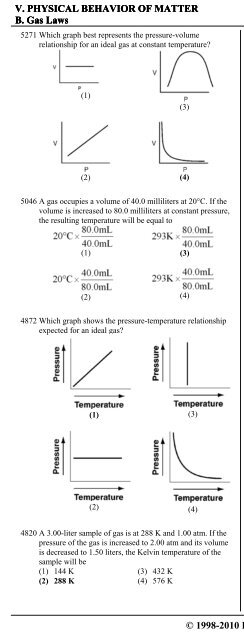
V. PHYSICAL BEHAVIOR OF MATTER 3. Properties of GasesB. Gas Laws ii. Combined Gas Law Problems5271 Which graph best represents the pressure-volumerelationship for an ideal gas at constant temperature?(1)(2)(3)(4)4803 Which temperature change would cause the volume of asample of an ideal gas to double when the pressure of thesample remains the same?(1) from 200ºC to 400ºC (3) from 200 K to 400 K(2) from 400ºC to 200ºC (4) from 400 K to 200 K4798 As the temperature of a gas increases at constant pressure,the volume of the gas(1) decreases (3) remains the same(2) increases4688 Which graph best shows the relationship between thepressure of a gas and its average kinetic energy at constantvolume?(1)5046 A gas occupies a volume of 40.0 milliliters at 20°C. If thevolume is increased to 80.0 milliliters at constant pressure,the resulting temperature will be equal to(1)(3)(2)(2)(4)4872 Which graph shows the pressure-temperature relationshipexpected for an ideal gas?(3)(1)(3)(4)(2)(4)4820 A 3.00-liter sample of gas is at 288 K and 1.00 atm. If thepressure of the gas is increased to 2.00 atm and its volumeis decreased to 1.50 liters, the Kelvin temperature of thesample will be(1) 144 K (3) 432 K(2) 288 K (4) 576 K4415 As the temperature of a given sample of a gas decreases atconstant pressure, the volume of the gas(1) decreases (3) remains the same(2) increases© 1998-2010 <strong>Eduware</strong>, Inc. 183