EX-POST EVALUATION of the ESF (2000-2006) - ES fondi
EX-POST EVALUATION of the ESF (2000-2006) - ES fondi
EX-POST EVALUATION of the ESF (2000-2006) - ES fondi
- No tags were found...

You also want an ePaper? Increase the reach of your titles
YUMPU automatically turns print PDFs into web optimized ePapers that Google loves.
European Social Fund:<strong>the</strong> importance <strong>of</strong> EvaluationPaolo PASIMENIEuropean CommissionDirectorate General for Employment, Social Affairs and InclusionUnit "Evaluation and Impact Assessment"Riga, 11 May 2011
<strong>EVALUATION</strong>Past: lessons from ex-post <strong>2000</strong>-<strong>2006</strong>Present: improvements & problems in 2007-2013Future: ideas for <strong>the</strong> post-2013 programming period2
<strong>EX</strong>-<strong>POST</strong> <strong>EVALUATION</strong> <strong>of</strong> <strong>the</strong> <strong><strong>ES</strong>F</strong> (<strong>2000</strong>-<strong>2006</strong>):Resources• More than €120 billion spent• More than 75 million individuals reached• 1.7 million organizations supported• <strong><strong>ES</strong>F</strong> mostly targeted at unemployed, young and excluded• <strong><strong>ES</strong>F</strong> mainly contributed to E<strong>ES</strong> guideline 17 «implementemployment policies» (33%) and guideline 23 «investment inhuman capital» (29%)• Final recipients mainly reached through training (40%) andcounselling (21%)4
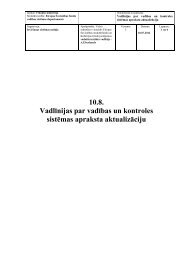
<strong>EX</strong>-<strong>POST</strong> <strong>EVALUATION</strong> <strong>of</strong> <strong>the</strong> <strong><strong>ES</strong>F</strong> (<strong>2000</strong>-<strong>2006</strong>):ResourcesSources <strong>of</strong> funding<strong><strong>ES</strong>F</strong> expediture National public National private100%80%60%40%20%0%GreeceHungaryLatviaSloveniaMaltaLithuaniaPolandEU10SlovakiaCzech RepEstoniaPortugalSpainIrelandItalyEU25EU15CyprusNe<strong>the</strong>rlandsGermanyLuxemburgUKAustriaFrance5DenmarkBelgiumSwedenFinland
<strong>EX</strong>-<strong>POST</strong> <strong>EVALUATION</strong> <strong>of</strong> <strong>the</strong> <strong><strong>ES</strong>F</strong> (<strong>2000</strong>-<strong>2006</strong>):ResourcesYearly <strong><strong>ES</strong>F</strong> Community expenditure as a percentage <strong>of</strong> public money spent on Labour Market policies6
<strong>EX</strong>-<strong>POST</strong> <strong>EVALUATION</strong> <strong>of</strong> <strong>the</strong> <strong><strong>ES</strong>F</strong> (<strong>2000</strong>-<strong>2006</strong>):Policy areas• The <strong><strong>ES</strong>F</strong> contributed to bridging <strong>the</strong> gap between educationsystem and labour market• Adaptability measures mainly targeted employed individuals• The <strong><strong>ES</strong>F</strong> contributed to increase employment and betterlabour market operation• Social inclusion received very strong support by <strong>the</strong> <strong><strong>ES</strong>F</strong>• The greatest <strong><strong>ES</strong>F</strong> impact was at ‘meso’ and micro-level• The <strong><strong>ES</strong>F</strong> contributed to <strong>the</strong> improvemement in <strong>the</strong> status <strong>of</strong>women in <strong>the</strong> labour market7
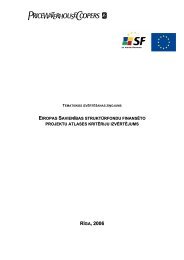
<strong><strong>ES</strong>F</strong> expenditureper E<strong>ES</strong> GuidelineEstimated distribution <strong>of</strong> <strong><strong>ES</strong>F</strong> expenditure by E<strong>ES</strong> Guidelines normalized to 100%, %, <strong>2000</strong>-<strong>2006</strong>5.0%4.0% 0.3%8.0%33.0%9.0%Implement employment policiesInvest in human capital12.0%Ensure inclusive labour marketsAdapt education & training systemsPromote a lifecycle approach to workMatching <strong>of</strong> labour market needsPromote flexicurity29.0%Ensure employment-friendly wages8
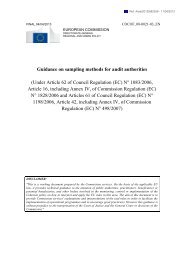
<strong><strong>ES</strong>F</strong> expenditureper instrumentEstimated distribution <strong>of</strong> <strong><strong>ES</strong>F</strong> expenditure per instrument, %, <strong>2000</strong>-<strong>2006</strong>6%7%12%40%TrainingCounsellingInformationPlacementMobilityEngineering15%21%9
Lessons from ex-post <strong>2000</strong>-<strong>2006</strong>for monitoring and evaluationUneven quality <strong>of</strong> data and data collection methods: missing dataNo information about aid-intensityInterpretation <strong>of</strong> indicators not always consistent within a MSIndicators do not always cover all programme priorities to <strong>the</strong> sameextentIndicators cannot be aggregated at EU levelQuality, methodology and scope <strong>of</strong> evaluation vary substantiallybetween MSLimited knowledge <strong>of</strong> Member States’ evaluation at EU level (exceptMTE)10
Improvements in 2007-2013:Monitoring• SFC2007 includes data on participantsBut:• Data quality remains uneven• Data collection methods vary greatly• No information about intensity <strong>of</strong> support <strong>of</strong> individuals11
Improvements in 2007-2013:Indicators• Common output indicators (Annex XXIII) which can beaggregatedBut:• More than 7000 programme indicators• Result indicators <strong>of</strong>ten capture only immediate effects12
Improvements in 2007-2013:Evaluation• On-going evaluation in MSBut:• Evaluation plan only in convergence regions• Substantial variations between MS in quality, frequency,methodology and scope <strong>of</strong> evaluations• Limited knowledge <strong>of</strong> MS evaluations at EU level13
THE FUTURE – post 2013Political call: more result than input orientation– Good indicators– Reliable monitoring– Relevant evaluationsEurope 2020 strategy:– Common priorities– Clear framework for priority setting– Logic <strong>of</strong> intervention and link with NRPLearn from <strong>the</strong> past:– Ex-post evaluation <strong>2000</strong>-<strong>2006</strong>– Experience with current programming period14
PROGRAMMINGMore syn<strong>the</strong>tic programmesShowing a clear logic <strong>of</strong> intervention(linking European priorities, national/regional needs, actionsforeseen to address <strong>the</strong>se needs, expected results, financialallocations)Including appropriate indicatorsAnd description <strong>of</strong> means and timing <strong>of</strong> data collection15
MONITORING• Limited number <strong>of</strong> Fund-specific common indicators for all OPs– Output (based on simplified Annex XXIII)– Result indicators capturing direct effects– Common definitions– Reporting in AIR part <strong>of</strong> admissibility check+ OP specific indicators – as to date• Micro-data collection16
<strong>EVALUATION</strong><strong>EX</strong>-ANTE:• Serve as basis for negotiating OPs• Justification for <strong>the</strong> selected priorities• Consistency between resources allocated and needsassessment based on <strong>the</strong> NRPONGOING:• Support implementation and refine strategies• Analyse longer term effects (integrate counterfactual andqualitative methods)<strong>EX</strong>-<strong>POST</strong>:• Syn<strong>the</strong>sis evaluation for each OP: relevant findings <strong>of</strong> allevaluations carried out during <strong>the</strong> programming period 17
THANK YOU !Paolo.Pasimeni@ec.europa.eu18