

Madhya Pradesh - DISE
Madhya Pradesh - DISE
Madhya Pradesh - DISE
- No tags were found...

Create successful ePaper yourself
Turn your PDF publications into a flip-book with our unique Google optimized e-Paper software.
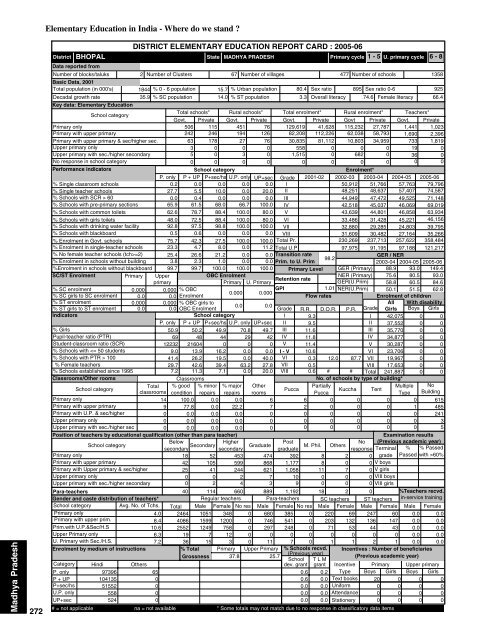
<strong>Madhya</strong> <strong>Pradesh</strong>272Elementary Education in India - Where do we stand ?BHOPALDistrictData reported fromNumber of blocks/taluksBasic Data, 2001Total population (in 000's)Decadal growth ratePara-teachersGender and caste distribution of teachers*School categoryAvg. No. of Tchs.Primary only4.0Primary with upper prim.8.4Prim.with U.P.&Sec/H.S10.6Upper Primary only6.3U. Primary with Sec./H.S.7.2Enrolment by medium of instructionsDISTRICT ELEMENTARY EDUCATION REPORT CARD : 2005-06State2 Number of Clusters 67 Number of villages477 Number of schools13581844 % 0 - 6 population 15.7 % Urban population 80.4 Sex ratio 895 Sex ratio 0-692535.9 % SC population 14.0 % ST population3.3 Overall literacy 74.6 Female literacy 66.436 15% TotalGrossnessPrimary cycle 1 - 5 U. primary cycle 6 - 8Key data: Elementary EducationSchool categoryTotal schools* Rural schools* Total enrolment* Rural enrolment* Teachers*Govt. Private Govt. Private Govt. Private Govt Private Govt. PrivatePrimary only506 115 451 76 129,619 41,628 115,232 27,787 1,441 1,023Primary with upper primary242 246 194 126 82,208 112,226 62,038 58,793 1,690 2,396Primary with upper primary & sec/higher sec.63 178 27 76 30,835 81,112 10,803 34,959 733 1,819Upper primary only3 0 0 0 558 0 0 0 19 0Upper primary with sec./higher secondary5 0 3 0 1,515 0 682 0 36 0No response in school category0 0 0 0 0 0 0 0 0 0Performance indicatorsSchool categoryEnrolment*P. only P + UP P+sec/hs U.P. only UP+sec Grade 2001-02 2002-03 2003-04 2004-05 2005-06% Single classroom schools0.2 0.0 0.0 0.0 0.0 I50,912 51,766 57,763 79,796% Single teacher schools27.7 5.5 10.0 0.0 20.0 II48,251 48,637 57,407 74,587% Schools with SCR > 600.0 0.4 0.0 0.0 0.0 III44,949 47,472 49,525 71,148% Schools with pre-primary sections 65.9 61.5 68.0 66.7 100.0 IV42,518 45,037 46,069 69,019% Schools with common toilets 62.6 78.7 88.4 100.0 80.0 V43,639 44,801 46,858 63,934% Schools with girls toilets 48.0 72.5 88.4 100.0 80.0 VI33,486 31,428 45,221 46,156% Schools with drinking water facility 92.8 97.5 98.8 100.0 100.0 VII32,880 29,285 24,803 39,795% Schools with blackboard0.5 0.6 0.0 0.0 0.0 VIII 31,609 30,482 27,164 35,266% Enrolment in Govt. schools 75.7 42.3 27.5 100.0 100.0 Total Pr. 230,269 237,713 257,622 358,484% Enrolment in single-teacher schools 23.3 4.7 8.0 0.0 11.2 Total U.P97,975 91,195 97,188 121,217% No female teacher schools (tch>=2) 25.4 26.6 21.2 0.0 0.0 Transition rateGER / NER98.2% Enrolment in schools without building 3.8 2.3 1.0 0.0 0.0 Prim. to U. Prim2003-04 2004-05 2005-06%Enrolment in schools without blackboard 99.7 99.7 100.0 100.0 100.0 Primary Level GER (Primary) 88.9 93.0 149.4SC/ST EnrolmentPrimary UpperOBC EnrolmentNER (Primary) 75.6 80.5 93.0Retention rateprimaryPrimary U. PrimaryGER(U.Prim) 58.8 60.5 84.6% SC enrolment0.000 0.000 % OBCGPI1.01 NER(U.Prim) 50.1 51.5 62.80.000 0.000% SC girls to SC enrolment 0.0 0.0 EnrolmentFlow ratesEnrolment of children% ST enrolment0.000 0.000 % OBC girls toAll With disability0.0 0.0% ST girls to ST enrolment 0.0 0.0 OBC EnrolmentGrade R.R. D.O.R. P.R. Grade Girls Boys GirlsIndicatorsSchool categoryI 9.3I 42,075 0 0P. only P + UP P+sec/hs U.P. only UP+sec II 9.5II 37,552 0 0% Girls50.9 50.2 49.9 70.8 49.7 III 11.6III 35,770 0 0Pupil-teacher ratio (PTR)69 48 44 29 42 IV 11.8IV 34,877 0 0Student-classroom ratio (SCR)12232 21604 0 0 0 V 11.4V 30,287 0 0% Schools with 10041.4 26.2 19.5 0.0 40.0 VI 0.3 12.0 87.7 VII 19,967 0 0% Female teachers29.7 42.6 39.4 63.2 27.8 VII 0.5VIII 17,653 0 0% Schools established since 19957.2 11.3 7.1 0.0 20.0 VIII 0.6 # # Total 241,887 0 0Classrooms/Other roomsClassroomsNo. of schools by type of building*School categoryTotal % good % minor % major OtherPartiallyMultiple NoPuccaKuccha Tentclassrooms condition repairs repairs roomsPuccaType BuildingPrimary only14 100.0 0.0 0.06 6 0 0 0 0 615Primary with upper primary9 77.8 0.0 22.272 0 0 0 1 485Primary with U.P. & sec/higher0 0.0 0.0 0.000 0 0 0 0 241Upper primary only0 0.0 0.0 0.000 0 0 0 0 3Upper primary with sec./higher sec0 0.0 0.0 0.000 0 0 0 0 5Position of teachers by educational qualification (other than para teacher)Examination resultsSchool category BelowHigherPost(Previous academic year)M. Phil.secondarysecondarygraduateNoresponse Terminal % % Passed18 52 453 474 392 8 2 0 grade Passed with >60%V boysPrimary onlyPrimary with upper primaryPrimary with Upper primary & sec/higherUpper primary onlyUpper primary with sec./higher secondaryCategoryP. onlyP + UPP+sec/hsU.P. onlyUP+secHindi9739610413551552558524Others65000042 105 599 868 1,177 8 0 025 41 244 621 1,058 11 7 0 V girls0 0 2 7 10 0 0 0 VIII boys0 2 4 3 9 0 0 0 VIII girls40 114 660 889 1,192 18 2 0Regular teachers Para-teachers SC teachers ST teachersTotal Male Female No res Male Female No res Male Female Male Female348 0 680 385 0 220 69 247 60246440862552191051159912497MADHYA PRADESH1200758123Primary0000746297011Upper Primary37.8 25.75412480000203710132530136440147430%Teachers recvd.in-service trainingMale Female0.0 0.00.0 0.00.0 0.00.0 0.00.07 0 1 1 2 1 0.0% Schools recvd. Incentives : Number of beneficiaries(Previous year)(Previous academic year)School T L Mdev. grant grant Incentive Primary Upper primary0.6 0.2 Type Boys Girls Boys Girls0.6 0.0 Text books 20 0 00.0 0.0 Uniform0 0 00.0 0.0 Attendance 0 0 00.0 0.0 Stationery 0 0 0# = not applicable na = not available * Some totals may not match due to no response in classificatory data items0000


