BIOETHANOL GREENHOUSE GAS CALCULATOR - HGCA
BIOETHANOL GREENHOUSE GAS CALCULATOR - HGCA
BIOETHANOL GREENHOUSE GAS CALCULATOR - HGCA

You also want an ePaper? Increase the reach of your titles
YUMPU automatically turns print PDFs into web optimized ePapers that Google loves.
<strong>BIOETHANOL</strong> <strong>GREENHOUSE</strong> <strong>GAS</strong> <strong>CALCULATOR</strong>User’s GuideOctober 2005Authors:Jeremy Woods, Gareth Brown and Alexander EstrinBiomass Energy GroupCentre for Environmental PolicyImperial College LondonLondon, SW7 2BP, UKhttp://www.iccept.imperial.ac.uk/research/bioenergygroup/beg.html
Table of ContentsExecutive Summary ........................................................................................................ i1. Introduction ............................................................................................................ 11.1 Why is a GHG calculator required? ............................................................... 21.2 Why now? ...................................................................................................... 31.3 Scientific basis ............................................................................................... 41.4 Possible uses for the calculator ...................................................................... 42. Scope of work ........................................................................................................ 53. Who should use the calculator and why ................................................................ 54. Using the Calculator .............................................................................................. 64.1 Data Input Page .............................................................................................. 64.1.1 Data Input Help ...................................................................................... 74.1.2 Farming inputs and Yields ..................................................................... 84.1.3 Pre-processing ........................................................................................ 94.1.4 Feedstock Transport ............................................................................. 104.1.5 Processing ............................................................................................ 104.1.6 Transport to End-Use ........................................................................... 124.1.7 Calculation ........................................................................................... 124.2 Report Page .................................................................................................. 124.3 Calculations Page ......................................................................................... 145. Underlying factors and calculations ..................................................................... 165.1 Agricultural Inputs ....................................................................................... 175.2 Effects of Straw Removal ............................................................................ 175.3 Fossil Fuels and Electricity .......................................................................... 185.4 Transport ...................................................................................................... 185.5 Credits .......................................................................................................... 196. Default Bioethanol Production Chains ................................................................ 216.1 Basic wheat-to-ethanol pathway .................................................................. 216.2 Farming Inputs and Yields ........................................................................... 226.3 Pre-processing (Drying and Storage) ........................................................... 226.4 Transport to Processing................................................................................ 226.5 Processing .................................................................................................... 226.6 Transport to End Use ................................................................................... 237. References ............................................................................................................ 24Definitions and terminology ........................................................................................ 26Figure 1: Main input sheet for the calculator ................................................................. 7Figure 2: Data Input Guidance Sheet ............................................................................. 8Figure 3: Farm-level inputs - data requirements ............................................................ 8Figure 4: Pre-processing inputs, data requirements ..................................................... 10Figure 5: Feedstock Transport to Processing- data requirements ................................ 10Figure 6: Processing / Conversion, data requirements................................................. 11Figure 7: Ethanol Transport to end-use, data requirements ......................................... 12Figure 8: Calculator Reporting Screen - calculation outputs ....................................... 13Figure 9: Calculations Page ......................................................................................... 15Figure 10: Basic assumptions for default wheat to ethanol pathways (LCVP, 2004) . 21Table 1: Farming share of energy and GHG emissions for ethanol production ............ 2
Table 2: GHG emission factors for fertilizers, seeds and pesticides ........................... 17Table 3: Effects of straw removal on fertilizer requirements ...................................... 18Table 4: GHG emissions factors for fossil fuels and electricity .................................. 18Table 5: GHG emissions factors for freight transport ................................................. 19Table 6: Default farming inputs and yields.................................................................. 22Table 7: Default fuel inputs and surplus electricity outputs ........................................ 23
iExecutive SummaryIt is not currently possible to calculate a credible single generic GHG (or carbon)factor for the net (LCA) emissions resulting from the use of a biofuels at the nationallevel. Furthermore, the underlying assumption that all forms of biomass use forenergy are strictly carbon or GHG neutral is challengeable. This new understandinghas profound implications for the development of a credible biofuels sector and forthe calculation of incentives or tax breaks that Government could or should award.Yet, the combination of the high oil price, the EU Biofuels Directive (EU, 2003), UKFuel Duty Rebate and the imminent announcement of a UK Renewable TransportFuels Obligation, are powerful drivers for the increased production and utilisation ofbiofuels in the UK.These major policy drivers are justified on a combination of pressing climate changemitigation needs and energy security factors. Without a sound and broadly acceptedbasis for calculating the energy and GHG balances for biofuels, such policies willremain unconvincing at best. As a consequence, such policies will be vulnerable tochange, for example when targets are not being met, increasing uncertainty and riskfor business.The GHG Calculator outlined in this report has been designed to address some ofthese concerns by providing the basis for a credible calculation of the GHG emissionsarising from a batch of UK-derived bioethanol using specified agricultural andconversion processes. The calculator is also designed to allow farmers and ethanolsuppliers to see how changes made in management practices or inputs could affect theoverall GHG emissions of the resulting ethanol production.In order to assist farmers with evaluating how their choice of management,technologies and inputs would affect the overall GHG emissions of the resultingethanol production, the calculator enables a selected range of the key variables to bealtered by the user. For example, producing low-protein wheat for ethanol productionshould allow reduced nitrogen fertiliser applications. In the calculator, the defaultvalue for N-fertiliser applications can be changed and the resulting reduction in GHGemissions calculated. Section 4 explains which factors can be altered and summarisesthe scientific basis for the calculation of potential GHG emissions using thecalculator.For ease-of-use, the calculator divides up the ethanol production and supply chain intothe following sub-sectors:• Farming inputs and yields.• Pre-processing.• Feedstock transport.• Processing / conversion.• Transport to end-use, duty or blending points.The GHG emissions arising from each of these sub-sectors are displayed in numericaland graphical form for each calculation (Figure 8). In addition, a choice of reportingunits is provided in order to facilitate cross-comparison with alternative LCA studies.
11. IntroductionA recent lifecycle evaluation by Rickeard et al (LCVP, 2004), has shown that aconservative range in net greenhouse gas (GHG) emissions from wheat-based ethanolproduction in the UK would be between 7% and 77% lower than the emissions frompetrol, depending on how the ethanol is produced. In fact, the range is likely to begreater than this (see for example, Bauen et al., 2005). The broader range in possibleemissions arises from very large array of technological and management optionsavailable at almost very stage in the feedstock production and conversion sectors,location of production (local or international) and the importance of integratedtransport logistics. Also, other renewable transport fuels may be cheaper and/or havea greater impact on reducing GHG emissions.A large array of alternative renewable energy resources could be used for renewabletransport fuel (RTF) production in the UK. It is estimated that UK-sourced biomassand non-biomass renewable transport fuels could theoretically substitute over half ofroad transport fuel use, based on the estimated practical renewable energy potentialand an average assumed conversion efficiency from renewable resource to transportfuel of 50% (Woods & Bauen, 2003).These renewable energy resources are roughly equally divided between biomass andwaste, and direct renewable electricity sources. In practice, there will be a number oftechnical and economic constraints and competition between renewable resources fordifferent end uses, that will reduce the potential for RTF production from renewables.On the other hand, competition for land for food production is likely to continue todecrease as subsidies to food crops are reduced and global competition in agriculturalcommodities grows, particularly for cereals. Also, supplies of RTFs from abroad maybe cheaper than home production. Therefore, a UK RTF industry will need to makesustained gains in efficiency and cost reductions if it is to become and remaincompetitive.Despite a lack of UK-based experience in the wide-spread production of energy cropsthey are increasingly viewed as an important component of agri-environment andrural development activities. A variety of energy crops could be grown, ranging fromannual crops such as oilseed rape, sugar beet and wheat, to perennial crops such asshort rotation willow or poplar coppice and energy grasses e.g. miscanthus.However, other energy end-uses, i.e. electricity and heat, are also likely to competewith the transport sector for the same renewable energy resources. Trade-offs in termsof economics and the environment between these competing end uses will need to becarefully addressed. In order to effectively address climate change and the associatedreduction in GHG emissions, standardised methodologies and data collection arerequired. This standardised approach is necessary to allow a realistic crosscomparisonbetween the relative benefits of using the biomass, and other renewable,resources for competing single and poly generational pathways to renewable energyproduction. However, an agreed methodology for comparing the net GHG emissionsand wider environmental and social impacts has not yet been produced. The work
2commissioned by the <strong>HGCA</strong> to develop such an assurance scheme could provide thebasis for developing a methodology that encompasses a wide range (if not all) therenewable transport fuel provision options with the GHG calculator representing asignificant first stage in this process. The evolving role of a GHG calculator in such aprocess is described below.1.1 Why is a GHG calculator required?Growing biomass in modern agricultural systems requires energy inputs (mostlyfossil-fuel and direct solar). In a standard ethanol-from-wheat production chain, theseinputs could represent a quarter of the total energy requirements for producing anddelivering the ethanol. However, the share of total GHG emissions isdisproportionately large, primarily as a result of including an estimate for field-levelnitrous oxide (N 2 O) emissions. In the example provided in Table 1, agricultural GHGemissions account for just over half of the total emissions resulting from theproduction and delivery of ethanol in a model UK supply chain. Farm-level GHGemissions from nitrous oxide and those that result from the production of nitrogenfertilisers account for over 40% of the total chain emissions. No allowance is madefor potential emissions that could result from land use change which together withnitrous oxide emissions represent the greatest areas of uncertainty in calculating thenet chain GHG emissions.Much can be done to reduce the energy, and particularly the fossil energy, inputs intothe production and conversion of biomass for biofuel production. UK farmers havealready made great strides in reducing inputs into agriculture as highlighted by Turleyet al (2005). However, the different quality requirements for biomass produced forenergy versus food production may allow further reductions in inputs andmanagement intensity. But, how can farmers and agricultural planners evaluatewhich changes to management and inputs will have the greatest impact on the overallenergy and GHG balances for biofuel production?Table 1: Farming share of energy and GHG emissions for ethanol productionEnergy InputsGJp/ha% of totalchainGHG EmissionsKg CO 2 eq/ha% of totalchainDiesel 4.7 7.0% 356.6 5.8%K fertiliser 0.4 0.6% 21.0 0.3%P fertiliser 0.7 1.0% 29.1 0.5%N fertiliser 7.5 11.1% 1238.0 20.2%Pesticides 0.6 0.8% 10.8 0.2%Seed Material 2.5 3.7% 160.4 2.6%N 2 O emissions 1290.6 21.0%Total Farm 16 24.2% 3106 50.6%Rest of Chain 51.1 75.8% 3037.2Notes: based on Model B22 Natural Gas-Gas Turbine Boiler + fired Steam
3recovery (LCVP report; Rickeard et al, 2004). This model assumes thatthe straw is ploughed back in and is therefore awarded a nitrogen creditreducing the N-fertiliser requirement from 253kgN per ha to 185kgN/ha.The calculator described here, provides farmers with a simple tool to assess theimpact of changes in management and inputs on the lifecycle GHG balance forethanol production from wheat in the UK. It reports in both tabular and graphicalformats, the impact of changes in inputs (e.g. nitrogen fertiliser rates) on the finalGHG balance for ethanol for a selected conversion chain. As a result farmers, biofuelproducers and policy makers can assess the value of investing in new more energyefficient equipment or altering the level of inputs to strike the best yield : inputbalance for an entire production chain.1.2 Why now?That it is not possible to calculate a credible single generic GHG (or carbon) factor forthe net (LCA) emissions resulting from the use of a biofuels at the national level hasprofound implications for the development of the sector and the calculation ofincentives or tax breaks that Government can or should award. The combination ofthe high oil price, the EU Biofuels Directive (EU, 2003) and the imminentannouncement of the UK Renewable Transport Fuels Obligation are powerful driversfor the increased production and utilisation of biofuels in the UK.The existing mechanisms to discourage GHG emissions, such as the UK EmissionsTrading Scheme, operate at the national boundary and are therefore not sufficientlycapable of differentiating between the emissions resulting from the different sectors.In addition, the Renewables Obligation (RO) for the electricity sector, assumes strictcarbon-neutrality for the biomass feedstocks consumed, despite widely divergentorigins and compositions and there is currently no mechanism for assessing the GHGintensity of renewable transport fuel options.The UK government has made a powerful yet challenging commitment to thereduction of national GHG emissions within the Kyoto framework and beyond whichleaves planners with no option than to address transport sector emissions togetherwith the other sectors. Yet in the short term, the only proven viable alternatives topetrol and diesel are biofuels (bioethanol and biodiesel). The development of a UKassurance scheme for biofuel production will provide a transparent framework forevaluating the actual GHG emissions from alternative routes to producing and usingrenewable transport fuels (see for example Woods & Bauen, 2003). It is therefore,critical that biofuel production (and use) is optimised to maximise the GHG benefitsthat can arise from substituting the relevant fossil fuels.Should government policy incentivise energy use on the basis of quantified GHGemissions, producers and suppliers risk having locked themselves into inefficientsupply pathways (including sunk investments in infrastructure) and thus becominguncompetitive unless they maximise GHG performance now. The calculator has beendeveloped to allow these calculations to take place using an agreed and transparentevidence base.
41.3 Scientific basisWell-To-Tank (WTT) lifecycle analysis is a critical component of understanding theenergy and GHG impact of new fuel/vehicle technologies through a transparentmethodology that can be used to allow comparison with alternatives. The principlesand standards for Lifecycle Assessment are laid out by the International StandardsOrganisation through its ISO 14040 series of standards (ISO, 1997). The frameworkdeveloped by ISO 14040 has been used by a range of relevant LCA analyses used inthe development of the Calculator, in particular the work carried out by Mortimer et al(2004) and Rickeard et al, (2004).Conventional biofuels (ethanol and biodiesel) are generally used as blends with petrolor diesel in existing vehicles, so comparison of the fuel production cycles is the mostimportant aspect of the analysis. For the Bioethanol GHG Calculator we assumed thatthe ethanol is produced from wheat grain via the conventional hydrolysis andfermentation process. The evidence-base for each of the assumptions made isprovided in the text of the relevant sections and pointers to background literature areprovided.1.4 Possible uses for the calculatorThe Bioethanol Calculator might be used to:• Raise awareness among farmers, bioethanol producers and consumers of GHGand global warming issues, highlighting the nexus between GHG emissionsand fertilisers and pesticide applications.• Attract interest of agricultural procedures because practices which reduceGHG emissions may also increase production efficiencies and thus theprofitability of agricultural operations.• Formalize an accepted means of calculating and reporting GHG emissionreductions associated with ethanol feedstock cultivation and ethanolproduction and use.• Assign the benefits (e.g. credits) of GHG emission reductions to the ethanolfeedstock producers who implement practices in verifiable, quantifiable GHGemission reductions.• Give consumers or investors confidence that the bioethanol has been producedunder conditions that meet sustainability standards.• Enable stakeholders such as NGOs and oil companies to assess theenvironmental performance of biofuels, in particular in relation to GHGreductions.• Assist policymakers in understanding of the extent to which a fuel increasesthe security of the energy supply.
64. Using the CalculatorThe bioethanol GHG calculator is an interactive spreadsheet-based tool for calculatingthe GHG emissions resulting from the production and use of wheat-based bioethanolin the United Kingdom. It uses input data describing the entire production chain forany batch of ethanol to calculate the GHG emissions associated with that batch andcompares the results with those produced from the production and use of anequivalent quantity of petrol. The methodology and factors underlying thecalculations are based on a consensus study carried out by experts from industry andacademia as part of the Low Carbon Vehicles Partnership in 2004 (LCVP, 2004).The tool is provided as a Microsoft Excel workbook. Please note that Macros mustbe enabled for the tool to run.4.1 Data Input PageThe calculator opens to the Data Input Page, shown in Figure 1. The bioethanolproduction chain is specified on this page by entering data and making selections thatdescribe the inputs, outputs and other features of the different sections of the chain.The use can make appropriate selections and entries as instructed on the page orsimply leave the existing default values. Further clarification can be obtained bypressing the “HELP” button.For each section of the ethanol production chain, standard default values can be reenteredby clicking on the "Set Default Values" button. These default values are basedon a typical production chain producing 100 000 tonnes of ethanol per annum, asanalysed in the Low Carbon Vehicles Partnership study by Rickeard et al (LCVP,2004).The functions and input data requirements of the different sections of the Data InputPage are described below.
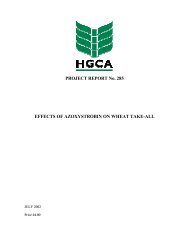
7FEEDSTOCK: WHEATDATA INPUT PAGEPlease make selections from the drop-down lists and click inside the boxes to change quantities. For further help, click the "HELP"button on the right.For each section of the ethanol production chain, standard default values can be entered by pressing the "Set Default Values" button.After specifying the entire production chain, press the "CALCULATE" button at the bottom of the page.HELPFARMING INPUTS AND YIELDSkg N/hakg P2O5/ha18594Diesel consumption l/haPesticide active ingredient kg/ha1412Was straw ploughed in at end of previous crop?Yes, straw ploughed inCrop Yield t/ha 8kg K2O/ha55Seed material kg/ha185No, straw removedSet Default ValuesPRE-PROCESSING(DRYING AND STORAGE)Grain moisture before drying, % 16Grain moisture after drying, % 3Diesel consumption l/t dried grain 18.5Electricity consumption kWh/t dried grain 11.7Set Default ValuesTRANSPORT TO PROCESSINGModeRoadDistance50 kmSet Default ValuesPROCESSINGEnergy GenerationNG GT + steam generator + steam turbineNatural gas consumption GJ/t ethanol27.2Ethanol Yield l/t feedstock supplied to plant 416Imported electricity kWh/t ethanol0Surplus Electricity kWh/t ethanol2525Destination of DDGS co-productAnimal feedSet Default ValuesTRANSPORT TO END USEModeRoadDistance150 kmSet Default ValuesCALCULATEFigure 1: Main input sheet for the calculator4.1.1 Data Input HelpGuidance on data input can be obtained by clicking on the HELP button on the rightof the upper section of the Data Input Page. The Data Input Guidance Sheet isdisplayed as shown in Figure 2 below.
8DATA INPUT GUIDANCEThe table below provides guidance on entering data and making selections to specify a bioethanolproduction chain for calculation of the greenhouse gas emissions associated with that chain.After reviewing the relevant sections, click the "BACK" button at the bottom of this page to return to theDATA INPUT page.Section Entry/Selection NotesFARMING INPUTS AND YIELDSNitrogen fertiliser rate (kg N/ha)Phosphate fertiliser unit drop-down(kg P2O5/ha or kg P/ha)Potash fertiliser unit drop-down(kg K2O/ha or kg K/ha)Phosphate fertiliser ratePotash fertiliser rateDiesel consumption l/haEnter quantity of nitrogen fertiliser applied in kilograms nitrogen per hectareSelect units in which you measure phosphate fertiliser application ratesSelect units in which you measure potash fertiliser application ratesEnter quantity of phosphate fertiliser applied in kilograms per hectare, ensuring thecorrect units are selected in the adjacent drop-down listEnter quantity of potash fertiliser applied in kilograms per hectare, ensuring thecorrect units are selected in the adjacent drop-down listEnter total quantity of diesel fuel used on the farm for growing wheat, in litres perhectare. Note that this should not include any fuel used in wheat drying.PRE-PROCESSING(DRYING AND STORAGE)TRANSPORT TO PROCESSINGPesticide active ingredient kg/haEnter total quantity of pesticide applied in kilograms of active ingredient per hectareSeed material kg/haEnter total quantity of seed used in kilograms of active ingredient per hectareWas straw ploughed in at end of previous crop? (Optionbuttons - Yes straw ploughed in / No, straw removed)Click on appropriate option button to indicate whether wheat straw was ploughed inor removed after the previous harvestCrop Yield t/haEnter average number of tonnes of wheat produced per hectareGrain moisture before drying, %Enter grain moisture before drying, in percentGrain moisture after drying, %Enter grain moisture after drying, in percentDiesel consumption l/t dried grainElectricity consumption kWh/t dried grainTransport mode drop-down listTransport distanceEnergy generation drop-down listEnter total quantity of diesel fuel used for drying wheat, in litres per tonne driedwheat grainEnter electricity consumed in drying wheat, in kWh per tonne dried wheat grainSelect mode of transport of dried wheat grain to processing facilityEnter average distance from farm to ethanol plantSelect means of heat and electricity provision at ethanol plantPROCESSINGTRANSPORT TO END USENatural gas consumption GJ/t ethanolImported electricity kWh/t ethanolSurplus Electricity kWh/t ethanolStraw consumption kg/l ethanolStraw transport drop-down listStraw transport distanceEthanol Yield l/t feedstock supplied to plantDDGS Destination drop-down listTransport mode drop-down listTransport distanceEnter total natural gas consumption at ethanol plant, in gigajoules per tonne ethanolproduced. This will include natural gas used for generating the heat and electricityrequired for ethanol production as well as for generating any surplus electricityEnter total electricity imports used for ethanol production, in kilowatt-hours per tonneethanol produced.Enter total electricity generated at ethanol plant but not used for ethanol production,in kilowatt-hours per tonne ethanol produced.Enter quantity of straw used as fuel at ethanol plant, in kilograms per litre of ethanolproducedSelect mode of transport of straw fuel to ethanol plantEnter average distance that straw fuel is transported from farm to ethanol plantEnter yield of ethanol in litres per tonne dried wheat grain supplied to the ethanolplantSelect destination of distiller's dried grains and solubles (DDGS) co-product - use asanimal feed or use as co-fuel in a power plantSelect mode of transport of ethanol to distribution sitesEnter average distance from ethanol plant to distribution sitesBACKFigure 2: Data Input Guidance Sheet4.1.2 Farming inputs and YieldsThis section summarises how the data describing the inputs and outputs of thefarming stage of the production chain and be used in the calculator.FARMING INPUTS AND YIELDSkg N/hakg P2O5/ha18594Diesel consumption l/haPesticide active ingredient kg/ha1412Was straw ploughed in at end of previous crop?Yes, straw ploughed inCrop Yield t/ha 8kg K2O/ha55Seed material kg/ha185No, straw removedSet Default ValuesFigure 3: Farm-level inputs - data requirementsEnter quantities of fertiliser, seeds, pesticides and fuel used in cultivation of wheat forethanol production:
9• Nitrogen fertiliser rate (kg N/ha) – Enter quantity of nitrogen fertilizerapplied in kilograms nitrogen (N) per hectare.• Phosphate fertiliser unit drop-down (kg P 2 O 5 /ha or kg P/ha) – Select unitsin which you measure phosphate fertiliser application rates.• Potash fertiliser unit drop-down (kg K 2 O/ha or kg K/ha) – Select units inwhich you measure potash fertiliser application rates.• Phosphate fertiliser rate – Enter quantity of phosphate fertiliser applied inkilograms per hectare, ensuring the correct units are selected in the adjacentdrop-down list.• Potash fertiliser rate – Enter quantity of potash fertiliser applied in kilogramsper hectare, ensuring the correct units are selected in the adjacent drop-downlist.• Diesel consumption (l/ha) – Enter total quantity of diesel fuel used on thefarm for growing wheat, in litres per hectare. Note that this should not includeany fuel used in wheat drying.• Pesticide active ingredient (kg/ha) – Enter total quantity of pesticide appliedin kilograms of active ingredient per hectare. This figure should include allherbicides, insecticides and fungicides.• Seed material (kg/ha) – Enter total quantity of seed applied in kilograms perhectare.Indicate whether the straw resulting from the previous crop had been ploughed backinto the soil or removed. This function affects the quantities of fertilisers required forthe crop, and also the emissions of the powerful GHG nitrous oxide from the land.• Was straw ploughed in at the end of previous crop? (Option buttons –‘Yes, straw ploughed in’ / ‘No, straw removed’) – Click on appropriate buttonto indicate whether wheat straw was ploughed in or removed after the previousharvest.Finally, enter the crop yield in tonnes per hectare.• Crop yield (t/ha) – Enter average number of tonnes of wheat grain producedper hectare as harvested. Moisture contents are stated in the pre-processingsection.4.1.3 Pre-processingThis refers to the drying of wheat grain prior to delivery at the processing plant.Enter the percentage moisture of the wheat grain before and after drying. Enter thetotal diesel fuel and total electricity consumed in drying and storage of the wheat.This enables calculation of the reduction in weight of the wheat grain between harvestand delivery to the ethanol plant and the associated GHG emissions arising from theenergy inputs.
10PRE-PROCESSING(DRYING AND STORAGE)Grain moisture before drying, % 16Grain moisture after drying, % 3Diesel consumption l/t dried grain 18.5Electricity consumption kWh/t dried grain 11.7Set Default ValuesFigure 4: Pre-processing inputs, data requirements• Grain moisture before drying (% mass ) – Enter grain moisture before dryingas percent by mass:mass of water in graingrain moisture = × 100%total mass of grain• Grain moisture after drying (% mass ) – Enter grain moisture content afterdrying as percent by mass.• Diesel consumption (l/t dried grain) – Enter total quantity of diesel fuel usedfor drying wheat, in litres per tonne of dried wheat grain.• Electricity consumption (kWh/t dried grain) – Enter electricity consumed forwheat drying, in kWh per tonne dried wheat grain.4.1.4 Feedstock TransportIn this section, enter details of the transportation of the wheat grain from preprocessingto the processing plant. Enter the mode of transport (road, rail, etc.), andthe average transportation distance.TRANSPORT TO PROCESSINGModeRoadDistance50 kmSet Default ValuesFigure 5: Feedstock Transport to Processing- data requirements• Transport mode drop-down list – Select mode of transport.• Transport distance – Enter average distance (one-way) from farm (preprocessingpoint e.g. grain drying barn) to ethanol plant.4.1.5 ProcessingData describing material and energy inputs and outputs at the ethanol conversionfacility are entered in this section if necessary. Default values are available for anumber of conversion plant configurations following the Rickeard et al, 2004 analysis(LCVP, 2004).
11PROCESSINGEnergy GenerationNG GT + steam generator + steam turbineNatural gas consumption GJ/t ethanol27.2Ethanol Yield l/t feedstock supplied to plant 416Imported electricity kWh/t ethanol0Surplus Electricity kWh/t ethanol2525Destination of DDGS co-productAnimal feedSet Default ValuesFigure 6: Processing / Conversion, data requirements• Energy Generation drop-down list – Select the means of heat and electricityprovision at the ethanol plant. The available options are:• NG boiler and gridThis setup uses a conventional natural gas-fired steam boiler for steamgeneration and imports electricity from the grid• NG boiler and steam turbineThis is a combined heat and power (CHP) arrangement using aconventional natural gas-fired steam boiler and a backpressure steamturbo-generator.• NG GT + steam generator + steam turbineHere a natural gas-fired gas turbine coupled to an unfired heat recoverysteam generator and a backpressure steam turbo-generator are used.• NG GT + fired steam generator + steam turbineThis configuration has a natural gas-fired gas turbine, a co-fired heatrecovery steam generator and a backpressure steam turbo-generator. Itdiffers from the previous example in that it employs additional co-firingfor increased efficiency.• Straw boiler + steam turbineThis option uses straw as to generate heat and electricity from acombination of a straw-fired steam boiler and a backpressure steam turbogenerator.When selected, additional fields are provided to specify theamount of straw consumed and the mode of straw transport.Alternatively, the user can enter amounts of natural gas and electricity used at theethanol plant, as well as amounts of surplus electricity exported. If straw is used asfuel at the ethanol plant, enter the amount of straw used, the average distance (oneway)that it is transported to the plant, and the mode of transportation.• Natural gas consumption (GJ/t ethanol) – Enter total natural gasconsumption at ethanol plant, in gigajoules per tonne ethanol produced. Thiswill include natural gas used for generating the heat and electricity requiredfor ethanol production as well as for generating any surplus electricity.• Imported electricity (kWh/t ethanol) – Enter total electricity imports used forethanol production, in kilowatt-hours per tonne ethanol produced.
12• Surplus electricity (kWh/t ethanol) – Enter total electricity generated atethanol plant but not used for ethanol production, in kilowatt-hours per tonneethanol produced.• Straw consumption (kg/l ethanol) – Enter quantity of straw used as fuel atethanol plant, in kilograms per litre of ethanol produced.• Straw transport drop-down list – Select mode of transport of straw fuel tothe ethanol plant.• Straw transport distance - Enter average distance (one-way) that straw fuelis transported from farm to ethanol plant.• Ethanol Yield (l/t feedstock supplied to plant) – Enter yield of ethanol inlitres per tonne dried wheat grain supplied to the ethanol plant.• DDGS Destination drop-down list – Select destination of distiller’s driedgrains and solubles (DDGS) co-product – use as animal feed or use as co-fuelin a power plant.4.1.6 Transport to End-UseIn this section, enter details of the transportation of ethanol from the processing plantto the distribution sites or leave the default values. Enter the mode of transport, andthe average transportation distance.TRANSPORT TO END USEModeRoadDistance150 kmSet Default ValuesFigure 7: Ethanol Transport to end-use, data requirements• Transport mode drop-down list – Select mode of transport of ethanol todistribution sites as either; road, rail, sea or air.• Transport distance – Enter average distance (one-way) from ethanol plant todistribution sites.4.1.7 CalculationAfter specifying the entire production chain, press the “CALCULATE” button at thebottom of the page. The Report Page is then displayed.4.2 Report PageThe Report Page displays the total GHG emissions resulting from the production ofethanol as specified on the Data Input page. It also shows how the different sectionsof the production chain contribute to this total. A comparison with the emissions fromproduction and use of petrol is given in terms of the percentage reduction in GHGemissions relative to those of an energy-equivalent amount of petrol.
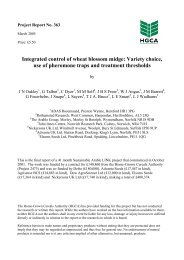
13<strong>BIOETHANOL</strong> <strong>GREENHOUSE</strong> <strong>GAS</strong> <strong>CALCULATOR</strong>REPORT PAGEThis page shows the greenhouse gas emissions associated with the production of bioethanol based on the lifecycle inputs from the data entry pageFeedstock:Ethanol Yield:Wheat2882 litres per hectareGHG Units:FERTILISER, SEEDS & PESTICIDESProduction Chain SpecificationsGreenhouse Gas EmissionsON FARM FUEL USE185 kg N, 94 kg P2O5, 55 kg K2O, 2 kg pesticide and 185 kg seed per hectareStraw ploughed in637.8 kg CO2eq/tN 2 O EMISSIONS141 litres diesel/ha157.1 kg CO2eq/tAssumed proportional to quantity of nitrogen fertiliser appliedPRE-PROCESSING18.5 l diesel/t dried grain11 7kWh l t i it /td i d iTRANSPORT TO PROCESSING564 kg CO2eq/t195.2 kg CO2eq/tPROCESSINGDried wheat grain transported by road on average 50 km to distilleryEnergy generation:NG GT + steam generator + steam turbine:27.2 GJ natural gas, 0 kWh imported electricity and 2525 kWhsurplus electricity per tonne ethanol12.84 kg CO2eq/tTRANSPORT TO END USEDestination of DDGS:Animal feed-208 kg CO2eq/tEthanol transported by road on average 150 km to end useTOTAL:Percent reduction relative to petrol emissions:12.72 kg CO2eq/t1372 kg CO2eq/t bioethanol40.35%kg CO2eq/t bioethanol-300 -200 -100 0 100 200 300 400 500 600 700Fertiliser, seeds & pesticidesOn-farm fuel useN2O emissionsPre-processingTransport to processingProcessingTransport to end useDeveloped by The Edinburgh Centre for Carbon Management, Imperial College London and Themba TechnologyFor comments or further information contact Richard Tipper (richard.tipper@eccm.uk.com), Jeremy Woods (jeremy.woods@imperial.ac.uk) or Gareth Brown (gareth@thembatech.co.uk)Figure 8: Calculator Reporting Screen - calculation outputsThe units in which the GHG emissions are presented may be changed by selectingfrom the ‘GHG Units’ drop-down box in the upper right-hand corner of the page. Thebuttons at the bottom of the Report Page have the following functions:
14Clicking the BACK button takes the user back to the Data Input Page.Clicking the VIEW REFERENCES button displays the data sources (references) onwhich the underlying default emission factors and conversion efficienciesare used to generate the calculations by calculator.Clicking the VIEW CALCULATIONS button displays a spreadsheet with detailedcalculations and intermediate results for the ethanol production chainspecified.Clicking the SAVE REPORT creates a new file containing the current Report Pageand the detailed calculation spreadsheet.Clicking the PRINT REPORT prints the current Report Page and the detailedcalculation spreadsheet.Clicking the CLOSE button closes the calculator tool without saving.4.3 The Calculations PageThe Calculations Page (see Figure 9) displays a spreadsheet with detailed calculationsfor the GHG emissions of the particular ethanol production chain being analysed. It isaccessed by clicking the ‘View Calculations’ button on the Report Page. This pageprovides the results of intermediate calculations throughout the chain along with theinput data and underlying factors used.
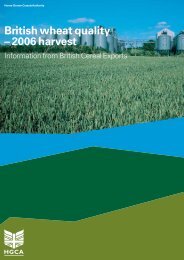
15Bioethanol Production Chain - Calculation of Greenhouse Gas EmissionsFEEDSTOCK:WheatFuel and Energy DataLower heating valueGHG Emissions FactorDensity (kg/l)Ethanol Production Chain Yields(MJ/l)(kgCO2eq/GJ)Feedstock yield, t/ha 8.0 Anhydrous Ethanol 21.28 0.794Ethanol yield, l/t dried grain 416 Petrol 32.95 0.749 85.8Ethanol yield, t/ha 2.29 Diesel 35.71 0.834 87.4Natural Gas (EU-mix) 60.8Electricity (UK-mix) 160Feedstock ProductionFertiliser, seed and pesticidesApplication Rate (kg/ha)GHG Emissions Factor(kgCO2eq/kg)GHG Emissions(kgCO2eq/t ethanol)GHG Emissions(kgCO2eq/l ethanol)GHG Emissions(kgCO 2eq/petrolequivalentlitre ethanol)GHG Emissions(kgCO2eq/GJ ethanol)N fertiliser 185 6.69 541.0 0.43 0.67 20.19P fertiliser (as P) 41 0.71 12.7 0.01 0.02 0.47K fertiliser (as K) 46 0.46 9.1 0.01 0.01 0.34Pesticide (as active ingredient) 2 5.41 4.7 0.00 0.01 0.18Seed production 185 0.87 70.1 0.06 0.09 2.62On-farm N 2O emissionsEmissions Rate (kg/ha)Global WarmingPotential (kgCO2eq/kg)GHG Emissions(kgCO2eq/t ethanol)GHG Emissions(kgCO2eq/l ethanol)GHG Emissions(kgCO2eq/petrolequivalentlitre ethanol)GHG Emissions(kgCO2eq/GJ ethanol)4.36 296 564 0.45 0.69 21.04On-farm diesel usageUsage Rate (l/ha)GHG Emissions Factor(kgCO2eq/l)GHG Emissions(kgCO 2eq/t ethanol)GHG Emissions(kgCO 2eq/l ethanol)GHG Emissions(kgCO 2eq/petrolequivalentlitre ethanol)GHG Emissions(kgCO 2eq/GJ ethanol)Total used for cultivation 141 3.1 192 0.15 0.24 7.18Credit for use of set-aside -25.8 3.1 -35 -0.03 -0.04 -1.31Net 115.2 3.1 157 0.12 0.19 5.86Pre-ProcessingGrain moisture before drying 16%Grain moisture after drying 3%Energy Consumption(GJ/t dried grain)GHG Emissions(kgCO2eq/t ethanol)GHG Emissions(kgCO2eq/l ethanol)GHG Emissions(kgCO2eq/petrolequivalentlitre ethanol)GHG Emissions(kgCO2eq/GJ ethanol)Diesel fuel 0.661 174.8 0.14 0.21 6.52Electricity 0.042 20.4 0.02 0.03 0.76Feedstock Transport to ProcessingMode of TransportDistance (km)GHG Emissions Factor(kgCO2eq/t-km)GHG Emissions(kgCO 2eq/t ethanol)GHG Emissions(kgCO 2eq/l ethanol)GHG Emissions(kgCO 2eq/petrolequivalentlitre ethanol)GHG Emissions(kgCO 2eq/GJ ethanol)Dried wheat grain Road 50 0.085 12.84 0.0102 0.0158 0.4790ProcessingEnergy Supply:Destination of DDGS:NG boiler and gridAnimal feedEnergy Consumptionand Credits(GJ/t ethanol)GHG Emissions(kgCO 2eq/t ethanol)GHG Emissions(kgCO 2eq/l ethanol)GHG Emissions(kgCO 2eq/petrolequivalentlitre ethanol)GHG Emissions(kgCO 2eq/GJ ethanol)Natural gas 11.8 717 0.57 0.88 26.77Imported electricity 1.45 232 0.18 0.29 8.66Credit for surplus electricity 0.00 0 0.00 0.00 0.00Credit for DDGS -3.133 (GJp) -407 -0.32 -0.50 -15.20Ethanol Transport to End UseMode of TransportDistance (km)GHG Emissions Factor(kgCO2eq/t-km)GHG Emissions(kgCO2eq/t ethanol)GHG Emissions(kgCO2eq/l ethanol)GHG Emissions(kgCO2eq/petrolequivalentlitre ethanol)GHG Emissions(kgCO2eq/GJ ethanol)Road 150 0.085 12.72 0.0101 0.0156 0.4746SummaryGHG Emissions(kgCO 2eq/t ethanol)GHG Emissions(kgCO 2eq/l ethanol)GHG Emissions(kgCO 2eq/petrolequivalentlitreGHG Emissions(kgCO 2eq/GJ ethanol)Emissions sourceethanol)Fertiliser, seeds & pesticides 637.68 0.51 0.78 23.79On farm fuel consumption 157.10 0.12 0.19 5.86On-farm N2O emissions 563.98 0.45 0.69 21.04Pre-processing 195.21 0.15 0.24 7.28Transport to processing 12.84 0.01 0.02 0.48Processing 542.27 0.43 0.67 20.23Transport to end use 12.72 0.01 0.02 0.47Total 2121.8 1.68 2.61 79.17Ethanol Percent Reduction In Greenhouse Gas Emissions Relative to Petrol: 7.7%BACKFigure 9: Calculations Page
165. Underlying factors and calculationsA range of assumptions, default factors and conversion efficiencies have been used inthe calculator in order to generate the lifecycle GHG emissions data. Theseassumptions and factors are based on through review of the available literaturerelevant to full lifecycle assessment of biofuel production chains and on the feedbackfrom the project steering group. In order to meet accepted standards in transparencyand to clearly explain how the calculations are derived a summary is provided belowfor each of the assumptions and factors used.5.1 Basis of CalculationsThe Calculator integrates all the GHG emissions directly or indirectly attributable tothe inputs and processes involved in the different stages of a selected wheat-to-ethanolproduction chain. From this total, it subtracts credits for GHG emissions avoided bythe bioethanol co-products substitution of other GHG-generating products andprocesses e.g. DDGS used as animal feed substituting for maize gluten feed. Directemissions are those resulting from the combustion of fuels in the ethanol productionchain. Indirect emissions are those resulting from the production of the fuels used, thegeneration of imported electricity and the manufacture of material inputs andequipment used in the ethanol production chain. Indirect emissions may requireseparate lifecycle analyses to be carried out on the associated sectors or referencesystems e.g. animal feed or fossil fuel production.The Calculator does not separate out direct and indirect emissions, but calculationsare based on emissions factors which incorporate both direct and indirect emissions.Each GHG emissions factor gives the total emissions of the GHGs; carbon dioxide(CO 2 ), methane (CH 4 ) and nitrous oxide (N 2 O) associated with a product, process oractivity in a single carbon dioxide equivalent emission (CO 2 eq) figure. Derivation ofcarbon dioxide equivalent emissions is based on the concept of global warmingpotentials as specified by the International Panel on Climate Change (IPCC, 2001).The global warming potential of a gas is a measure of the relative potency of a massof that gas as a GHG compared with an equal mass of carbon dioxide over a specificperiod of time.To quantify the lifecycle GHG benefits from bioethanol production and use comparedwith petrol production and use, the Calculator compares the fuels on the basis ofenergy content. It does so, on the basis of the lifecycle emissions per unit quantity(e.g. 1 tonne, 1 litre) of bioethanol, arising from feedstock cultivation through to finalcombustion in vehicles, compared with the lifecycle emissions for a quantity of petrolwith equal energy on combustion. Issues relating to potential differences in vehicleconversion efficiency (fuel energy to mechanical energy; so called ‘tank-to-wheels’)are not dealt with except through the use of a conservative energy equivalence basis tothe calculations. Carbon dioxide emissions resulting from the combustion of thebiofuel are assumed to equal the carbon dioxide captured during crop growth and aretherefore not included.Within the tool, the emission factors used are those adopted by the Low CarbonVehicle Partnership study (LCVP, 2004). Similarly, the tool uses the LCVP emissionfactors and methodology for calculations of GHG credits. These factors and methodsare fixed in the current version of the Calculator, but could be altered in future
17versions given sufficient evidence that this was necessary. Details of emissionsfactors, credit allocation and emissions calculations are given below.5.2 Agricultural InputsThe GHG emissions associated with production of fertilizers, seeds and pesticides (asactive substance) are given in Table 2. All these factors will vary over time and withproduction methods and location. However, these values were chosen in the LCVPstudy as being representative of current production of these agricultural inputs in theUK or in countries which supply these inputs to the UK.Table 2: GHG emission factors for fertilizers, seeds and pesticidesAgricultural InputGHG Emissions (kg CO 2 eq/kg)Nitrogen fertilizer (as N) 6.69Phosphate fertilizer (as P) 0.71Potash fertilizer (as K) 0.46Pesticides (as active ingredient) 5.41Seed material 0.87The LCVP GHG emission factors are in turn derived from earlier work by Elsayed etal (2003) and Mortimer et al (2004). They represent the emissions of carbon dioxide,methane and nitrous oxide, converted to carbon dioxide equivalent emissions using100-year global warming potentials for these gases of 1, 24.5 and 320 respectively.The nitrogen fertilizer emission factors are based on ammonium nitrate, whichaccording to the 2002 edition of ‘British Survey of Fertilizer Practice’ is the mostcommonly used nitrogen fertilizer in the UK (DEFRA, 2003). The phosphate andpotash fertilizer emission factors are similarly representative of products used in theUK. Pesticides include all insecticides, herbicides and fungicides and are reported askg of ‘active substance’.5.3 Effects of Straw RemovalAfter harvest, wheat straw may be ploughed back into the fields or removed and usedfor fuelling a power plant or for other uses. Ploughing straw back into the soil afterharvest reduces the need for fertilizers and improves soil quality. The amounts ofadditional fertilizer required as a result of straw removal will depend on localconditions and on the amount of straw removed. For the representative wheatcultivation chain studied by the LCVP, the N, P, and K fertilizer applications requiredper hectare, with and without straw removal, were as shown in Table 3Straw removal can also have a significant impact on nitrous oxide (N 2 O) emissionsfrom the fields. The processes involved in generation of these emissions are complexand still not thoroughly understood. At the current stage of development of the tool,the approach taken by Rickeard et al was adopted (LCVP, 2004). That is, N 2 Oemissions are assumed to be proportional to the quantity of nitrogen applied. This isconsidered to be reasonable over the range of fertilizer application levels that may beexpected, and the constant of proportionality used is 0.0236 kg of N 2 O emissions per
18kg of nitrogen fertilizer (as N) applied. Very recent work appears to challenge thisassumption, particularly in cooler temperate climates and further work is required toclarify the N 2 O emissions methodology.Table 3: Effects of straw removal on fertilizer requirementsFertilizer application, kg/haFertilizer type all straw ploughedbackall straw removedN fertilizer (as N) 185 253P fertilizer (as P) 41 53K fertilizer (as K) 46 164In the Calculator, selection of either of the option buttons for “straw ploughed in” or“straw removed” has no effect on calculations other than through enabling adjustmentof fertilizer application rates for the default cultivation conditions (as per Table 3) viathe “Set Default Values” button. In a wheat-to-ethanol GHG calculator, it would beuseful to be able to accept input data on the fate of straw and use this directly incalculations of nitrous oxide emissions from the land as well in calculations of creditsfor use of straw for purposes other than fuel for the bioethanol plant. However, thiswould require more information than is currently readily available. As indicatedabove, precise estimates of the effects of removal of different amounts of straw fromthe field on N 2 O emissions require better models of the N 2 O emission processes. Forcalculations of GHG emissions credits for straw, the amounts of straw removed, theuses to which it is put, and the GHG emissions associated with the displaced products,would have to be known. Site specific soil and climate information may also beimportant factors in estimating N 2 O emissions.5.4 Fossil Fuels and ElectricityFor all consumption of fossil fuels and electricity from the grid, the GHG emissionfactors shown in Table 4 are used.Table 4: GHG emissions factors for fossil fuels and electricityGHG Emissions(kg CO 2 eq/GJ)Diesel 87.4Gasoline 85.8Natural Gas (EU-mix) 61Grid Electricity (UK-mix) 1605.5 TransportCalculations of GHG emissions resulting from transport of wheat feedstock, strawfuel and ethanol product are based on the GHG emissions factors shown in Table 5.
19Table 5: GHG emissions factors for freight transportTransport ModeGHG Emissions Factor(kgCO 2 eq/t-km)Road 0.085Rail 0.03Air 0.57Sea 0.007The road transport mode option assumes that fossil diesel is used. The GHGemissions factor is based on diesel consumption for road freight of 0.97 MJ/t-km(Concawe, 2003) and the GHG emissions factor for diesel burning of 87.4 kgCO 2 eq/GJ as given in Table 4. The diesel consumption for road freight includes anallowance for an empty return trip after delivery of wheat, straw or ethanol over thespecified one-way distance. Transport by rail, sea and air transport were notconsidered in the LCVP study and the GHG emission factors for these modes oftransport are taken from DEFRA (DEFRA, 2005). This reference does not specifyinclusion of an empty return trip in GHG emissions factors, but the factors for rail andsea transport given by Defra are very similar to those in Concawe 2003, which doesinclude empty return trips in its emissions factors. Therefore, the use of the Defrafigures for rail, air and sea transport is considered reasonable at this stage ofdevelopment of the Calculator.5.6 CreditsWheat-to-ethanol production chains also produce a number of by-products and coproducts,some of which are valuable products in their own right. It is thereforeessential to consider multiple products when allocating the total GHG emissions thatare associated with a particular production chain. Currently, there is not an acceptedbest method of performing this allocation. In the Calculator, allocation by substitutionis used following the recommendations of Rickeard et al (LCVP, 2004). In thismethod, the primary product is assigned the total GHG emissions minus credits equalto the GHG emissions avoided as a result of coproduct displacement of alternativeproducts elsewhere.5.6.1 Distillers Dark Grains and Solubles (DDGS)DDGS is a coproduct of all the wheat-to-ethanol production chains included in theCalculator. DDGS has value as an animal feed, and may also be used as a fuel forcofiring in coal power stations. The Calculator allows for a choice between these twooptions for the use of DDGS coproduct and then calculates credits for GHG emissionsavoided through displacement of equivalent amounts of animal feed productionelsewhere or electricity generation as per UK-grid. Based on data from the LCVPstudy, it is assumed that 0.39 tonne of DDGS (10% moisture) is produced for everytonne of wheat grain (dry basis) going into the ethanol plant. This ratio may changeaccording to wheat and process characteristics, and future versions of the Calculatorwould allow variation of this parameter. DDGS could also be used to provide processenergy and electricity in a similar way to the ‘straw-fired’ option discussed above, butthis is not considered in this version of the Calculator.
20As in the LCVP study, imported soya bean meal from the USA is chosen as theanimal feed product that is substituted by DDGS in calculations of animal feedcredits. Future versions of the Calculator would allow for a choice of different animalfeed products substituted, but currently only limited data is available on lifecycleGHG emissions from production of other animal feed products that may be displacedby DDGS. Each kilogram of DDGS is considered to substitute for 0.78 kg of soyabean meal, on the basis of relative protein content (Concawe, 2003). Production in theUSA and transport to the UK of each kilogram of soya bean meal result in emissionsof 0.46 kg CO 2 eq.For DDGS used as fuel in co-firing for electricity production, a credit of 945 kgCO 2 eq per tonne of DDGS is applied. This is based on the assumptions that:• DDGS (10% moisture) has a lower heating value of 18.2 GJ/t, the same aswheat grain on a dry basis.• DDGS is converted to electricity at the UK average rate of 0.325 gigajoule ofelectricity output per gigajoule of primary energy input.• The electricity generated from DDGS substitutes for other electricitygeneration with GHG emissions equal to the UK average of 160 kgCO 2 eq/GJe (Table 4).It may be argued that electricity generated by the cofiring of DDGS with coaldisplaces marginal coal-based electricity generation, and that the calculations of GHGemission credits should be based on this coal-derived electricity rather than the UKgrid average. This will need to be considered in future versions of the Calculator.5.6.2 Surplus electricityAny surplus electricity produced by an ethanol plant (that is, any electricity that isgenerated but not used by the plant) is assumed to displace generation of an equalamount of grid-supplied electricity with GHG emissions equal to the UK electricitygeneration average of 160 kg CO 2 eq/GJe, and this value is used to calculate creditsfor those ethanol production chains which include generation of surplus electricity.5.6.3 Set-aside, carbon dioxide and strawIn the Calculator, all wheat for ethanol production is assumed to be grown onrotational set-aside, and a credit of 922 MJ/ha (equivalent to 25.8 l/ha of diesel fuel) isapplied for avoidance of maintenance of set-aside land.As discussed in section 5.3 above, no credits are assigned for straw not used as fuel inthe ethanol plant. Similarly, no credits are assigned for any carbon dioxide by-productthat may be captured from the wheat-to-ethanol fermentation process. Most of thecarbon dioxide that is produced and sold industrially originates as a by-product ofother industrial operations, and if this CO 2 was not captured, it would be vented toatmosphere. Thus, CO 2 capture from bioethanol production would not result in a netdisplacement of CO 2 emissions. If carbon dioxide is captured and stored indefinitely,then a CO 2 credit would be appropriate. Future versions of the Calculator maytherefore need to include such a credit.
216. Default Bioethanol Production ChainsIn order to illustrate typically expected inputs, yields and resultant GHG emissions ofdifferent bioethanol production chains, the Data Input Page of the Calculator providesthe option to accept the input data adopted by the LCVP experts for each of the mainsections of the production chain by clicking on an associated “Set Default Values”button. These default process characteristics are described below.6.1 Basic wheat-to-ethanol pathwayThe values adopted by the LCVP study for the basic non-energy inputs and yields ofthe different processes in the bioethanol production chain are shown in Figure 10.0.081 t SeedWheat production and supplyJCULTIVATION AND HARVESTING0.437 ha1.424 tstraw3.499 t wheat(16% moisture content)DRYING AND STORAGE3.03 t dry wheat grain(3% moisture content)TRANSPORT (road)Ethanol productionMILLING10 twaterHYDROLYSIS AND FERMENTATION0.913 tCO210 t alcohol (10% ethanol)+ 1.14 t solidsDISTILLATIONDRYING1.14 tDDGS1.058 t distillate(94.5% ethanol)9.942 twaste waterDEHYDRATION1 t bioethanolFigure 10: Basic assumptions for default wheat to ethanol pathways (LCVP, 2004)
226.2 Farming Inputs and YieldsFor calculation of default GHG emissions from the farming component of thebioethanol production chain, the values in Table 6are used.Table 6: Default farming inputs and yieldsInputs Straw ploughed back All straw removedDiesel fuel, l/ha 141 141K fertilizer (as K), kg/ha 46 164P fertilizer (as P), kg/ha 41 53N fertilizer (as N), kg/ha 185 253Pesticides (as active ingredient), 2 2Seed material, kg/ha 185 185YieldsWheat grain, t/ha 8.0 8.0Wheat Straw, t/ha 1.42 1.426.3 Pre-processing (Drying and Storage)For the default case, wheat grain is assumed to be harvested at 16% mass moisture anddried to 3% mass moisture before delivery to the ethanol plant. The drying and storageof the wheat consumes 18.5 litres of diesel fuel and 11.7 kWh of electricity per tonneof dried grain produced.6.4 Transport to ProcessingIn all default production chains, dried wheat grain is assumed to be transported byroad in diesel-fuelled trucks over an average distance of 50 km from the farm toethanol plant.6.5 ProcessingThe default processing plant yields 416 litres of anhydrous ethanol per tonne of driedwheat grain delivered to the plant. Additionally, 1.14 tonne of distiller’s dried grainsand solubles is produced for every tonne of anhydrous ethanol produced. The entireproduction process at the plant requires 9.75 GJ of heat and 1.45 GJ (403 kWh) ofelectricity per tonne of anhydrous ethanol produced.The first energy supply option in the calculator simply generates the necessary heatusing a natural-gas fired boiler and imports the necessary electricity from the grid.The other options use combined heat and power (CHP) equipment sized to match theheat requirements of the plant, and produce varying amounts of surplus electricity.
23The LCVP study group used typical operating characteristics and actual data fromsimilar equipment currently in operation to determine the fuel inputs and energyoutputs of suitably sized combined heat and power generation systems. These defaultfuel inputs and surplus electricity outputs of the five energy supply options includedin the Calculator are summarized in Table 7.Table 7: Default fuel inputs and surplus electricity outputsFuel Inputs and SurplusElectricity OutputsNG boiler + gridNG boiler +steam turbineNG GT+steam gen+steam turbineNG GT+fired steamgen+steam turbineStraw boiler +steam turbineNatural gas consumption, GJ/t eth 11.8 14.4 27.2 18.2 0Imported electricity, kWh/t ethanol 403 0 0 0 0Surplus electricity, kWh/t ethanol 0 396 2525 1389 575Straw fuel consumption, kg/l ethan 0 0 0 0 1.13For the straw-burning CHP option, the default characteristics involve the assumptionthat the quantity of straw available for fuel is equal to the total straw co-producedwith the wheat grain being converted into ethanol. Therefore, 1.424 t of straw is burntper tonne of ethanol produced, equating to 1.13 kg straw/l ethanol (Table 7). It is alsoassumed that the straw is transported by road in diesel-fuelled trucks an averagedistance of 50 km from the farm to ethanol plant.6.6 Transport to End UseIn all default production chains, ethanol is assumed to be transported by road indiesel-fuelled trucks over an average one way distance of 150 km from ethanol plantto fuel blending/distribution site.
247. ReferencesBauen, A., Howes, J., Chase, A., Tipper, R., Inkinen, A., Lovell, J. and Woods, J.Feasibility Study on Certification for a Renewable Transport Fuel Obligation.Eds.: Archer, G. (Fuels Working Group). London, UK: LCVP. FWG-P-05-07:1-80, 2005.http://www.lowcvp.org.uk/resources/agendasandminutes/working.cfm?catid=3&catName=FuelsCanadian Pollution Prevention Information Clearinghouse (CPPIC). Glossary.Available at: www.ec.gc.ca/cppic/En/glossary.cfmEU- Commission of the European Communities. Directive 2003/30/EC - on thepromotion of the use of biofuels or other renewable fuels for transport.Brussels, Belgium: DG Environment. 2003/30/EC:1-5, 2003.CONCAWE, EUCAR & JRC.. Well-to-Wheels analysis of future automotive fuelsand powertrains in the European context. Version 1a. Appendix 1. EuropeanCommission. Brussels. 2003CONCAWE, EUCAR & JRC. Well-to-Wheels analysis of future automotive fuels andpowertrains in the European context. Version 1b. European Commission.Brussels 2004Defra. Annexes to Guidelines for Company Reporting on Greenhouse Gas Emissions.2005http://www.defra.gov.uk/environment/business/envrp/gas/envrpgasannexes.pdfDefra. The British Survey of Fertiliser Practice. Fertiliser Use on Farm Crops Year2002. ISBN 1-86190-128-3. p.65, 2003.Elsayed, M.A., Matthews, R. and Mortimer, N.D. Carbon and Energy Balances for aRange of Biofuel Options" Energy Technology Support Unit, Harwell, UnitedKingdom, Report B/B6/00784/REP, March 2003.ww.shu.ac.uk/rru/projects/biofuels/biofuels.html.GM & LBST. Report: GM Well-to-Wheel Analysis of Energy Use and GreenhouseGas Emissions of Advanced Fuel/Vehicle Systems – A European Study. L-B-Systemtechnik GmbH. Germany. 2002. Available at: www.lbst.de/gm-wtwGM & LBST.. Annex “Full Background Report – Methodology, Assumptions,Descriptions, Calculations, Results to the GM Well-to-Wheel Analysis ofEnergy Use and Greenhouse Gas Emissions of Advanced Fuel/VehicleSystems – A European Study. L-B-Systemtechnik GmbH. Germany. 2002.Available at: www.lbst.de/gm-wtwIPCC. Climate Change 2001: The Scientific Basis. Eds.: Houghton, J.T., Ding, Y.,Griggs, D.J., Noguer, M., van der Linden, P.J., Da, X., Maskell, K., andJohnson. C.A.. NY, USA.: Cambridge University Press; Working Group I,2001. http://www.grida.no/climate/ipcc_tar/index.htm
25IPIECA. Climate Change: A Glossary of Terms. 2nd Edition. International PetroleumIndustry Environmental Conservation Association. London. 2000.ISO. ISO 14040: Environmental management - Life cycle assessment - Principles andframework. International Standards Organisation, Geneva, Switzerland. 1997.http://www.iso.org/iso/en/CatalogueDetailPage.CatalogueDetail?CSNUMBER=23151LCVP. Well-to-Wheel Evaluation for Production of Ethanol from Wheat. A Report bythe Low Carbon Vehicle Partnership (LowCVP) Fuels Working Group.London. 2004. http://www.lowcvp.org.uk [see Rickeard et al. 2004, for moredetails].Mortimer, N.D., Elsayed, M.A. and Horne, R. Energy and Greenhouse Gas Emissionsfor Bioethanol Production from Wheat Grain and Sugar Beet. ResourcesResearch Unit of the School of Environment and Development, SheffieldHallam University, UK. Report No. 23/1 for British Sugar, 2004.Mosier, A.R., Syers, J.K., Freney, J.R. Nitrogen Fertilizer: An Essential ComponentOf Increased Food, Feed, And Fiber Production. Book Chapter in: A.R.Mosier, J.K Syers And J.R. Freney (Eds). Agriculture And The NitrogenCycle: Assessing The Impacts Of Fertilizer Use On Food Production And TheEnvironment. Scope Vol. 65, Island Press, Washington, D.C. Pp. 15. 2004.NREL. HOMER - The Micropower Optimization Model. Help. Golden Colorado,USA. 2003.Rickeard, D.J., Punter, G., Larivé, J.-F., Edwards, R., Mortimer, N.D., Horne, R.,Bauen, A., and Woods, J. WTW Evaluation for Production of Ethanol fromWheat. London: LCVP. Pg: 1-39, 2004.Toyota Motor Corporation. Well-to-Wheel Analysis of Greenhouse Gas Emissions ofAutomotive Fuels in the Japanese Context. Well-to-Tank Report. 2004.Turley, D., McKay, H., and Boatman, N. Environmental Impacts of Cereal andOilseed Rape Cropping in the UK. London, UK: <strong>HGCA</strong>. Research Report No:54:1-124, 2005.Woods, J. and Bauen, A. Technology Status Review and Carbon Abatement Potentialof Renewable Transport Fuels (RTF) in the UK. DTI; AEAT.B/U2/00785/REP URN 03/982: Pp 150, 2003.http://www.dti.gov.uk/energy/renewables/publications/pdfs/B200785.pdf
26Definitions and terminologyThe following glossary of definitions and terminology has been derived from a seriesof existing glossaries 1 .Alternative Energy is the energy derived from non-fossil fuel sources.Alternative Transportation Fuel. Under the Alternative Fuels Act, 1995, alternativetransportation fuel must include, but is not limited to, ethanol, methanol, propane gas,natural gas, hydrogen or electricity, and these must be used as a sole source of directpropulsion energy (see also Renewable Transport Fuel).Alternative Fuel Vehicle is a vehicle purchased or leased from an original equipmentmanufacturer (or converted in the aftermarket) that is capable of operating on analternative transportation fuel. Flex-fuel and bi-fuel vehicles are also considered to bealternative fuel vehicle, as are vehicles that operate on blended fuels, when analternative transportation fuel makes up at least fifty percent of the blend.Analysis the process of dividing up the landscape into its component parts to gain abetter understanding of it.Anthropogenic Emissions is the emissions of greenhouse gases associated withhuman activities. These include burning of fossil fuels for energy, deforestation andland-use changes.Approach is the step-wise process by which landscape assessment is undertaken.Assessment is a term to describe all the various ways of looking at, analysing,evaluating and describing the landscape.Baseline is a projected level of future emissions against which reductions by projectactivities could be determined, or the emissions that would occur without policyintervention.Biofuel is a fuel produced from dry organic matter or combustible oils produced byplants. Examples of biofuel include alcohols (from fermented sugar), black liquorfrom the paper manufacturing process, wood and soybean oil.Biological Diversity is the variety of life and the natural processes of which livingthings are a part. This includes the living organisms, the genetic differences betweenthem, and the communities in which they occur (Audubon Nature Institute).Biomass is the total dry organic matter or stored energy content of living organisms.Biomass can be used for fuel directly by burning it (e.g., wood), indirectly byfermentation to an alcohol (e.g., sugar) or extraction of combustible oils (e.g.,soybeans).Carbon Cycle is the natural processes that govern the exchange of carbon (in theform of CO 2 , carbonates and organic compounds etc.) among the atmosphere, ocean1 Adapted from 1) IPIECA. 2000. Climate Change: A Glossary of Terms. 2nd Edition; 2) NREL. 2002.HOMER - The Micropower Optimization Model. Help. Golden. CO; 3) Canadian Pollution PreventionInformation Clearinghouse (CPPIC). Glossary. Available at: www.ec.gc.ca/cppic/En/glossary.cfm
27and terrestrial systems. Major components include photosynthesis, respiration anddecay between atmospheric and terrestrial systems (approximately 100 billiontonnes/year (Gt); thermodynamic invasion and evasion between the ocean andatmosphere, operation of the carbon pump and mixing in the deep ocean (approx. 90billion tonnes/year). Deforestation and fossil fuel burning releases approximately 7 Gtinto the atmosphere annually. The total carbon in the reservoirs is approximately 2000Gt in land biota, soil and detritus, 750 Gt in the atmosphere and 38,000 Gt in theoceans. (Figures from IPCC WGI Scientific Assessment 1990.) Over still longerperiods geological processes of outgassing, volcanism, sedimentation and weatheringare also important.Carbon Dioxide, or CO 2 is a naturally occurring gas. It is also a by-product ofburning fossil fuels and biomass, as well as land-use changes and other industrialprocesses. It is the principal anthropogenic GHG that affects the earth’s temperature.It is the reference gas against which other GHGs are indexed and therefore has a‘Global Warming Potential’ of 1. Carbon dioxide constitutes approximately 0.036 percent of the atmosphere. The mass ratio of carbon to carbon dioxide is 12:44.Carbon Dioxide Fertilization is an enhancement of plant growth or yield as a resultof an increase in the atmospheric concentration of CO 2 .Carbon emissions (t/yr) is the amount of carbon emitted annually by the powersystem. Carbon emissions result from the consumption of fuels (including biomass)and from the purchase of power from the utility grid. The annual carbon emission of agenerator or boiler is equal to its annual fuel consumption multiplied by the fuelcarbon content. The annual grid-related carbon emissions are equal to the total netgrid energy purchased (which may be negative) times the grid carbon content.Note: This variable refers to carbon emissions, not carbon dioxide emissions. Tocalculate carbon dioxide emissions, multiply the carbon emissions by 3.67 (thisassumes all carbon is released in the form of carbon dioxide).Carbon Intensity is carbon dioxide emissions per unit of energy or economic output.Carbon Intensity is a measure of the amount of greenhouse gas produced per unit ofproduct over its lifecycle (or the major part of its lifecycle). Carbon intensity isnormally expressed in units of CO 2 equivalent emissions per unit of the product,taking into account other greenhouse gases such as methane and oxides of nitrogenthat may be emitted (Bauen, et. al., 2005).Carbon Sequestration is the long-term storage of carbon or carbon dioxide in theforests, soils, ocean, or underground in depleted oil and gas reservoirs, coal seams,and saline aquifers. Examples include: the separation and disposal of CO 2 from fluegases or processing fossil fuels to produce H2 and carbon-rich fractions; and thedirect removal of CO 2 from the atmosphere through land use change, afforestation,reforestation, ocean fertilization, and agricultural practices to enhance soil carbon.Carbon Sinks is a natural or man-made systems that absorb carbon dioxide from theatmosphere and store them. Trees, plants, and the oceans all absorb CO 2 and,therefore, are carbon sinks.Carbon Tax is a tax placed on carbon emissions. It is similar to a BTU tax, exceptthat the tax rate is based on the fuel’s carbon content.Climate is the average trend of weather, including its variability in a geographicalregion. The averaging period is typically several decades.
28Climate Change (UNFCCC definition) is a change of climate which is attributeddirectly or indirectly to human activity that alters the composition of the globalatmosphere and which is in addition to natural climate variability over comparabletime periods.Combined cycle is an electricity generation where the waste heat of a gasturbinegenerator is used to heat water in a boiler to drive a steam-turbine generator, therebyincreasing efficiency.Cogeneration is the use of waste heat from electricity generation, such as exhaustfrom gas turbines, for either industrial purposes or district heating.Coppicing is the traditional method of woodland management in which trees are cutdown near to the ground to encourage the production of long, straight shoots that canbe harvested.Distillers’ Dark Grains and Solubles or DDGS is a protein-rich residue/ by-productleaves after the wheat grain processing.Emissions (UNFCCC Definition) is the release of greenhouse gases and/or theirprecursors into the atmosphere over a specified area and period of time.Emissions are the substances released into the atmosphere or into water. In climatechange, greenhouse gas emissions are the release of gases such as carbon dioxide,methane and nitrous oxide through natural and human activities.Emissions Cap is a mandated restraint, in a scheduled timeframe that puts a ‘ceiling’on the total amount of anthropogenic greenhouse gas (GHG) emissions that can bereleased into the atmosphere. The Kyoto Protocol mandates caps on the GHGemissions released by Annex B, or developed, countries.Emissions Reduction Unit, or ERU is the ERU represents a specified amount ofgreenhouse gas emissions reductions achieved through a Joint Implementation projector as the unit of trade in greenhouse gas emissions trading systems.Emissions Trading is a market-based approach to achieving environmentalobjectives that allows those reducing greenhouse gas (GHG) emissions below what isrequired to use or trade the excess reductions to offset emissions at another sourceinside or outside the country. In general, trading can occur at the domestic,international and intra-company levels. Article 17 of the Kyoto Protocol, allowsAnnex B countries to exchange emissions obligations. Negotiations will determine theextent to which firms and others may be allowed to participate. Internationalemissions trading constitutes one of the Kyoto Mechanisms, designed to provideAnnex B countries cost-effective flexibility in reducing emissions to achieve theiragreed commitments.Ethanol is a liquid that is produced chemically from ethylene or biologically from thefermentation of various sugars from carbohydrates found in agricultural crops andcellulosic residues from crops or wood. Depending on how it is produced, it can beused as a substitute for gasoline, and can result in significantly less greenhouse gasemissions than gasoline. It is also known as ethyl alcohol or grain alcohol.Fossil Fuels are the carbon-based fuels, including coal, oil and natural gas.Fuel carbon content (% by mass) is the carbon content of the fuel as a percent of itsmass. This value is used to calculate the annual carbon emissions of the system.
29Fuel Switching is a supplying energy services using different fuels. Often used torefer to actions that reduce CO 2 emissions from electric utilities by switching fromcoal to natural gas.Global Warming is the view that the earth’s temperature is being increased, in part,due to emissions of greenhouse gases associated with human activities, such asburning fossil fuels, biomass burning, cement manufacture, cow and sheep rearing,deforestation and other land-use changes.Global Warming Potential, or GWP is a time dependent index used to compare theradiative forcing, on a mass basis, of an impulse of a specific greenhouse gas relativeto that of CO 2 . Gases included in the Kyoto Protocol are weighted in the firstcommitment period according to their GWP over a 100-year time horizon aspublished in the 1995 Second Assessment Report of the IPCC. In that report,methane, for example has a radiative forcing that was estimated to be about 21 timesgreater than that of CO 2 , thus it has a GWP of 21.Greenhouse Effect is the trapping of heat by naturally occurring heat retainingatmospheric gases (water vapour, carbon dioxide, nitrous oxide, methane and ozone)that keeps the earth about 30° C (60° F) warmer than if these gases did not exist.Greenhouse Gases (GHG) are gases in the earth’s atmosphere that absorb and reemitinfra-red radiation. These gases occur through both natural and humaninfluencedprocesses. The major GHG is water vapour. Other GHGs include carbondioxide, nitrous oxide, methane, ozone and CFCs.GHG certification is a process by which a product or service is delivered with aformally declared carbon intensity, which is a measure of the amount of GHGsproduced expressed in units of CO 2 equivalent. The process is normally based upon astandardised method that makes use of a combination of direct information provisionor measurements and assumptions taken from the scientific literature. The declaredcarbon intensity of each could be linked to the number of RTFO certificates issued(Bauen et. al., 2005).Intergovernmental Panel on Climate Change, or IPCC is a Panel established in1988, by governments under the auspices of the World Meteorological Organizationand the UN Environment Programme. It prepares assessments, reports and guidelineson the science of climate change, its potential environmental, economic and socialimpacts, technological developments, possible national and international responses toclimate change and crosscutting issues. It provides advice to the UNFCCC’sConference of the Parties. It is currently organized into 3 Working Groups whichaddress: I) Science; II) Impacts, Adaptation and Vulnerability; and III) Mitigation;there is also a Working Group to address GHG Inventories.International Energy Agency, or IEA is a Paris-based organization formed in 1973by the major oil-consuming nations to manage future oil supply shortfalls.Kyoto Lands. The Kyoto Protocol describes land use, land use change and forestryactivities that require or allow the net GHG emissions from sinks to be accounted forby Parties in meeting their emission reduction commitments. The lands on whichthese activities take place are designated as Kyoto lands (as defined in the IPCC draftreport on LULUCF).
30Kyoto Protocol is the Protocol, drafted during the Berlin Mandate process, that, onentry into force, would require countries listed in its Annex B (developed nations) tomeet differentiated reduction targets for their greenhouse gas emissions relative to1990 levels by 2008–12. It was adopted by all Parties to the Climate Convention inKyoto, Japan, in December 1997.Landscape is primarily the visual appearance of the land including its shape, formand colours. However, landscape is not purely a visual phenomenon. The landscaperelies on a range of other dimensions including geology, landform, soils, ecology,archaeology, landscape history, land use, architecture and cultural associations.Land Cover is a combination of land use and vegetation that cover the land surface.Life Cycle is consecutive and interlinked stages of a product system, from rawmaterial acquisition or generation of natural resources to the final disposal (ISO14040).Life-Cycle Analysis is an analysis of the environmental impact of a product duringthe entirety of its lifecycle, from resource extraction to post-consumer waste disposal.It is a comprehensive approach to examining the environmental impacts of a productor package.Life-Cycle Assessment or LCA is a specific method for systematically identifying,quantifying and assessing inputs and outputs (i.e. sources of environmental impact)throughout a product's life cycle. It is one of a range of tools that support life cyclemanagement, but is not a prerequisite for life cycle management (EnvironmentCanada - Environmental Life Cycle Management: A Guide to Better BusinessDecisions). See also ‘Well-to-Wheel’ and ‘Well-to-Tank’ LCA.Life-Cycle Assessment or LCA is a process of evaluating the effects that a producthas on the environment over the entire period of its life thereby increasing resourceuseefficiency and decreasing liabilities. It can be used to study the environmentalimpact of either a product or the function the product is designed to perform. LCA iscommonly referred to as a “cradle-to-grave” analysis. LCA's key elements are: (1)identify and quantify the environmental loads involved; e.g. the energy and rawmaterials consumed, the emissions and wastes generated; (2) evaluate the potentialenvironmental impacts of these loads; and (3) assess the options available forreducing these environmental impacts.Life cycle assessment (LCA) is:the overall process of assessing the life cycle impacts associated with a system,function, product or service. Sometimes considered to include the Initiation,Inventory, Impact Analysis and Improvement stages (SPOLD 93):• A concept and a method to evaluate the environmental effects of a productholistically, by analysing its entire life cycle. This includes identifying andquantifying a-energy and materials used and wastes released to theenvironment, assessing their environmental impact, and evaluatingopportunities for improvement (CAN 94);• Part of an overall life cycle assessment in which only the environmentalconsequences are considered (CML 95);• Compilation and evaluation of the inputs, outputs and the potentialenvironmental impacts of a product system throughout its life cycle (ISO14040).
31Life Cycle Impact Assessment is a phase of LCA aimed at understanding andevaluating the magnitude and significance of the potential environmental impacts of aproduct system (ISO 14040, ISO 97b).Methane, or CH 4 is one of the six greenhouse gases to be included under the KyotoProtocol, it has a relatively short atmospheric lifetime of 10± 2 years. Primary sourcesof methane are landfills, coal mines, paddy fields, natural gas systems and livestock.The SAR (1995) estimate of the Global Warming Potential of methane is 21, over a100-year time horizon. See ‘Global Warming Potential’.Nitrous Oxide, or N 2 O is one of the six greenhouse gases to be curbed under theProtocol, it is generated by burning fossil fuels and the manufacture of fertilizer. It hasa Global Warming Potential of 310 over a 100-year time horizon. See ‘GlobalWarming Potential’.Nitrous Oxide, or N 2 O is a colourless gas that occurs both naturally in theenvironment in plants and manure and from human-made sources such as chemicalproduction and combustion. N 2 O is a greenhouse gas that remains in the atmospherefor long periods of time, absorbing heat and radiating it back to the earth's surfaceinstead of allowing it to pass through into space.Ozone. Ozone (O 3 ) is a greenhouse gas. In the troposphere, or lower part of theatmosphere, O 3 can be a constituent of smog. It is created naturally and also byreactions in the atmosphere involving gases resulting from human activities, includingNOx, or nitrogen oxides, from motor vehicles and power plants. The MontrealProtocol seeks to control chemicals which destroy ozone in the stratosphere (upperpart of the atmosphere) where ozone absorbs ultra-violet radiation.Product Life Cycle is the summary of activities that go into making, transporting,using, and disposing of a product. To determine the environmental impacts of aparticular product's life cycle, a lifecycle-analysis can be conducted on the activities,to identify, quantify and assess all inputs and outputs.Renewables are the energy sources that are constantly renewed by natural process.These include non-carbon technologies such as solar energy, hydropower and wind aswell as technologies based on biomass. Life cycle analyses are required to assess theextent to which such biomass based technologies may limit net carbon emissions.Renewable Energy is the several energy sources that have little in common from atechnology standpoint, but share one characteristic: they all produce electricity orthermal energy without depleting resources. Renewable energy sources include water,biomass, wind, solar, earth and waste stream energy.Renewable Transport Fuel is defined by the UK Energy Act 2004 as: i) biofuel, ii)blended biofuel; iii) any solid, liquid or gaseous fuel (other than fossil fuel or nuclearfuel) which is produced: a) wholly by energy from a renewable source; or b) whollyby a process powered by such energy; or iv) any solid, liquid or gaseous fuel which isof a description of fuel designated by an RTF order as renewable transport fuel ( seealso: Alternative Transportation Fuel).Renewable Resource is the natural resources that are capable of regeneration.Renewable resources can essentially never be exhausted, usually because they arecontinuously produced (e.g., tree biomass, fresh water, and fish). Renewableresources are those natural resources that are naturally replenished, but whose
32continued supply depends, in many cases, on proper management (e.g. tree biomass,fresh water, fish).Second Assessment Report, or SAR is a published by the IPCC in 1995 the SARprovided a comprehensive overview of the state of knowledge on climate change atthat time. It contains the widely cited statement ‘the balance of evidence suggests thatthere is a discernible human influence on global climate’. The IPCC’s ThirdAssessment Report was finalised in 2001 (see below).Sequestration is an uptake of carbon dioxide from the atmosphere by plants and itssubsequent storage as biomass.Semi-natural Vegetation is any type of vegetation that has been influenced byhuman activities, either directly or indirectly.Sinks (UNFCCC Definition) are any process or activity or mechanism which removesa greenhouse gas or a precursor from the atmosphere.Sulphur Dioxide or SO 2 is a colourless gas with a pungent odour, irritates the upperrespiratory tract in humans and leads to acidic deposition/acid rain. Originates fromboth anthropogenic (human) and natural sources and has been identified as one of theprincipal precursors to fine particulate matter. The main anthropogenic sources arefrom combustion in transportation, industry and the electric power generation sectors,whereas emissions from natural sources are mainly from volcanoes, marine bacteriaand wetlands.Sustainability is the ability of an ecosystem to maintain ecological processes andfunctions, biodiversity, and productivity over time. Also a term used by governmentsto describe the efficient use of the earth's resources to ensure there will be adequateresources to support the economy and maintain a healthy environment for futuregenerations to come.Sustainable Development is a Development that meets the needs of the presentwithout compromising the ability of future generations to meet their own needs(World Commission on Environment and Development - the BrundtlandCommission). Development is essential to satisfy human needs and improve thequality of human life. At the same time, development must be based on the efficientand environmentally responsible use of all of society's natural, human, and economicresources.Sustainable Transportation is an integrating economic, social and environmentalconsiderations into decisions affecting transportation activity. A sustainabletransportation system is one that is safe, efficient and environmentally responsible.System Boundary is a LCA term referring to then bounds set on a study in terms ofwhat processes and activities will be analysed as part of the study. For example, in astudy of a particular building all major materials may be within the system boundary,while minor material and worker travel may be excluded from the study and thereforeleft outside the system boundary. It is important to understand where people have settheir system boundaries when comparing different LCA data.Third Assessment Report, or IPCC TAR is the third in a series of AssessmentReports prepared by the Intergovernmental Panel on Climate Change which reviewthe existing scientific literature on the subject, finalized in 2001. It contains threemain sections: Science; Impacts, Adaptation and Vulnerability; and Mitigation. Itincludes a 50- 80 page Synthesis Report, which will draw upon the three main
33sections and other IPCC Special Reports to answer a number of policy-relevantscientific and technical questions (asked by UNFCCC SBSTA and refined by theIPCC Plenary). Each of the three main sections and the Synthesis Report will have ashort Summary for Policy Makers. The information in the TAR will be considered bygovernments during UNFCCC negotiations.The Carbon Tax (£/t) is the cost penalty applied to the system for its total carbonemissions, expressed in dollars per tonne of carbon (not carbon dioxide).The System Fixed Capital Cost (£) is the capital cost that occurs at the start of theproject regardless of the size or architecture of the power system. It is used tocalculate the other annualized capital cost, so it affects the total net present cost ofeach system, but it affects them all by the same amount. It therefore has no effect onthe system rankings.The System Fixed Operation and Maintenance Cost (£/yr) is the recurring annualcost that occurs regardless of the size or architecture of the power system. It is used tocalculate the other annualized capital cost, so it affects the total net present cost ofeach system. But it affects them all by the same amount, so it has no effect on thesystem rankings.The Other O&M Cost (%/yr) is the system fixed O&M cost plus the cost of unmetload plus the cost of carbon emissions.The system fixed capital cost and the capital cost associated with any primary loadefficiency measures are lumped together into the "other capital cost".UN Environment Programme, or UNEP is the UN agency, established in 1972, tocoordinate the environmental activities of the UN. It aims to help reinforce andintegrate the large number of separate environmental efforts by intergovernmental,non-govern- mental, national and regional bodies. UNEP has fostered thedevelopment of the UNFCCC and the Convention on Biological Diversity.UN Framework Convention on Climate Change, or UNFCCC is a treaty signed atthe 1992 Earth Summit in Rio de Janeiro by more than 150 countries. Its ultimateobjective is the ‘stabilization of greenhouse gas concentrations in the atmosphere at alevel that would prevent dangerous anthropogenic [human-induced] interference withthe climate system’. While no legally binding level of emissions is set, the treatystates an aim by Annex I countries to return these emissions to 1990 levels by the year2000. The treaty took effect in March 1994 upon the ratification of more than 50countries; a total of some 160 nations have now ratified. In March 1995, theUNFCCC held the first session of the Conference of the Parties (COP) the supremebody of the Convention in Berlin. Its Secretariat is based in Bonn, Germany. In thebiennium 2000–01, its approved budget and staffing level are approximately US$12Mannually with approximately 80 personnel.Used Oil is oil from industrial and non-industrial sources which has becomeunsuitable for its original purpose due to the presence of impurities or the loss oforiginal properties.Well-to-Tank (WTT) LCA covers the full production and conversion part of thebiofuel chain up to delivery of the end-fuel. This is notionally to the ‘tank’ of avehicle but is often simplified to encompass delivery only to a point where therenewable fuel is treated in exactly the same manner as the reference fuel (e.g. petrol).
34In this case ‘delivery’ is assumed to mean to the point of blending with the referencefuel or the ‘duty point’.Well-to-Wheel (WTW) LCA covers the entire production, conversion and usebiofuel chain. It therefore includes the whole ‘Well-to-Tank’ component plusdelivery to the garage forecourt, fuelling of the vehicle and final use in the vehicle.