Company OverviewPassenger Traffic In Feb. <strong>2008</strong>, capacity on domestic routesincreased by 11,3%, traffic increased by 7,3%,load factor decreased by 3.0 pt to 70,5%On international routes; capacity increased by7,7%, traffic increased by 13,3%, while load factorincreased by 2.6pt to 68,2%Total capacity increased by 8,4% while trafficincreased by 12%. Load factor was 68,1%(+2.2 pt)THY Passenger Traffic(Billion)60504030201002468.917Capacity-Traffic Development Load Factor %2467.0162570.2173071.5213769.4254272.73065.9642002 2003 2004 2005 2006 2007 FebASK RPK L/F %200768.164Feb<strong>2008</strong><strong>2008</strong>E807570656055504540(%)THY Passenger Traffic Domestic 2005 2006 2007 Feb'07 Feb'08 07 vs '08Landings 65,140 78,910 86,825 12,081 13,333 10.4%ASK (million) 5,431 7,123 8,087 1,138 1,266 11.3%RPK (million) 3,992 5,213 5,899 836 898 7.3%Passenger # (million) 7,151 8,906 9,935 1,369 1,507 10.0%L/F % 73.5 73.2 72.9 73.5 70.5 -3.0 ptTHY Passenger Traffic Int'l 2005 2006 2007 Feb'07 Feb'08 07 vs '08Landings 56,864 73,626 80,739 11,312 12,678 12.1%ASK (million) 22,741 29,811 33,532 4,824 5,197 7.7%RPK (million) 16,355 20,170 24,370 3,094 3,506 13.3%Passenger # ( '000) 6,483 8,040 9,711 1,196 1,382 15.6%L/F % 71.9 67.7 73.3 65.6 68.2 2.6 ptTHY Passenger Traffic Total 2005 2006 2007 Feb'07 Feb'08 07 vs '08Landings 122,004 152,536 167,564 23,393 26,011 11.2%ASK (million) 28,172 36,934 41,618 5,962 6,463 8.4%RPK (million) 20,347 25,383 30,269 3,931 4,403 12.0%Passenger # (million) 13,634 16,946 19,646 2,565 2,889 12.6%L/F % 71.6 68.7 72.7 65.9 68.1 2.2 ptTotal Passenger Traffic(2007 vs <strong>2008</strong>)Landing : up by 11%ASK : up by 8%RPK : up by 12%Passenger : up by 12.6%L/F: 2 pointsSource: Company10Significant growth in operational highlights
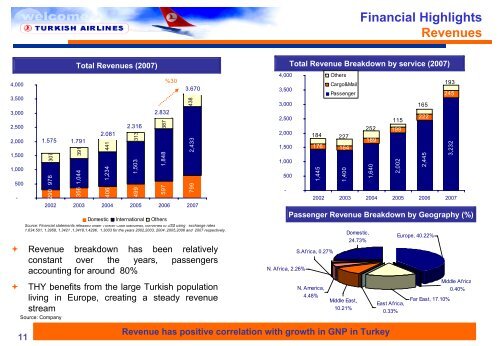
Financial HighlightsRevenues4,0003,5003,0002,5002,0001,5001,000500- Revenue breakdown has been relativelyconstant over the years, passengersaccounting for around 80%1.575307978290Total Revenues (2007)Source: Financial statements released under <strong>Turkish</strong> CMB standards, converted to US$ using exchange rates1.634.501, 1.3958, 1.3421 ,1.3418,1.4296, 1.3003 for the years 2002,2003, 2004 ,2005,2006 and 2007 respectively.THY benefits from the large <strong>Turkish</strong> populationliving in Europe, creating a steady revenuestreamSource: Company1.7913911,0443562.0814411,2344062.3163131,5034992.8321,8485972,4337992002 2003 2004 2005 2006 2007387Domestic International Others%303.6704384,0003,5003,0002,5002,0001,5001,000500-N. Africa, 2.26%Total Revenue Breakdown by service (2007)1841761,445OthersCargo&MailPassenger2271641,4002521891,640115199Passenger Revenue Breakdown by Geography (%)2,0021652222,4451932453,2322002 2003 2004 2005 2006 2007S.Africa, 0.27%N. America,4.48%Middle East,10.21%Domestic,24.73%East Africa,0.33%Europe, 40.22%Far East, 17.10%Middle Africa0.40%11Revenue has positive correlation with growth in GNP in Turkey