EENG 226 Lab sheet 1 1 - faraday
EENG 226 Lab sheet 1 1 - faraday
EENG 226 Lab sheet 1 1 - faraday
- No tags were found...

Create successful ePaper yourself
Turn your PDF publications into a flip-book with our unique Google optimized e-Paper software.
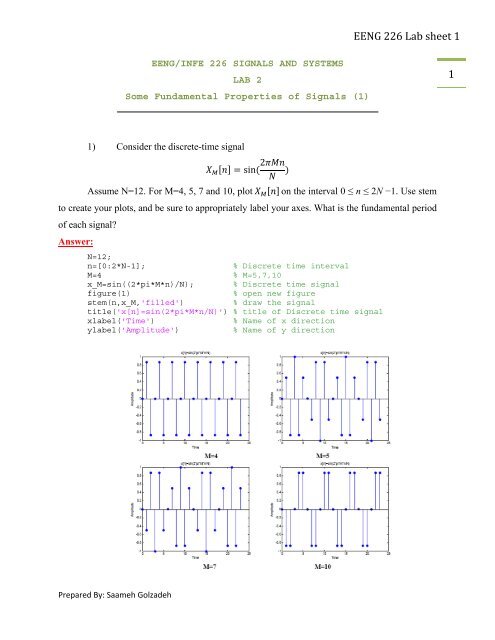
<strong>EENG</strong> <strong>226</strong> <strong>Lab</strong> <strong>sheet</strong> 1<strong>EENG</strong>/INFE <strong>226</strong> SIGNALS AND SYSTEMSLAB 2Some Fundamental Properties of Signals (1)11) Consider the discrete-time signal sin 2Assume N=12. For M=4, 5, 7 and 10, plot on the interval 0 ≤ n ≤ 2N −1. Use stemto create your plots, and be sure to appropriately label your axes. What is the fundamental periodof each signal?Answer:N=12;n=[0:2*N-1];% Discrete time intervalM=4 % M=5,7,10x_M=sin((2*pi*M*n)/N); % Discrete time signalfigure(1)% open new figurestem(n,x_M,'filled')% draw the signaltitle('x[n]=sin(2*pi*M*n/N)') % title of Discrete time signalxlabel('Time')% Name of x directionylabel('Amplitude')% Name of y directionPrepared By: Saameh Golzadeh
<strong>EENG</strong> <strong>226</strong> <strong>Lab</strong> <strong>sheet</strong> 12) Now consider the following signals:2 2 2 cos3 2 3 5 2 Assume N=6 for each signal. Determine whether or not each signal periodic. If a signal isperiodic, plot the signal for two periods, starting at n=0. Plot the signal for 0 ≤ n ≤ 7N andexplain why it is periodic or not. Remember to use stem and to appropriately label your axes.Answer:N=6;n=[0:7*N];x2=2*cos(2*n/N)+cos(3*n/N);x3=cos(2*pi*n/N)+3*sin(5*(pi/2)*n/N);subplot(2,1,1),stem(n,x2)title('x2[n]')subplot(2,1,2),stem(n,x3)title('x3[n]')3) a) Define a MATLAB vector nx to be the time indices − 3 ≤ n ≤ 7 and theMATLAB vector x to be the values of the signal x[n] is given by 2,……… 0 1 ,……… 21 , … … . . 3 3 ,……… 40 ,….If you have defined these vectors correctly, you should be able to plot this discrete time sequenceby typing stem(nx,x).Prepared By: Saameh Golzadeh
<strong>EENG</strong> <strong>226</strong> <strong>Lab</strong> <strong>sheet</strong> 1Answer:nx=[-3:7];x=[0 0 0 2 0 1 -1 3 0 0 0];stem(nx,x,'filled')title('x[n]')xlabel('n')ylabel('x[n]')3b) For this part, you will define MATLAB vectors y1 through y4 to represent the followingdiscrete-time signals: 2, 1, , 1,To do this, you should define y1 through y4 to be equal to x. The key is to define correctly thecorresponding index vectors ny1 through ny4. First, you should figure out how the index of agiven sample of x[n] changes when transforming to .The index vectors need not span thesame of indices as nx, but they should all be at least 11 samples long and include the indices ofall nonzero samples of associated signal.Answer:n=[-3:7];x=[2 0 1 -1 3 0];nx=[0 0 0 x 0 0];ny1=n+2;ny2=n-1;ny3=-n;ny4=-n+1;figure(1)subplot(2,1,1),stem(ny1,nx,'filled')xlabel('time')ylabel('x[n-2]')title('x[n-2]')subplot(2,1,2),stem(ny2,nx,'filled')xlabel('time')ylabel('x[n+1]')title('x[n+1]')figure(2)subplot(2,1,1),stem(ny3,nx,'filled')xlabel('time')ylabel('x[-n]')title('x[-n]')subplot(2,1,2),stem(ny4,nx,'filled')xlabel('time')ylabel('x[-n+1]')title('x[-n+1]')Prepared By: Saameh Golzadeh