Modelling an Air Traffic Control Environment Using Bayesian Belief ...
Modelling an Air Traffic Control Environment Using Bayesian Belief ...
Modelling an Air Traffic Control Environment Using Bayesian Belief ...

You also want an ePaper? Increase the reach of your titles
YUMPU automatically turns print PDFs into web optimized ePapers that Google loves.
controllers instruction). Similarly, a highly skilled pilot should be listening to the radio<br />
(situational awareness) so should respond quickly to <strong>an</strong>y actions (especially “avoiding action”<br />
issued), without delay. The node “SSE1&2” represents the actual number of SSE1s, SSE2s <strong>an</strong>d<br />
accidents remaining in the system. The Tactical <strong>Control</strong>ler’s endeavours at recovery have failed<br />
or they were non-existent.<br />
On occasions TCAS may give a nuis<strong>an</strong>ce alert <strong>an</strong>d therefore mislead a pilot. Pilots are trained to<br />
follow TCAS advice hence when TCAS gives a nuis<strong>an</strong>ce/false alert even a highly skilled pilot<br />
may follow it although being highly skilled, they are more likely to have good awareness of<br />
surrounding aircraft from radio etc. A highly skilled pilot may also add a turn to whatever advice<br />
is given by TCAS (which only separates vertically). A poor pilot may be slow to react or ignore<br />
the advice given by TCAS. The node above yields the actual number of SSE1s <strong>an</strong>d accidents<br />
remaining in the system. Recovery has been ineffective. Finally, to the far right of the network,<br />
the node “collisions per 15 minutes” yields that actual number of collisions/accidents in a fifteen<br />
minute interval for a single sector.<br />
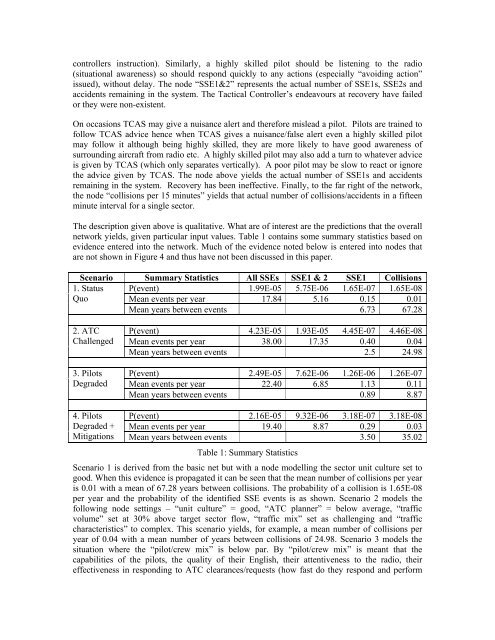
The description given above is qualitative. What are of interest are the predictions that the overall<br />
network yields, given particular input values. Table 1 contains some summary statistics based on<br />
evidence entered into the network. Much of the evidence noted below is entered into nodes that<br />
are not shown in Figure 4 <strong>an</strong>d thus have not been discussed in this paper.<br />
Scenario Summary Statistics All SSEs SSE1 & 2 SSE1 Collisions<br />
1. Status P(event) 1.99E-05 5.75E-06 1.65E-07 1.65E-08<br />
Quo Me<strong>an</strong> events per year 17.84 5.16 0.15 0.01<br />
Me<strong>an</strong> years between events 6.73 67.28<br />
2. ATC<br />
Challenged<br />
3. Pilots<br />
Degraded<br />
P(event) 4.23E-05 1.93E-05 4.45E-07 4.46E-08<br />
Me<strong>an</strong> events per year 38.00 17.35 0.40 0.04<br />
Me<strong>an</strong> years between events 2.5 24.98<br />
P(event) 2.49E-05 7.62E-06 1.26E-06 1.26E-07<br />
Me<strong>an</strong> events per year 22.40 6.85 1.13 0.11<br />
Me<strong>an</strong> years between events 0.89 8.87<br />
4. Pilots P(event) 2.16E-05 9.32E-06 3.18E-07 3.18E-08<br />
Degraded + Me<strong>an</strong> events per year 19.40 8.87 0.29 0.03<br />
Mitigations Me<strong>an</strong> years between events 3.50 35.02<br />
Table 1: Summary Statistics<br />
Scenario 1 is derived from the basic net but with a node modelling the sector unit culture set to<br />
good. When this evidence is propagated it c<strong>an</strong> be seen that the me<strong>an</strong> number of collisions per year<br />
is 0.01 with a me<strong>an</strong> of 67.28 years between collisions. The probability of a collision is 1.65E-08<br />
per year <strong>an</strong>d the probability of the identified SSE events is as shown. Scenario 2 models the<br />
following node settings – “unit culture” = good, “ATC pl<strong>an</strong>ner” = below average, “traffic<br />
volume” set at 30% above target sector flow, “traffic mix” set as challenging <strong>an</strong>d “traffic<br />
characteristics” to complex. This scenario yields, for example, a me<strong>an</strong> number of collisions per<br />
year of 0.04 with a me<strong>an</strong> number of years between collisions of 24.98. Scenario 3 models the<br />
situation where the “pilot/crew mix” is below par. By “pilot/crew mix” is me<strong>an</strong>t that the<br />
capabilities of the pilots, the quality of their English, their attentiveness to the radio, their<br />
effectiveness in responding to ATC clear<strong>an</strong>ces/requests (how fast do they respond <strong>an</strong>d perform