DEAP: A Database for Emotion Analysis using Physiological Signals
DEAP: A Database for Emotion Analysis using Physiological Signals
DEAP: A Database for Emotion Analysis using Physiological Signals

Create successful ePaper yourself
Turn your PDF publications into a flip-book with our unique Google optimized e-Paper software.
IEEE TRANS. AFFECTIVE COMPUTING 1<br />
<strong>DEAP</strong>: A <strong>Database</strong> <strong>for</strong> <strong>Emotion</strong> <strong>Analysis</strong> <strong>using</strong><br />
<strong>Physiological</strong> <strong>Signals</strong><br />
Sander Koelstra, Student Member, IEEE, Christian Mühl, Mohammad Soleymani, Student Member, IEEE,<br />
Jong-Seok Lee, Member, IEEE, Ashkan Yazdani, Touradj Ebrahimi, Member, IEEE,<br />
Thierry Pun, Member, IEEE, Anton Nijholt, Member, IEEE, Ioannis Patras, Member, IEEE<br />
Abstract—We present a multimodal dataset <strong>for</strong> the analysis of human affective states. The electroencephalogram (EEG) and<br />
peripheral physiological signals of 32 participants were recorded as each watched 40 one-minute long excerpts of music videos.<br />
Participants rated each video in terms of the levels of arousal, valence, like/dislike, dominance and familiarity. For 22 of the 32<br />
participants, frontal face video was also recorded. A novel method <strong>for</strong> stimuli selection is proposed <strong>using</strong> retrieval by affective tags<br />
from the last.fm website, video highlight detection and an online assessment tool. An extensive analysis of the participants’ ratings<br />
during the experiment is presented. Correlates between the EEG signal frequencies and the participants’ ratings are investigated.<br />
Methods and results are presented <strong>for</strong> single-trial classification of arousal, valence and like/dislike ratings <strong>using</strong> the modalities of EEG,<br />
peripheral physiological signals and multimedia content analysis. Finally, decision fusion of the classification results from the different<br />
modalities is per<strong>for</strong>med. The dataset is made publicly available and we encourage other researchers to use it <strong>for</strong> testing their own<br />
affective state estimation methods.<br />
Index Terms—<strong>Emotion</strong> classification, EEG, <strong>Physiological</strong> signals, Signal processing, Pattern classification, Affective computing.<br />
1 INTRODUCTION<br />
EMOTION is a psycho-physiological process triggered<br />
by conscious and/or unconscious perception of an<br />
object or situation and is often associated with mood,<br />
temperament, personality and disposition, and motivation.<br />
<strong>Emotion</strong>s play animportant role in human communication<br />
and can be expressed either verbally through<br />
emotional vocabulary, or by expressing non-verbal cues<br />
such as intonation of voice, facial expressions and gestures.<br />
Most of the contemporary human-computer interaction<br />
(HCI) systems are deficient in interpreting this<br />
in<strong>for</strong>mation and suffer from the lack of emotional intelligence.<br />
In other words, they areunable toidentify human<br />
emotional states and use this in<strong>for</strong>mation in deciding<br />
upon proper actions to execute. The goal of affective<br />
computing is to fill this gap by detecting emotional<br />
cues occurring during human-computer interaction and<br />
synthesizing emotional responses.<br />
Characterizing multimedia content with relevant, reliable<br />
and discriminating tags is vital <strong>for</strong> multimedia<br />
• The first three authors contributed equally to this work and are listed in<br />
alphabetical order.<br />
• Sander Koelstra and Ioannis Patras are with the School of Computer<br />
Science and Electronic Engineering, Queen Mary University of London<br />
(QMUL). E-mail: sander.koelstra@eecs.qmul.ac.uk<br />
• Christian Mühl and Anton Nijholt are with the Human Media Interaction<br />
Group, University of Twente (UT).<br />
• Mohammad Soleymani and Thierry Pun are with the Computer Vision<br />
and Multimedia Laboratory, University of Geneva (UniGé).<br />
• Ashkan Yazdani, Jong-Seok Lee and Touradj Ebrahimi are with the Multimedia<br />
Signal Processing Group, Ecole Polytechnique Fédérale de Lausanne<br />
(EPFL).<br />
✦<br />
in<strong>for</strong>mation retrieval. Affective characteristics of multimedia<br />
are important features <strong>for</strong> describing multimedia<br />
content and can be presented by such emotional<br />
tags. Implicit affective tagging refers to the ef<strong>for</strong>tless<br />
generation of subjective and/or emotional tags. Implicit<br />
tagging of videos <strong>using</strong> affective in<strong>for</strong>mation can help<br />
recommendation and retrieval systems to improve their<br />
per<strong>for</strong>mance[1]–[3].The currentdatasetis recordedwith<br />
the goal of creating an adaptive music video recommendation<br />
system. In our proposed music video recommendation<br />
system, a user’s bodily responses will be translatedtoemotions.<br />
Theemotions ofauserwhile watching<br />
music video clips will help the recommender system to<br />
first understand user’s taste and then to recommend a<br />
music clip which matches users current emotion.<br />
The presented database explores the possibility to<br />
classify emotion dimensions induced by showing music<br />
videos to different users. To the best of our knowledge,<br />
the responses to this stimuli (music video clips) have<br />
never been explored be<strong>for</strong>e, and the research in this<br />
field was mainly focused on images, music or non-music<br />
video segments [4], [5]. In an adaptive music video<br />
recommender, an emotion recognizer trained by physiological<br />
responses to the content from similar nature,<br />
music videos, is better able to fulfill its goal.<br />
Various discretecategorizationsof emotions havebeen<br />
proposed, such as the six basic emotions proposed by<br />
Ekman and Friesen[6] and the treestructure of emotions<br />
proposed by Parrot [7]. Dimensional scales of emotion<br />
have also been proposed, such as Plutchik’s emotion<br />
wheel [8] and the valence-arousal scale by Russell [9].<br />
In this work, we use Russell’s valence-arousal scale,
IEEE TRANS. AFFECTIVE COMPUTING 2<br />
widely used in research on affect, to quantitatively<br />
describe emotions. In this scale, each emotional state<br />
can be placed on a two-dimensional plane with arousal<br />
and valence as the horizontal and vertical axes. While<br />
arousal and valence explain most of the variation in<br />
emotional states, a third dimension of dominance can<br />
alsobeincludedinthemodel[9].Arousalcanrangefrom<br />
inactive (e.g. uninterested, bored) to active (e.g. alert,<br />
excited), whereas valence ranges from unpleasant (e.g.<br />
sad,stressed)to pleasant(e.g.happy,elated).Dominance<br />
ranges from a helpless and weak feeling (without control)<br />
to an empowered feeling (in control of everything).<br />
For self-assessment along these scales, we use the wellknown<br />
self-assessment manikins (SAM) [10].<br />
<strong>Emotion</strong> assessment is often carried out through analysis<br />
of users’ emotional expressions and/or physiological<br />
signals. <strong>Emotion</strong>al expressions refer to any observable<br />
verbal and non-verbal behavior that communicates<br />
emotion. So far, most of the studies on emotion assessment<br />
have focused on the analysis of facial expressions<br />
and speech to determine a person’s emotional<br />
state. <strong>Physiological</strong> signals are also known to include<br />
emotional in<strong>for</strong>mation that can be used <strong>for</strong> emotion<br />
assessment but they have received less attention. They<br />
comprisethesignalsoriginating fromthecentralnervous<br />
system (CNS) and the peripheral nervous system (PNS).<br />
Recent advances in emotion recognition have motivated<br />
the creation of novel databases containing<br />
emotional expressions in different modalities. These<br />
databases mostly cover speech, visual, or audiovisual<br />
data (e.g. [11]–[15]). The visual modality includes facial<br />
expressions and/or body gestures. The audio modality<br />
covers posed or genuine emotional speech in different<br />
languages. Many of the existing visual databasesinclude<br />
only posed or deliberately expressed emotions.<br />
Healey [16], [17] recorded one of the first affective<br />
physiological datasets.Sherecorded24participantsdriving<br />
around the Boston area and annotated the dataset<br />
by the drivers’ stress level. 17 Of the 24 participant<br />
responses arepublicly available 1 . Her recordingsinclude<br />
electrocardiogram (ECG), galvanic skin response (GSR)<br />
recorded from hands and feet, electromyogram (EMG)<br />
from the right trapezius muscle and respiration patterns.<br />
To the best of our knowledge, the only publicly available<br />
multi-modal emotional databases which includes<br />
both physiological responses and facial expressions are<br />
the enterface 2005 emotional database and MAHNOB<br />
HCI [4], [5]. The first one was recorded by Savran<br />
et al [5]. This database includes two sets. The first<br />
set has electroencephalogram (EEG), peripheral physiological<br />
signals, functional near infra-red spectroscopy<br />
(fNIRS) and facial videos from 5 male participants. The<br />
second dataset only has fNIRS and facial videos from 16<br />
participants of both genders. Both databases recorded<br />
spontaneous responses to emotional images from the<br />
international affective picture system (IAPS) [18]. An<br />
1. http://www.physionet.org/pn3/drivedb/<br />
extensive review of affective audiovisual databases can<br />
be found in [13], [19]. The MAHNOB HCI database [4]<br />
consists of two experiments. The responses including,<br />
EEG, physiological signals, eye gaze, audio and facial<br />
expressions of 30 people were recorded. The first experiment<br />
was watching 20 emotional video extracted from<br />
movies and online repositories. The second experiment<br />
was tag agreement experiment in which images and<br />
short videos with human actions were shown the participants<br />
first without a tag and then with a displayed tag.<br />
Thetagswereeithercorrectorincorrectandparticipants’<br />
agreement with the displayed tag was assessed.<br />
There has been a large number of published works<br />
in the domain of emotion recognition from physiological<br />
signals [16], [20]–[24]. Of these studies, only a few<br />
achieved notable results <strong>using</strong> video stimuli. Lisetti and<br />
Nasoz used physiological responses to recognize emotions<br />
in response to movie scenes [23]. The movie scenes<br />
were selected to elicit six emotions, namely sadness,<br />
amusement, fear, anger, frustration and surprise. They<br />
achieved a high recognition rate of 84% <strong>for</strong> the recognition<br />
of these six emotions. However, the classification<br />
was based on the analysis of the signals in response to<br />
pre-selected segments in the shown video known to be<br />
related to highly emotional events.<br />
Some ef<strong>for</strong>ts have been made towards implicit affective<br />
tagging of multimedia content. Kierkels et al. [25]<br />
proposed a method <strong>for</strong> personalized affective tagging<br />
of multimedia <strong>using</strong> peripheral physiological signals.<br />
Valence and arousal levels of participants’ emotions<br />
when watching videos were computed from physiological<br />
responses <strong>using</strong> linear regression [26]. Quantized<br />
arousal and valence levels <strong>for</strong> a clip were then mapped<br />
to emotion labels. This mapping enabled the retrieval of<br />
video clips based on keyword queries. So far this novel<br />
method achieved low precision.<br />
Yazdani et al. [27] proposed <strong>using</strong> a brain computer<br />
interface (BCI) based on P300 evoked potentials to emotionally<br />
tag videos with one of the six Ekman basic<br />
emotions [28]. Their system was trained with 8 participants<br />
and then tested on 4 others. They achieved a high<br />
accuracy on selecting tags. However, in their proposed<br />
system, a BCI only replaces the interface <strong>for</strong> explicit<br />
expression of emotional tags, i.e. the method does not<br />
implicitly tag a multimedia item <strong>using</strong> the participant’s<br />
behavioral and psycho-physiological responses.<br />
In addition to implicit tagging <strong>using</strong> behavioral<br />
cues, multiple studies used multimedia content analysis<br />
(MCA) <strong>for</strong> automated affective tagging of videos.<br />
Hanjalic et al. [29] introduced ”personalized content<br />
delivery” as a valuable tool in affective indexing and<br />
retrieval systems. In order to represent affect in video,<br />
they first selected video- and audio- content features<br />
based on their relation to the valence-arousal space.<br />
Then, arising emotions were estimated in this space by<br />
combining these features. While valence-arousal could<br />
be used separately <strong>for</strong> indexing, they combined these<br />
values by following their temporal pattern. This allowed
IEEE TRANS. AFFECTIVE COMPUTING 3<br />
<strong>for</strong> determining an affect curve, shown to be useful <strong>for</strong><br />
extracting video highlights in a movie or sports video.<br />
Wang and Cheong [30] used audio and video features<br />
to classify basic emotions elicited by movie scenes. Audio<br />
was classified into music, speech and environment<br />
signals and these were treated separately to shape an<br />
aural affective feature vector. The aural affective vector<br />
of each scene was fused with video-based features such<br />
as key lighting and visual excitement to <strong>for</strong>m a scene<br />
feature vector. Finally, <strong>using</strong> the scene feature vectors,<br />
movie scenes were classified and labeled with emotions.<br />
Soleymani et. al proposed a scene affective characterization<br />
<strong>using</strong> a Bayesian framework [31]. Arousal and<br />
valence of each shot were first determined <strong>using</strong> linear<br />
regression. Then, arousal and valence values in addition<br />
to content features of each scene were used to classify<br />
every scene into three classes, namely calm, excited positive<br />
and excited negative. The Bayesian framework was<br />
able to incorporate the movie genre and the predicted<br />
emotion from the last scene or temporal in<strong>for</strong>mation to<br />
improve the classification accuracy.<br />
There are also various studies on music affective characterization<br />
from acoustic features [32]–[34]. Rhythm,<br />
tempo, Mel-frequency cepstral coefficients (MFCC),<br />
pitch, zero crossing rate are amongst common features<br />
which have been used to characterize affect in music.<br />
A pilot study <strong>for</strong> the current work was presented in<br />
[35]. In that study, 6 participants’ EEG and physiological<br />
signals were recorded as each watched 20 music videos.<br />
The participants rated arousal and valence levels and<br />
the EEG and physiological signals <strong>for</strong> each video were<br />
classified into low/high arousal/valence classes.<br />
In the current work, music video clips are used as the<br />
visual stimuli to elicit different emotions. To this end,<br />
a relatively large set of music video clips was gathered<br />
<strong>using</strong> a novel stimuli selection method. A subjective test<br />
was then per<strong>for</strong>med to select the most appropriate test<br />
material. For each video, a one-minute highlight was<br />
selected automatically. 32 participants took part in the<br />
experiment and their EEG and peripheral physiological<br />
signals were recorded as they watched the 40 selected<br />
music videos. Participants rated each video in terms of<br />
arousal, valence,like/dislike, dominance and familiarity.<br />
For 22 participants, frontal face video was also recorded.<br />
This paper aims at introducing this publicly available 2<br />
database. The database contains all recorded signal data,<br />
frontal face video <strong>for</strong> a subset of the participants and<br />
subjective ratings from the participants. Also included<br />
is the subjective ratings from the initial online subjective<br />
annotation and the list of 120 videos used. Due to<br />
licensing issues, we are not able to include the actual<br />
videos, but YouTube links are included. Table 1 gives an<br />
overview of the database contents.<br />
To the best of our knowledge, this database has the<br />
highest number of participants in publicly available<br />
databases <strong>for</strong> analysis of spontaneous emotions from<br />
2. http://www.eecs.qmul.ac.uk/mmv/datasets/deap/<br />
Number of videos 120<br />
TABLE 1<br />
<strong>Database</strong> content summary<br />
Online subjective annotation<br />
Video duration 1 minute affective highlight (section 2.2)<br />
Selection method<br />
No. of ratings per video 14 - 16<br />
Rating scales<br />
60 via last.fm affective tags,<br />
60 manually selected<br />
Arousal<br />
Valence<br />
Dominance<br />
Rating values Discrete scale of 1 - 9<br />
Number of participants 32<br />
Number of videos 40<br />
<strong>Physiological</strong> Experiment<br />
Selection method Subset of online annotated videos with<br />
clearest responses (see section 2.3)<br />
Rating scales<br />
Rating values<br />
Recorded signals<br />
Arousal<br />
Valence<br />
Dominance<br />
Liking (how much do you like the video?)<br />
Familiarity (how well do you know the video?)<br />
Familiarity: discrete scale of 1 - 5<br />
Others: continuous scale of 1 - 9<br />
32-channel 512Hz EEG<br />
Peripheral physiological signals<br />
Face video (<strong>for</strong> 22 participants)<br />
physiological signals. In addition, it is the only database<br />
that uses music videos as emotional stimuli.<br />
We present an extensive statistical analysis of the<br />
participant’s ratings and of the correlates between the<br />
EEG signals and the ratings. Preliminary single trial<br />
classification results of EEG, peripheral physiological<br />
signals and MCA are presented and compared. Finally,<br />
a fusion algorithm is utilized to combine the results of<br />
each modality and arrive at a more robust decision.<br />
The layout of the paper is as follows. In Section 2<br />
the stimuli selection procedure is described in detail.<br />
The experiment setup is covered in Section 3. Section<br />
4 provides a statistical analysis of the ratings given by<br />
participants during the experiment and a validation of<br />
our stimuli selection method. In Section 5, correlates between<br />
the EEG frequencies and the participants’ ratings<br />
are presented. The method and results of single-trial<br />
classification are given in Section 6. The conclusion of<br />
this work follows in Section 7.<br />
2 STIMULI SELECTION<br />
The stimuli used in the experiment were selected in<br />
several steps. First, we selected 120 initial stimuli, half<br />
of which were chosen semi-automatically and the rest<br />
manually. Then, a one-minute highlight part was determined<br />
<strong>for</strong> each stimulus. Finally, through a web-based<br />
subjective assessment experiment, 40 final stimuli were<br />
selected. Each of these steps is explained below.
IEEE TRANS. AFFECTIVE COMPUTING 4<br />
2.1 Initial stimuli selection<br />
Eliciting emotional reactions from test participants is a<br />
difficult task and selecting the most effective stimulus<br />
materials is crucial. We propose here a semi-automated<br />
method <strong>for</strong> stimulus selection, with the goal of minimizing<br />
the bias arising from manual stimuli selection.<br />
60 of the 120 initially selected stimuli were selected<br />
<strong>using</strong> the Last.fm 3 music enthusiast website. Last.fm<br />
allows users to track their music listening habits and<br />
receive recommendations <strong>for</strong> new music and events.<br />
Additionally, it allows the users toassigntags to individual<br />
songs, thus creating a folksonomy of tags. Many of<br />
the tags carry emotional meanings, such as ’depressing’<br />
or ’aggressive’. Last.fm offers an API, allowing one to<br />
retrieve tags and tagged songs.<br />
A list of emotional keywords was taken from [7] and<br />
expanded to include inflections and synonyms, yielding<br />
304 keywords. Next, <strong>for</strong> each keyword, corresponding<br />
tags were found in the Last.fm database. For each found<br />
affective tag, the ten songs most often labeled with this<br />
tag were selected. This resulted in a total of 1084 songs.<br />
The valence-arousal space can be subdivided into 4<br />
quadrants,namelylowarousal/lowvalence(LALV),low<br />
arousal/high valence(LAHV),high arousal/low valence<br />
(HALV) and high arousal/high valence (HAHV). In<br />
order to ensure diversity of induced emotions, from the<br />
1084 songs, 15 were selected manually <strong>for</strong> each quadrant<br />
according to the following criteria:<br />
Does the tag accurately reflect the emotional content?<br />
Examples of songs subjectively rejected according to this<br />
criterium include songs that are tagged merely because<br />
the song title or artist name corresponds to the tag.<br />
Also, in some cases the lyrics may correspond to the tag,<br />
but the actual emotional content of the song is entirely<br />
different (e.g. happy songs about sad topics).<br />
Is a music video available <strong>for</strong> the song?<br />
Music videos <strong>for</strong> the songs were automatically retrieved<br />
from YouTube, corrected manually where necessary.<br />
However, many songs do not have a music video.<br />
Is the song appropriate <strong>for</strong> use in the experiment?<br />
Since our test participants were mostly European students,<br />
we selected those songs most likely to elicit<br />
emotions <strong>for</strong> this target demographic. There<strong>for</strong>e, mainly<br />
European or North American artists were selected.<br />
In addition to the songs selected <strong>using</strong> the method<br />
described above, 60 stimulus videos were selected manually,<br />
with 15 videos selected <strong>for</strong> each of the quadrants<br />
in the arousal/valence space. The goal here was to select<br />
those videosexpectedtoinducethe most clearemotional<br />
reactions <strong>for</strong> each of the quadrants. The combination<br />
of manual selection and selection <strong>using</strong> affective tags<br />
produced a list of 120 candidate stimulus videos.<br />
2.2 Detection of one-minute highlights<br />
For each of the 120 initially selected music videos, a one<br />
minute segment <strong>for</strong> use in the experiment was extracted.<br />
3. http://www.last.fm<br />
In order to extract a segment with maximum emotional<br />
content, an affective highlighting algorithm is proposed.<br />
Soleymani et al. [31] used a linear regression method<br />
to calculate arousal <strong>for</strong> each shot of in movies. In their<br />
method, the arousal and valence of shots was computed<br />
<strong>using</strong> a linear regression on the content-based features.<br />
In<strong>for</strong>mative features<strong>for</strong> arousal estimation include loudness<br />
andenergyof the audiosignals, motion component,<br />
visual excitement and shot duration. The same approach<br />
was used to compute valence. There are other content<br />
features such as color variance and key lighting that<br />
have been shown to be correlated with valence [30]. The<br />
detailed description of the content features used in this<br />
work is given in Section 6.2.<br />
In order to find the best weights <strong>for</strong> arousal and<br />
valence estimation <strong>using</strong> regression, the regressors were<br />
trained on all shots in 21annotated movies in the dataset<br />
presented in [31]. The linear weights were computed by<br />
means of a relevance vector machine (RVM) from the<br />
RVM toolbox provided by Tipping [36]. The RVM is able<br />
to reject unin<strong>for</strong>mative features during its training hence<br />
no further feature selection was used <strong>for</strong> arousal and<br />
valence determination.<br />
The music videos were then segmented into one<br />
minute segments with 55 seconds overlap between segments.<br />
Content featureswereextractedand providedthe<br />
input <strong>for</strong> the regressors. The emotional highlight score<br />
of the i-th segment ei was computed <strong>using</strong> the following<br />
equation:<br />
�<br />
ei = a2 i +v2 i (1)<br />
The arousal, ai, and valence, vi, were centered. There<strong>for</strong>e,<br />
a smaller emotional highlight score (ei) is closer<br />
to the neutral state. For each video, the one minute<br />
long segment with the highest emotional highlight score<br />
was chosen to be extracted <strong>for</strong> the experiment. For a<br />
few clips, the automatic affectivehighlight detectionwas<br />
manually overridden. This was done only <strong>for</strong> songs with<br />
segments that are particularly characteristic of the song,<br />
well-known to the public, and most likely to elicit emotional<br />
reactions. In these cases, the one-minute highlight<br />
was selected so that these segments were included.<br />
Given the 120 one-minute music video segments, the<br />
final selection of 40 videos used in the experiment was<br />
made on the basis of subjective ratings by volunteers, as<br />
described in the next section.<br />
2.3 Online subjective annotation<br />
From the initial collection of 120 stimulus videos, the<br />
final 40 test video clips were chosen by <strong>using</strong> a webbased<br />
subjective emotion assessment interface. Participantswatchedmusicvideosandratedthemonadiscrete<br />
9-point scale <strong>for</strong> valence, arousal and dominance. A<br />
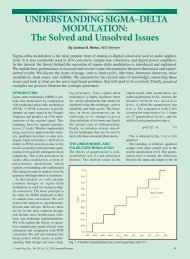
screenshot of the interface is shown in Fig. 1. Each<br />
participant watched as many videos as he/she wanted<br />
and was able to end the rating at any time. The order of
IEEE TRANS. AFFECTIVE COMPUTING 5<br />
Fig. 1. Screenshot of the web interface <strong>for</strong> subjective<br />
emotion assessment.<br />
the clips was randomized, but preference was given to<br />
the clips rated by the least number of participants. This<br />
ensured a similar number of ratings <strong>for</strong> each video (14-<br />
16 assessments per video were collected). It was ensured<br />
that participants never saw the same video twice.<br />
After all of the 120 videos were rated by at least<br />
14 volunteers each, the final 40 videos <strong>for</strong> use in the<br />
experiment were selected. To maximize the strength of<br />
elicited emotions, we selected those videos that had the<br />
strongest volunteer ratings and at the same time a small<br />
variation. To this end, <strong>for</strong> each video x we calculated<br />
a normalized arousal and valence score by taking the<br />
mean rating divided by the standard deviation (µx/σx).<br />
Then, <strong>for</strong> each quadrant in the normalized valencearousal<br />
space, we selected the 10 videos that lie closest<br />
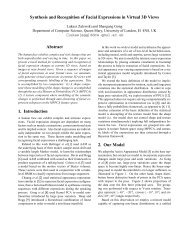
to the extreme corner of the quadrant. Fig. 2 shows<br />
the score <strong>for</strong> the ratings of each video and the selected<br />
videos highlighted in green. The video whose rating<br />
was closest to the extreme corner of each quadrant is<br />
mentioned explicitly. Of the 40 selected videos, 17 were<br />
selected via Last.fm affective tags, indicating that useful<br />
stimuli can be selected via this method.<br />
3 EXPERIMENT SETUP<br />
3.1 Materials and Setup<br />
The experiments were per<strong>for</strong>med in two laboratory<br />
environments with controlled illumination. EEG and<br />
peripheral physiological signals were recorded <strong>using</strong> a<br />
Biosemi ActiveTwosystem 4 on a dedicatedrecordingPC<br />
(Pentium 4, 3.2 GHz). Stimuli were presented <strong>using</strong> a<br />
dedicated stimulus PC (Pentium 4, 3.2 GHz) that sent<br />
4. http://www.biosemi.com<br />
Valence score<br />
2<br />
1.5<br />
1<br />
0.5<br />
0<br />
−0.5<br />
−1<br />
−1.5<br />
Sia<br />
Breathe me<br />
−2<br />
−2<br />
Louis Armstrong<br />
What a wonderful world<br />
Blur<br />
Song 2<br />
Napalm death<br />
Procrastination on the<br />
empty vessel<br />
−1.5 −1 −0.5 0 0.5 1 1.5 2<br />
Arousal score<br />
Fig. 2. µx/σx value <strong>for</strong> the ratings of each video in<br />
the online assessment. Videos selected <strong>for</strong> use in the<br />
experiment are highlighted in green. For each quadrant,<br />
the most extreme video is detailed with the song title and<br />
a screenshot from the video.<br />
synchronization markers directly to the recording PC.<br />
For presentation of the stimuli and recording the users’<br />
ratings, the ”Presentation” software by Neurobehavioral<br />
systems 5 was used. The music videos were presented<br />
on a 17-inch screen (1280 × 1024, 60 Hz) and in order<br />
to minimize eye movements, all video stimuli were<br />
displayed at 800× 600 resolution, filling approximately<br />
2/3 of the screen. Subjects were seated approximately<br />
1 meter from the screen. Stereo Philips speakers were<br />
used and the music volume was set at a relatively loud<br />
level, however each participant was asked be<strong>for</strong>e the<br />
experiment whether the volume was com<strong>for</strong>table and it<br />
was adjusted when necessary.<br />
EEG was recorded at a sampling rate of 512 Hz <strong>using</strong><br />
32 active AgCl electrodes (placed according to the international<br />
10-20system). Thirteenperipheral physiological<br />
signals (which will be further discussed in section 6.1)<br />
were also recorded. Additionally, <strong>for</strong> the first 22 of the<br />
32 participants, frontal face video was recorded in DV<br />
quality <strong>using</strong> a Sony DCR-HC27E consumer-grade camcorder.Thefacevideowasnotusedintheexperimentsin<br />
this paper, but is made publicly available along with the<br />
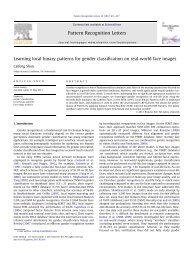
rest of the data. Fig. 3 illustrates the electrode placement<br />
<strong>for</strong> acquisition of peripheral physiological signals.<br />
3.2 Experiment protocol<br />
32 Healthy participants (50% female), aged between 19<br />
and 37 (mean age 26.9), participated in the experiment.<br />
Prior to the experiment, each participant signed a consent<br />
<strong>for</strong>m and filled out a questionnaire. Next, they were<br />
given a set of instructions to read in<strong>for</strong>ming them of the<br />
experiment protocol and the meaning of the different<br />
scales used <strong>for</strong> self-assessment. An experimenter was<br />
also present there to answer any questions. When the<br />
5. http://www.neurobs.com
IEEE TRANS. AFFECTIVE COMPUTING 6<br />
EXG sensors face<br />
2<br />
3<br />
4<br />
1<br />
6<br />
~1cm<br />
5<br />
~1cm<br />
EXG sensors trapezius,<br />
respiration belt and EEG<br />
7<br />
8 ~1cm<br />
32 EEG electrodes<br />
10-20 system<br />
Respiration belt<br />
Left hand<br />
physiological sensors<br />
Pleth.<br />
GSR1<br />
GSR2<br />
Fig. 3. Placement of peripheral physiological sensors.<br />
For Electrodes were used to record EOG and 4 <strong>for</strong> EMG<br />
(zygomaticus major and trapezius muscles). In addition,<br />
GSR, blood volume pressure (BVP), temperature and<br />
respiration were measured.<br />
instructions were cleartothe participant,he/she was led<br />
into the experiment room. After the sensors were placed<br />
and their signals checked, the participants per<strong>for</strong>med a<br />
practice trial to familiarize themselves with the system.<br />
In this unrecorded trial, a short video was shown, followed<br />
by a self-assessment by the participant. Next, the<br />
experimenter started the physiological signals recording<br />
and left the room, after which the participant started the<br />
experiment by pressing a key on the keyboard.<br />
The experiment started with a 2 minute baseline<br />
recording, during which a fixation cross was displayed<br />
to the participant (who was asked to relax during this<br />
period). Then the 40 videos were presented in 40 trials,<br />
each consisting of the following steps:<br />
1) A 2 second screendisplaying the current trial number<br />
to in<strong>for</strong>m the participants of their progress.<br />
2) A 5 second baseline recording (fixation cross).<br />
3) The 1 minute display of the music video.<br />
4) Self-assessment <strong>for</strong> arousal, valence, liking and<br />
dominance.<br />
After20trials,theparticipantstook ashortbreak.During<br />
the break, they were offered some cookies and noncaffeinated,<br />
non-alcoholic beverages. The experimenter<br />
then checkedthe quality of the signals and theelectrodes<br />
placement and the participants were asked to continue<br />
the second half of the test. Fig. 4 shows a participant<br />
shortly be<strong>for</strong>e the start of the experiment.<br />
3.3 Participant self-assessment<br />
At the end of each trial, participants per<strong>for</strong>med a selfassessment<br />
of their levels of arousal, valence, liking and<br />
dominance. Self-assessment manikins (SAM) [37] were<br />
used to visualize the scales (see Fig. 5). For the liking<br />
scale, thumbs down/thumbs up symbols were used.The<br />
manikins were displayed in the middle of the screen<br />
with the numbers 1-9 printed below. Participants moved<br />
the mouse strictly horizontally just below the numbers<br />
and clicked to indicate their self-assessment level.<br />
Temp.<br />
Fig. 4. A participant shortly be<strong>for</strong>e the experiment.<br />
Fig. 5. Images used <strong>for</strong> self-assessment. from top: Valence<br />
SAM, Arousal SAM, Dominance SAM, Liking.<br />
Participants were in<strong>for</strong>med they could click anywhere<br />
directly below or in-between the numbers, making the<br />
self-assessment a continuous scale.<br />
The valence scale ranges from unhappy or sad to<br />
happy or joyful. The arousal scale ranges from calm<br />
or bored to stimulated or excited. The dominance scale<br />
ranges from submissive (or ”without control”) to dominant<br />
(or ”in control, empowered”). A fourth scale asks<br />
<strong>for</strong> participants’ personal liking of the video. This last<br />
scale should not be confused with the valence scale. This<br />
measure inquires about the participants’ tastes, not their<br />
feelings. For example, it is possible to like videos that<br />
make one feel sad or angry. Finally, after the experiment,<br />
participantswereaskedtoratetheirfamiliaritywitheach<br />
of the songs on a scale of 1 (”Never heard it be<strong>for</strong>e the<br />
experiment”) to 5 (”Knew the song very well”).
IEEE TRANS. AFFECTIVE COMPUTING 7<br />
4 ANALYSIS OF SUBJECTIVE RATINGS<br />
In this section we describe the effect the affective stimulation<br />
had on the subjective ratings obtained from the<br />
participants. Firstly, we will provide descriptive statistics<br />
<strong>for</strong> the recorded ratings of liking, valence, arousal,<br />
dominance, andfamiliarity.Secondly,we will discuss the<br />
covariation of the different ratings with each other.<br />
Stimuli were selected to induce emotions in the four<br />
quadrants of the valence-arousal space (LALV, HALV,<br />
LAHV,HAHV).Thestimuli fromthese fouraffectelicitation<br />
conditions generally resulted in the elicitation of the<br />
targetemotion aimed <strong>for</strong> whenthe stimuli wereselected,<br />
ensuring that large parts of the arousal-valence plane<br />
(AVplane)arecovered(seeFig. 6).Wilcoxon signed-rank<br />
tests showed that low and high arousal stimuli induced<br />
different valence ratings (p < .0001 and p < .00001).Similarly,<br />
low and high valenced stimuli induced different<br />
arousal ratings (p < .001 and p < .0001).<br />
Valence<br />
8<br />
7<br />
6<br />
5<br />
4<br />
Stimulus locations, dominance, and liking in Arousal−Valence space<br />
LAHV HAHV<br />
LALV HALV<br />
3 LALV<br />
LAHV<br />
HALV<br />
HAHV<br />
2<br />
2 3 4 5<br />
Arousal<br />
6 7 8<br />
Fig. 6. The mean locations of the stimuli on the arousalvalence<br />
plane <strong>for</strong> the 4 conditions (LALV, HALV, LAHV,<br />
HAHV). Liking is encoded by color: dark red is low liking<br />
and bright yellow is high liking. Dominance is encoded by<br />
symbol size: small symbols stand <strong>for</strong> low dominance and<br />
big <strong>for</strong> high dominance.<br />
The emotion elicitation worked specifically well <strong>for</strong><br />
the high aro<strong>using</strong> conditions, yielding relative extreme<br />
valence ratings <strong>for</strong> the respective stimuli. The stimuli<br />
in the low aro<strong>using</strong> conditions were less successful in<br />
the elicitation of strong valence responses. Furthermore,<br />
some stimuli of the LAHV condition induced higher<br />
arousal than expected on the basis of the online study.<br />
Interestingly, this results in a C-shape of the stimuli<br />
on the valence-arousal plane also observed in the wellvalidated<br />
ratings <strong>for</strong> the international affective picture<br />
system (IAPS) [18] and the international affective digital<br />
sounds system (IADS) [38], indicating the general<br />
difficulty to induce emotions with strong valence but<br />
low arousal. The distribution of the individual ratings<br />
per conditions (see Fig. 7) shows a large variance<br />
within conditions, resulting from between-stimulus and<br />
-participantvariations, possibly associatedwithstimulus<br />
characteristics or inter-individual differences in music<br />
taste,generalmood,orscaleinterpretation.However,the<br />
significant differencesbetweenthe conditions interms of<br />
the ratings of valence and arousal reflect the successful<br />
elicitation of the targeted affective states (see Table 2).<br />
TABLE 2<br />
The mean values (and standard deviations) of the<br />
different ratings of liking (1-9), valence (1-9), arousal<br />
(1-9), dominance (1-9), familiarity (1-5) <strong>for</strong> each affect<br />
elicitation condition.<br />
Cond. Liking Valence Arousal Dom. Fam.<br />
LALV 5.7 (1.0) 4.2 (0.9) 4.3 (1.1) 4.5 (1.4) 2.4 (0.4)<br />
HALV 3.6 (1.3) 3.7 (1.0) 5.7 (1.5) 5.0 (1.6) 1.4 (0.6)<br />
LAHV 6.4 (0.9) 6.6 (0.8) 4.7 (1.0) 5.7 (1.3) 2.4 (0.4)<br />
HAHV 6.4 (0.9) 6.6 (0.6) 5.9 (0.9) 6.3 (1.0) 3.1 (0.4)<br />
The distribution of ratings <strong>for</strong> the different scales and<br />
conditions suggests a complex relationship between ratings.<br />
We explored the mean inter-correlation of the differentscalesoverparticipants(seeTable3),astheymight<br />
be indicative of possible confounds or unwanted effects<br />
of habituation or fatigue. We observed high positive<br />
correlations between liking and valence, and between<br />
dominance and valence. Seemingly, without implying<br />
anycausality,peoplelikedmusicwhichgavethemapositive<br />
feeling and/or a feeling of empowerment. Medium<br />
positive correlations were observed between arousal and<br />
dominance, and between arousal and liking. Familiarity<br />
correlated moderately positive with liking and valence.<br />
As already observed above, the scales of valence and<br />
arousal are not independent, but their positive correlation<br />
is rather low, suggesting that participants were able<br />
to differentiate between these two important concepts.<br />
Stimulus order had only a small effect on liking and<br />
dominance ratings, and no significant relationship with<br />
the other ratings, suggesting that effects of habituation<br />
and fatigue were kept to an acceptable minimum.<br />
In summary, the affect elicitation was in general successful,<br />
though the low valence conditions were partially<br />
biased by moderate valence responses and higher<br />
arousal. High scale inter-correlations observed are limited<br />
to the scale of valence with those of liking and<br />
dominance, and might be expected in the context of<br />
musical emotions. The rest of the scale inter-correlations<br />
aresmall or mediuminstrength, indicating that the scale<br />
concepts were well distinguished by the participants.<br />
5 CORRELATES OF EEG AND RATINGS<br />
For the investigation of the correlates of the subjective<br />
ratings with the EEG signals, the EEG data was common
IEEE TRANS. AFFECTIVE COMPUTING 8<br />
Self assessment<br />
8<br />
6<br />
4<br />
2<br />
Rating distributions <strong>for</strong> the emotion induction conditions<br />
L V A D F L V A D F L V A D F L V A D F<br />
LALV HALV<br />
LAHV<br />
HAHV<br />
Scales by condition<br />
Fig. 7. The distribution of the participants’ subjective ratings per scale (L - general rating, V - valence, A - arousal, D -<br />
dominance, F - familiarity) <strong>for</strong> the 4 affect elicitation conditions (LALV, HALV, LAHV, HAHV).<br />
TABLE 4<br />
The electrodes <strong>for</strong> which the correlations with the scale were significant (*=p < .01, **=p < .001). Also shown is the<br />
mean of the subject-wise correlations ( ¯ R), the most negative (R − ), and the most positive correlation (R + ).<br />
Theta Alpha Beta Gamma<br />
Elec. ¯R R − R + Elec. ¯R R − R + Elec. ¯R R − R + Elec. ¯R R − R +<br />
Arousal CP6* -0.06 -0.47 0.25 Cz* -0.07 -0.45 0.23 FC2* -0.06 -0.40 0.28<br />
Valence<br />
Liking<br />
Oz** 0.08 -0.23 0.39 PO4* 0.05 -0.26 0.49 CP1** -0.07 -0.49 0.24 T7** 0.07 -0.33 0.51<br />
PO4* 0.05 -0.26 0.49 Oz* 0.05 -0.24 0.48 CP6* 0.06 -0.26 0.43<br />
FC6* 0.06 -0.52 0.49 CP2* 0.08 -0.21 0.49<br />
Cz* -0.04 -0.64 0.30 C4** 0.08 -0.31 0.51<br />
T8** 0.08 -0.26 0.50<br />
FC6** 0.10 -0.29 0.52<br />
F8* 0.06 -0.35 0.52<br />
C3* 0.08 -0.35 0.31 AF3* 0.06 -0.27 0.42 FC6* 0.07 -0.40 0.48 T8* 0.04 -0.33 0.49<br />
F3* 0.06 -0.42 0.45<br />
TABLE 3<br />
The means of the subject-wise inter-correlations between<br />
the scales of valence, arousal, liking, dominance,<br />
familiarity and the order of the presentation (i.e. time) <strong>for</strong><br />
all 40 stimuli. Significant correlations (p < .05) according<br />
to Fisher’s method are indicated by stars.<br />
Scale Liking Valence Arousal Dom. Fam. Order<br />
Liking 1 0.62* 0.29* 0.31* 0.30* 0.03*<br />
Valence 1 0.18* 0.51* 0.25* 0.02<br />
Arousal 1 0.28* 0.06* 0.00<br />
Dom. 1 0.09* 0.04*<br />
Fam. 1 -<br />
Order 1<br />
average referenced, down-sampled to 256 Hz, and highpass<br />
filtered with a 2 Hz cutoff-frequency <strong>using</strong> the<br />
EEGlab 6 toolbox. We removed eye artefacts with a blind<br />
source separation technique 7 . Then, the signals from<br />
the last 30 seconds of each trial (video) were extracted<br />
<strong>for</strong> further analysis. To correct <strong>for</strong> stimulus-unrelated<br />
variations in power over time, the EEG signal from the<br />
6. http://sccn.ucsd.edu/eeglab/<br />
7. http://www.cs.tut.fi/ ∼gomezher/projects/eeg/aar.htm<br />
five seconds be<strong>for</strong>e each video was extractedas baseline.<br />
The frequency power of trials and baselines between<br />
3 and 47 Hz was extracted with Welch’s method with<br />
windows of 256 samples. The baseline power was then<br />
subtracted from the trial power, yielding the change of<br />
power relativeto the pre-stimulus period. These changes<br />
of power were averaged over the frequency bands of<br />
theta (3 - 7 Hz), alpha (8 - 13 Hz), beta (14 - 29 Hz),<br />
and gamma (30 - 47 Hz). For the correlation statistic,<br />
we computed the Spearman correlated coefficients between<br />
the power changes and the subjective ratings, and<br />
computed the p-values <strong>for</strong> the left- (positive) and righttailed<br />
(negative) correlation tests. This was done <strong>for</strong><br />
each participant separately and, assuming independence<br />
[39], the 32 resulting p-values per correlation direction<br />
(positive/negative), frequency band and electrode were<br />
then combined to one p-value via Fisher’s method [40].<br />
Fig. 8 shows the (average) correlations with significantly<br />
(p < .05) correlating electrodes highlighted. Below<br />
we will report and discuss only those effects that were<br />
significant with p < .01. A comprehensive list of the<br />
effects can be found in Table 4.<br />
For arousal we found negative correlations in the<br />
theta, alpha, and gamma band. The central alpha power<br />
decrease <strong>for</strong> higher arousal matches the findings from
IEEE TRANS. AFFECTIVE COMPUTING 9<br />
Arousal<br />
Valence<br />
Liking<br />
4-7 Hz 8-13 Hz<br />
14-29 Hz 30-47 Hz<br />
Fig. 8. The mean correlations (over all participants) of the valence, arousal, and general ratings with the power in the<br />
broad frequency bands of theta (4-7 Hz), alpha (8-13 Hz), beta (14-29 Hz) and gamma (30-47 Hz). The highlighted<br />
sensors correlate significantly (p < .05) with the ratings.<br />
our earlier pilot study [35] and an inverse relationship<br />
between alpha power and the general level of arousal<br />
has been reported be<strong>for</strong>e [41], [42].<br />
Valence showed the strongest correlations with EEG<br />
signals and correlates were found in all analysed frequency<br />
bands. In the low frequencies, theta and alpha,<br />
an increase of valence led to an increase of power. This<br />
is consistent with the findings in the pilot study. The<br />
location of these effects over occipital regions, thus over<br />
visual cortices, might indicate a relative deactivation,<br />
or top-down inhibition, of these due to participants<br />
foc<strong>using</strong> on the pleasurable sound [43]. For the beta<br />
frequency band we found a central decrease, also observed<br />
in the pilot, and an occipital and right temporal<br />
increase of power. Increased beta power over right temporal<br />
sites was associated with positive emotional selfinduction<br />
andexternalstimulation by [44].Similarly,[45]<br />
has reported a positive correlation of valence and highfrequency<br />
power, including beta and gamma bands, emanating<br />
from anterior temporal cerebral sources. Correspondingly,<br />
we observed a highly significant increase of<br />
left and especially right temporal gamma power. However,<br />
it should be mentioned that EMG (muscle) activity<br />
is also prominent in the high frequencies, especially over<br />
anterior and temporal electrodes [46].<br />
The liking correlates were found in all analysed fre-<br />
quency bands. For theta and alpha power we observed<br />
increases over left fronto-central cortices. Liking might<br />
be associated with an approach motivation. However,<br />
the observation of an increase of left alpha power <strong>for</strong><br />
a higher liking conflicts with findings of a left frontal<br />
activation, leading to lower alpha over this region, often<br />
reported <strong>for</strong> emotions associated with approach motivations<br />
[47]. This contradiction might be reconciled when<br />
taking into account that it is well possible that some<br />
disliked pieces induced an angry feeling (due to having<br />
to listen to them, or simply due to the content of the<br />
lyrics), which is also related to an approach motivation,<br />
and might hence result in a left-ward decrease of alpha.<br />
The right temporal increases found in the beta and<br />
gamma bands are similar to those observed <strong>for</strong> valence,<br />
and the same caution should be applied. In general the<br />
distribution of valence and liking correlations shown in<br />
Fig. 8 seem very similar, which might be a result of the<br />
high inter-correlations of the scales discussed above.<br />
Summarising, we can state that the correlations observed<br />
partially concur with observations made in the<br />
pilot study and in other studies exploring the neurophysiological<br />
correlates of affective states. They might<br />
there<strong>for</strong>e be taken as valid indicators of emotional states<br />
in the context of multi-modal musical stimulation. However,<br />
the mean correlations are seldom bigger than ±0.1,
IEEE TRANS. AFFECTIVE COMPUTING 10<br />
which might be due to high inter-participant variability<br />
in terms of brain activations, as individual correlations<br />
between ±0.5 were observed <strong>for</strong> a given scale correlation<br />
at the same electrode/frequency combination. The<br />
presence of this high inter-participant variability justifies<br />
a participant-specific classification approach, as we employ<br />
it, rather than a single classifier <strong>for</strong> all participants.<br />
6 SINGLE TRIAL CLASSIFICATION<br />
In this section we present the methodology and results<br />
of single-trial classification of the videos. Three<br />
different modalities were used <strong>for</strong> classification, namely<br />
EEG signals, peripheral physiological signals and MCA.<br />
Conditions <strong>for</strong> all modalities were kept equal and only<br />
the feature extraction step varies.<br />
Three different binary classification problems were<br />
posed: the classification of low/high arousal, low/high<br />
valence and low/high liking. To this end, the participants’<br />
ratings during the experiment are used as the<br />
ground truth. The ratings <strong>for</strong> each of these scales are<br />
thresholded into two classes (low and high). On the 9point<br />
rating scales, the threshold was simply placed in<br />
the middle. Note that <strong>for</strong> some subjects and scales, this<br />
leads to unbalanced classes. To give an indication of<br />
how unbalanced the classes are, the mean and standard<br />
deviation (over participants) of the percentage of videos<br />
belonging to the high class per rating scale are: arousal<br />
59%(15%), valence 57%(9%) and liking 67%(12%).<br />
In light of this issue, in order to reliably report results,<br />
we report the F1-score, which is commonly employed<br />
in in<strong>for</strong>mation retrieval and takes the class balance<br />
into account, contrary to the mere classification rate.<br />
In addition, we use a naïve Bayes classifier, a simple<br />
and generalizable classifier which is able to deal with<br />
unbalanced classes in small training sets.<br />
First, the features <strong>for</strong> the given modality are extracted<br />
<strong>for</strong> each trial (video). Then, <strong>for</strong> each participant, the<br />
F1 measure was used to evaluate the per<strong>for</strong>mance of<br />
emotion classification in a leave-one-out cross validation<br />
scheme. At each step of the cross validation, one video<br />
was used as the test-set and the rest were used as<br />
training-set. We use Fisher’s linear discriminant J <strong>for</strong><br />
feature selection:<br />
J(f) = |µ1 −µ2|<br />
σ2 1 +σ2 (2)<br />
2<br />
where µ and σ are the mean and standard deviation<br />
<strong>for</strong> feature f. We calculate this criterion <strong>for</strong> each feature<br />
and then apply a threshold to select the maximally<br />
discriminating ones. This threshold was empirically determined<br />
at 0.3.<br />
A Gaussian naïve Bayes classifier was used to classify<br />
the test-set as low/high arousal, valence or liking.<br />
The naïve Bayes classifier G assumes independence of<br />
the features and is given by:<br />
n�<br />
G(f1,..,fn) = argmaxp(C<br />
= c) p(Fi = fi|C = c) (3)<br />
c<br />
i=1<br />
where F is the set of features and C the classes.<br />
p(Fi = fi|C = c) is estimated by assuming Gaussian<br />
distributions of the features and modeling these from<br />
the training set.<br />
The following section explains the feature extraction<br />
steps <strong>for</strong> the EEG and peripheral physiological signals.<br />
Section 6.2 presents the features used in MCA classification.<br />
In section 6.3 we explain the method used <strong>for</strong><br />
decision fusion of the results. Finally, section 6.4 presents<br />
the classification results.<br />
6.1 EEG and peripheral physiological features<br />
Most of the current theories of emotion [48], [49] agree<br />
that physiological activity is an important component of<br />
an emotion. For instance several studies have demonstrated<br />
the existence of specific physiological patterns<br />
associated with basic emotions [6].<br />
The following peripheral nervous system signals were<br />
recorded: GSR, respiration amplitude, skin temperature,<br />
electrocardiogram, blood volume by plethysmograph,<br />
electromyograms of Zygomaticus and Trapezius muscles,<br />
and electrooculogram (EOG). GSR provides a measure<br />
of the resistance of the skin by positioning two electrodes<br />
on the distal phalanges of the middle and index<br />
fingers. This resistance decreases due to an increase of<br />
perspiration, which usually occurs when one is experiencing<br />
emotions such as stress or surprise. Moreover,<br />
Lang et al. discovered that the mean value of the GSR<br />
is related to the level of arousal [20].<br />
A plethysmograph measures blood volume in the<br />
participant’s thumb. This measurement can also be used<br />
to compute the heart rate (HR) by identification of local<br />
maxima (i.e. heart beats), inter-beat periods, and heart<br />
ratevariability (HRV). Blood pressureandHRV correlate<br />
with emotions, since stress can increase blood pressure.<br />
Pleasantness of stimuli can increase peak heart rate<br />
response [20]. In addition to the HR and HRV features,<br />
spectral features derived from HRV were shown to be a<br />
useful feature in emotion assessment [50].<br />
Skin temperature and respiration were recorded since<br />
they varies with different emotional states. Slow respiration<br />
is linked to relaxation while irregular rhythm, quick<br />
variations, and cessation of respiration correspond to<br />
more aroused emotions like anger or fear.<br />
Regarding the EMG signals, the Trapezius muscle<br />
(neck) activity was recorded to investigate possible head<br />
movements during music listening. The activity of the<br />
Zygomaticus major was also monitored, since this muscle<br />
is activated when the participant laughs or smiles.<br />
Most of the power in the spectrum of an EMG during<br />
musclecontractionisinthefrequencyrangebetween4to<br />
40 Hz. Thus, the muscle activity features were obtained<br />
from the energy of EMG signals in this frequency range<br />
<strong>for</strong> the different muscles. The rate of eye blinking is<br />
another feature, which is correlated with anxiety. Eyeblinking<br />
affects the EOG signal and results in easily<br />
detectable peaks in that signal. For further reading on<br />
psychophysiology ofemotion, wereferthereaderto[51].
IEEE TRANS. AFFECTIVE COMPUTING 11<br />
TABLE 5<br />
Features extracted from EEG and physiological signals.<br />
Signal Extracted features<br />
GSR average skin resistance, average of derivative, average<br />
of derivative <strong>for</strong> negative values only (average decrease<br />
rate during decay time), proportion of negative samples<br />
inthederivativevs.allsamples,numberoflocal minima<br />
in the GSR signal, average rising time of the GSR<br />
signal, 10 spectral power in the [0-2.4]Hz bands, zero<br />
crossing rate of Skin conductance slow response (SCSR)<br />
[0-0.2]Hz, zero crossing rate of Skin conductance very<br />
slow response (SCVSR) [0-0.08]Hz, SCSR and SCVSR<br />
mean of peaks magnitude<br />
Blood<br />
volume<br />
pressure<br />
Respiration<br />
pattern<br />
Skin temperature<br />
EMG and<br />
EOG<br />
Average and standard deviation of HR, HRV, and inter<br />
beatintervals,energyratiobetweenthefrequencybands<br />
[0.04-0.15]Hz and [0.15-0.5]Hz, spectral power in the<br />
bands ([0.1-0.2]Hz, [0.2-0.3]Hz, [0.3-0.4]Hz), low frequency<br />
[0.01-0.08]Hz, medium frequency [0.08-0.15]Hz<br />
and high frequency [0.15-0.5]Hz components of HRV<br />
power spectrum.<br />
band energy ratio (difference between the logarithm of<br />
energy between the lower (0.05-0.25Hz) and the higher<br />
(0.25-5Hz) bands), average respiration signal, mean of<br />
derivative (variation of the respiration signal), standard<br />
deviation, range or greatest breath, breathing rhythm<br />
(spectral centroid), breathing rate, 10 spectral power in<br />
the bands from 0 to 2.4Hz, average peak to peak time,<br />
median peak to peak time<br />
average, average of its derivative, spectral power in the<br />
bands ([0-0.1]Hz, [0.1-0.2]Hz)<br />
eye blinking rate, energy of the signal, mean and variance<br />
of the signal<br />
EEG theta, slow alpha, alpha, beta, and gamma Spectral<br />
power <strong>for</strong> each electrode. The spectral power asymmetry<br />
between 14 pairs of electrodes in the four bands of<br />
alpha, beta, theta and gamma.<br />
All the physiological responses were recorded at a<br />
512Hz sampling rate and later down-sampled to 256Hz<br />
toreduceprcoessingtime.ThetrendoftheECGandGSR<br />
signals was removed by subtracting the temporal low<br />
frequency drift. The low frequency drift was computed<br />
bysmoothing thesignals oneachECGandGSRchannels<br />
with a 256 points moving average.<br />
In total 106 features were extracted from peripheral<br />
physiological responses based on the proposed features<br />
in the literature [22], [26], [52]–[54] (see also Table 5).<br />
From the EEG signals, power spectral features were<br />
extracted. The logarithms of the spectral power from<br />
theta(4-8Hz),slowalpha(8-10Hz),alpha(8-12Hz),beta<br />
(12-30Hz) and gamma (30+ Hz) bands were extracted<br />
from all 32 electrodes as features. In addition to power<br />
spectral features the difference between the spectral<br />
power of all the symmetrical pairs of electrodes on<br />
the right and left hemisphere was extracted to measure<br />
the possible asymmetry in the brain activities due to<br />
emotional stimuli. The total number of EEG features of<br />
a trial <strong>for</strong> 32 electrodes is 216. Table 5 summarizes the<br />
list of features extracted from the physiological signals.<br />
6.2 MCA Features<br />
Music videos were encoded into the MPEG-1 <strong>for</strong>mat to<br />
extract motion vectors and I-frames <strong>for</strong> further feature<br />
extraction. The video stream has been segmented at the<br />
shot level <strong>using</strong> the method proposed in [55].<br />
From a movie director’s point of view, lighting key<br />
[30], [56] and color variance [30] are important tools<br />
to evoke emotions. We there<strong>for</strong>e extracted lighting key<br />
from frames in the HSV space by multiplying the average<br />
value V (in HSV) by the standard deviation of the<br />
values V (in HSV). Color variance was obtained in the<br />
CIE LUV color space by computing the determinant of<br />
the covariance matrix of L, U, and V.<br />
Hanjalic and Xu [29] showed the relationship between<br />
video rhythm and affect. The average shot change rate,<br />
and shot length variance were extracted to characterize<br />
videorhythm.Fast moving scenesorobjects’ movements<br />
in consecutive frames are also an effective factor <strong>for</strong><br />
evoking excitement. To measure this factor, the motion<br />
component was defined as the amount of motion in consecutive<br />
frames computed by accumulating magnitudes<br />
of motion vectors <strong>for</strong> all B- and P-frames.<br />
Colors andtheir proportions areimportant parameters<br />
to elicit emotions [57]. A 20 bin color histogram of hue<br />
and lightness values in the HSV space was computed <strong>for</strong><br />
each I-frame and subsequently averaged over all frames.<br />
The resulting bin averages were used as video contentbased<br />
features. The median of the L value in HSL space<br />
was computed to obtain the median lightness of a frame.<br />
Finally, visual cues representing shadow proportion,<br />
visual excitement, grayness and details were also determined<br />
according to the definition given in [30].<br />
Sound also has an important impact on affect. For example,<br />
loudness of speech (energy) is related to evoked<br />
arousal, while rhythm and average pitch in speech signals<br />
arerelatedtovalence[58].The audiochannels of the<br />
videos were extracted and encoded into mono MPEG-3<br />
<strong>for</strong>mat at a sampling rate of 44.1 kHz. All audio signals<br />
were normalized to the same amplitude range be<strong>for</strong>e<br />
further processing. A total of 53 low-level audio features<br />
were determined <strong>for</strong> each of the audio signals. These<br />
features, listed in Table 6, are commonly used in audio<br />
and speech processing and audio classification [59], [60].<br />
MFCC, <strong>for</strong>mants and the pitch of audio signals were<br />
extracted <strong>using</strong> the PRAAT software package [61].<br />
6.3 Fusion of single-modality results<br />
Fusion of the multiple modalities explained above aims<br />
at improving classification results by exploiting the complementary<br />
natureof the differentmodalities. In general,<br />
approaches <strong>for</strong> modality fusion can be classified into<br />
two broad categories, namely, feature fusion (or early<br />
integration) and decision fusion (or late integration) [63].<br />
In feature fusion, the features extracted from signals of<br />
different modalities are concatenated to <strong>for</strong>m a composite<br />
feature vector and then inputted to a recognizer.<br />
In decision fusion, on the other hand, each modality
IEEE TRANS. AFFECTIVE COMPUTING 12<br />
TABLE 6<br />
Low-level features extracted from audio signals.<br />
Feature category Extracted features<br />
MFCC MFCC coefficients (13 features) [59], Derivative<br />
of MFCC (13 features), Autocorrelation of<br />
MFCC (13 features)<br />
Energy Average energy of audio signal [59]<br />
Formants Formants up to 5500Hz (female voice) (five<br />
features)<br />
Time frequency MSpectrum flux, Spectral centroid, Delta spectrum<br />
magnitude, Band energy ratio [59], [60]<br />
Pitch First pitch frequency<br />
Zero crossing rate Average, Standard deviation [59]<br />
Silence ratio Proportion of silence in a time window [62]<br />
is processed independently by the corresponding classifier<br />
and the outputs of the classifiers are combined<br />
to yield the final result. Each approach has its own<br />
advantages.Forexample,implementing afeaturefusionbased<br />
system is straight<strong>for</strong>ward, while a decision fusionbased<br />
system can be constructed by <strong>using</strong> existing unimodal<br />
classification systems. Moreover, feature fusion<br />
can consider synchronous characteristics of the involved<br />
modalities, whereas decision fusion allows us to model<br />
asynchronous characteristics of the modalities flexibly.<br />
An important advantage of decision fusion over feature<br />
fusion is that, since eachof the signals areprocessed<br />
and classified independently in decision fusion, it is<br />
relatively easy to employ an optimal weighting scheme<br />
to adjust the relative amount of the contribution of each<br />
modality to the final decision according to the reliability<br />
of the modality. The weighting scheme used in our work<br />
can be <strong>for</strong>malized as follows: For a given test datum X,<br />
the classification result of the fusion system is<br />
�<br />
M�<br />
�<br />
c ∗ = argmax<br />
i<br />
m=1<br />
Pi(X|λm) αm<br />
where M is the number of modalities considered <strong>for</strong><br />
fusion, λm is the classifier <strong>for</strong> the m-th modality, and<br />
Pi(X|λm) is its output <strong>for</strong> the i-th class. The weighting<br />
factors αm, which satisfy 0 ≤ αm ≤ 1 and �M m=1αm = 1,<br />
determine how much each modality contributes to the<br />
final decision and represent the modality’s reliability.<br />
We adopt a simple method where the weighting factors<br />
are fixed once their optimal values are determined<br />
from the training data. The optimal weight values are<br />
estimated by exhaustively searching the regular grid<br />
space, where each weight is incremented from 0 to 1<br />
by 0.01 and the weighting values producing the best<br />
classification results <strong>for</strong> the training data are selected.<br />
6.4 Results and Discussion<br />
Table 7 shows the average accuracies and F1-scores<br />
(average F1-score <strong>for</strong> both classes) over participants <strong>for</strong><br />
(4)<br />
TABLE 7<br />
Average accuracies (ACC) and F1-scores (F1, average<br />
of score <strong>for</strong> each class) over participants. Stars indicate<br />
whether the F1-score distribution over subjects is<br />
significantly higher than 0.5 according to an independent<br />
one-sample t-test (∗∗ = p < .01, ∗ = p < .05). For<br />
comparison, expected results are given <strong>for</strong> classification<br />
based on random voting, voting according to the majority<br />
class and voting with the ratio of the classes.<br />
Arousal Valence Liking<br />
Modality ACC F1 ACC F1 ACC F1<br />
EEG 0.620 0.583** 0.576 0.563** 0.554 0.502<br />
Peripheral 0.570 0.533* 0.627 0.608** 0.591 0.538**<br />
MCA 0.651 0.618** 0.618 0.605** 0.677 0.634**<br />
Random 0.500 0.483 0.500 0.494 0.500 0.476<br />
Majority class 0.644 0.389 0.586 0.368 0.670 0.398<br />
Class ratio 0.562 0.500 0.525 0.500 0.586 0.500<br />
each modality and each rating scale. We compare the<br />
results to the expected values (analytically determined)<br />
of voting randomly, voting according to the majority<br />
class in the training data, and voting <strong>for</strong> each class<br />
with the probability of its occurrence in the training<br />
data. For determining the expected values of majority<br />
voting and class ratio voting, we used the class ratio of<br />
eachparticipant’sfeedbackduringtheexperiment.These<br />
results are slightly too high, as in reality the class ratio<br />
would have to be estimated from the training set in each<br />
fold of the leave-one-out cross-validation.<br />
Voting according to the class ratio gives an expected<br />
F1-score of 0.5 <strong>for</strong> each participant. To test <strong>for</strong> significance,<br />
an independent one-sample t-test was per<strong>for</strong>med,<br />
comparing the F1-distribution over participants to the<br />
0.5 baseline. As can be seen from the table, 8 out of<br />
the 9 obtained F1-scores are significantly better than the<br />
class ratio baseline. The exception is the classification<br />
of liking <strong>using</strong> EEG signals (p = 0.068). When voting<br />
according to the majority class, relatively high accuracies<br />
are achieved, due to the imbalanced classes. However,<br />
this voting scheme also has the lowest F1-scores.<br />
Overall, classification <strong>using</strong> the MCA features fares<br />
significantly better than EEG and peripheral (p < 0.0001<br />
<strong>for</strong> both), while EEG and peripheral scores are not significantly<br />
different (p = 0.41) (tested <strong>using</strong> a two-sided<br />
repeated samples t-test over the concatenated results<br />
from each rating scale and participant).<br />
The modalities can be seen to per<strong>for</strong>m moderately<br />
complementary, where EEG scores best <strong>for</strong> arousal, peripheral<br />
<strong>for</strong> valence and MCA <strong>for</strong> liking. Of the different<br />
rating scales, valence classification per<strong>for</strong>med best, followed<br />
by liking and lastly arousal.<br />
Table 8 gives the results of multi-modal fusion. Two<br />
fusionmethods wereemployed; themethod describedin<br />
section 6.3 and the basic method where each modality<br />
is weighed equally. The best results were obtained when
IEEE TRANS. AFFECTIVE COMPUTING 13<br />
TABLE 8<br />
F1-scores <strong>for</strong> fusion of the best two modalities and all three modalities <strong>using</strong> the equal weights and optimal weights<br />
scheme. For comparison, the F1-score <strong>for</strong> the best single modality is also given.<br />
Arousal Valence Liking<br />
Modality Optimal w. Equal w. Modality Optimal w. Equal w. Modality Optimal w. Equal w.<br />
Best single modality MCA 0.618 —– PER 0.608 —– MCA 0.634 —–<br />
Best two modalities EEG,MCA 0.631 0.629 MCA,PER 0.638 0.652 MCA,PER 0.622 0.642<br />
All three modalities All 0.616 0.618 All 0.647 0.640 All 0.618 0.607<br />
only the two best-per<strong>for</strong>ming modalities were considered.<br />
Though fusion generally outper<strong>for</strong>ms the single<br />
modalities, it is only significant <strong>for</strong> the case of MCA,PER<br />
weighted equally in the valence scale (p = 0.025).<br />
While the presented results are significantly higher<br />
than random classification, there remains much room<br />
<strong>for</strong> improvement. Signal noise, individual physiological<br />
differences and limited quality of self-assessments make<br />
single-trial classification challenging.<br />
7 CONCLUSION<br />
In this work, we have presented a database <strong>for</strong> the<br />
analysis of spontaneous emotions. The database contains<br />
physiological signals of 32 participants (and frontal<br />
face video of 22 participants), where each participant<br />
watched and rated their emotional response to 40 music<br />
videos along the scales of arousal, valence, and<br />
dominance, as well as their liking of and familiarity<br />
with the videos. We presented a novel semi-automatic<br />
stimuli selection method <strong>using</strong> affective tags, which was<br />
validated by an analysis of the ratings participants gave<br />
during the experiment. Significant correlates were found<br />
between the participant ratings and EEG frequencies.<br />
Single-trial classification was per<strong>for</strong>med <strong>for</strong> the scales of<br />
arousal, valence and liking <strong>using</strong> features extracted from<br />
the EEG, peripheral and MCA modalities. The results<br />
were shown to be significantly better than random classification.<br />
Finally, decision fusion of these results yielded<br />
a modest increase in the per<strong>for</strong>mance, indicating at least<br />
some complementarity to the modalities.<br />
The database is made publicly available and it is our<br />
hope that other researchers will try their methods and<br />
algorithms on this highly challenging database.<br />
ACKNOWLEDGMENTS<br />
The researchleading to these results has been per<strong>for</strong>med<br />
in the frameworks of European Community’s Seventh<br />
FrameworkProgram(FP7/2007-2011)undergrantagreement<br />
no. 216444 (PetaMedia). Furthermore, the authors<br />
gratefully acknowledge the support of the BrainGain<br />
Smart Mix Programme of the Netherlands Ministry of<br />
Economic Affairs, the Netherlands Ministry of Education,<br />
Culture and Science and the Swiss National Foundation<br />
<strong>for</strong> Scientific Research and the NCCR Interactive<br />
Multimodal In<strong>for</strong>mation Management (IM2). The authors<br />
also thank Sebastian Schmiedeke and Pascal Kelm<br />
at the Technische Universität Berlin <strong>for</strong> per<strong>for</strong>ming the<br />
shot boundary detection on this dataset.<br />
REFERENCES<br />
[1] M. K. Shan,F. F. Kuo, M. F. Chiang, andS. Y. Lee,“<strong>Emotion</strong>-based<br />
music recommendation by affinity discovery from film music,”<br />
Expert Syst. Appl., vol. 36, no. 4, pp. 7666–7674, September 2009.<br />
[2] M.Tkalčič,U.Burnik,andA.Koˇsir,“Usingaffectiveparametersin<br />
a content-based recommender system <strong>for</strong> images,” User Modeling<br />
and User-Adapted Interaction, pp. 1–33–33, September 2010.<br />
[3] J. J. M. Kierkels, M. Soleymani, and T. Pun, “Queries and tags in<br />
affect-based multimedia retrieval,” in Proc. Int. Conf. Multimedia<br />
and Expo. New York, NY, USA: IEEE Press, 2009, pp. 1436–1439.<br />
[4] M. Soleymani, J. Lichtenauer, T. Pun, and M. Pantic, “A multimodal<br />
Affective<strong>Database</strong><strong>for</strong> AffectRecognition andImplicit Tagging,”<br />
IEEE Trans. Affective Computing, Special Issue on Naturalistic<br />
Affect Resources <strong>for</strong> System Building and Evaluation, under review.<br />
[5] A. Savran, K. Ciftci, G. Chanel, J. C. Mota, L. H. Viet, B. Sankur,<br />
L.Akarun,A.Caplier,andM.Rombaut,“<strong>Emotion</strong>detectioninthe<br />
loop from brain signals and facial images,” in Proc. eNTERFACE<br />
2006 Workshop, Dubrovnik, Croatia, Jul. 2006.<br />
[6] P. Ekman, W. V. Friesen, M. O’Sullivan, A. Chan, I. Diacoyanni-<br />
Tarlatzis, K. Heider, R. Krause, W. A. LeCompte, T. Pitcairn,<br />
and P. E. Ricci-Bitti, “Universals and cultural differences in the<br />
judgments of facial expressions of emotion.” Journal of Personality<br />
and Social Psychology, vol. 53, no. 4, pp. 712–717, Oct. 1987.<br />
[7] W. G. Parrott, <strong>Emotion</strong>s in Social Psychology: Essential Readings.<br />
Philadelphia: Psychology Press, 2001.<br />
[8] R. Plutchik, “The nature of emotions,” American Scientist, vol. 89,<br />
p. 344, 2001.<br />
[9] J. A. Russell, “A circumplex model of affect,” Journal of Personality<br />
and Social Psychology, vol. 39, no. 6, pp. 1161–1178, 1980.<br />
[10] M. M. Bradley and P. J. Lang, “Measuring emotion: the selfassessment<br />
manikin and the semantic differential.” J. Behav. Ther.<br />
Exp. Psychiatry, vol. 25, no. 1, pp. 49–59, Mar. 1994.<br />
[11] M. Pantic, M. Valstar, R. Rademaker, and L. Maat, “Web-based<br />
database <strong>for</strong> facial expression analysis,” in Proc. Int. Conf. Multimedia<br />
and Expo, Amsterdam, The Netherlands, 2005, pp. 317–321.<br />
[12] E. Douglas-Cowie, R. Cowie, and M. Schröder, “A new emotion<br />
database: Considerations, sources and scope,” in Proc. ISCA Workshop<br />
on Speech and <strong>Emotion</strong>, 2000, pp. 39–44.<br />
[13] H. Gunes and M. Piccardi, “A bimodal face and body gesture<br />
database <strong>for</strong> automatic analysis of human nonverbal affective<br />
behavior,” in Proc. Int. Conf. Pattern Recognition, vol. 1, 2006, pp.<br />
1148–1153.<br />
[14] G. Fanelli, J. Gall, H. Romsdorfer, T. Weise, and L. Van Gool, “A<br />
3-D audio-visual corpus of affective communication,” IEEE Trans.<br />
Multimedia, vol. 12, no. 6, pp. 591–598, Oct. 2010.<br />
[15] M. Grimm, K. Kroschel, and S. Narayanan, “The vera am mittag<br />
german audio-visual emotional speech database,” in Proc. Int.<br />
Conf. Multimedia and Expo, 2008, pp. 865 –868.<br />
[16] J. A. Healey, “Wearable and automotive systems <strong>for</strong> affect recognition<br />
from physiology,” Ph.D. dissertation, MIT, 2000.
IEEE TRANS. AFFECTIVE COMPUTING 14<br />
[17] J. A. Healey and R. W. Picard, “Detecting stress during realworld<br />
driving tasks <strong>using</strong> physiological sensors,” IEEE Trans.<br />
Intell. Transp. Syst., vol. 6, no. 2, pp. 156–166, 2005.<br />
[18] P. Lang, M. Bradley, and B. Cuthbert, “International affective picture<br />
system (IAPS): Affective ratings of pictures and instruction<br />
manual,” University of Florida, USA, Tech. Rep. A-8, 2008.<br />
[19] Z. Zeng, M. Pantic, G. I. Roisman, and T. S. Huang, “A survey<br />
of affect recognition methods: Audio, visual, and spontaneous<br />
expressions,” IEEE Trans. Pattern Anal. Mach. Intell., vol. 31, no. 1,<br />
pp. 39–58, Mar. 2009.<br />
[20] P. Lang, M. Greenwald, M. Bradely, and A. Hamm, “Looking<br />
at pictures - affective, facial, visceral, and behavioral reactions,”<br />
Psychophysiology, vol. 30, no. 3, pp. 261–273, May 1993.<br />
[21] J.KimandE.André,“<strong>Emotion</strong>recognitionbasedonphysiological<br />
changes in music listening,” IEEETrans.Pattern Anal. Mach. Intell.,<br />
vol. 30, no. 12, pp. 2067–2083, 2008.<br />
[22] J. Wang and Y. Gong, “Recognition of multiple drivers’ emotional<br />
state,” in Proc. Int. Conf. Pattern Recognition, 2008, pp. 1 –4.<br />
[23] C. L. Lisetti and F. Nasoz, “Using noninvasive wearable computers<br />
to recognize human emotions from physiological signals,”<br />
EURASIP J. Appl. Signal Process., vol. 2004, no. 1, pp. 1672–1687,<br />
Jan. 2004.<br />
[24] G. Chanel, J. Kierkels, M. Soleymani, and T. Pun, “Short-term<br />
emotion assessment in a recall paradigm,” International Journal of<br />
Human-Computer Studies, vol. 67, no. 8, pp. 607–627, Aug. 2009.<br />
[25] J. Kierkels, M. Soleymani, and T. Pun, “Queries and tags in affectbased<br />
multimedia retrieval,” in Proc. Int. Conf. Multimedia and<br />
Expo, Special Session on Implicit Tagging, New York, USA,Jun.2009,<br />
pp. 1436 – 1439.<br />
[26] M. Soleymani, G. Chanel, J. J. M. Kierkels, and T. Pun, “Affective<br />
characterization of movie scenes based on content analysis and<br />
physiological changes,” International Journal of Semantic Computing,<br />
vol. 3, no. 2, pp. 235–254, Jun. 2009.<br />
[27] A.Yazdani, J.-S.Lee,andT.Ebrahimi,“Implicit emotional tagging<br />
of multimedia <strong>using</strong> EEG signals and brain computer interface,”<br />
in Proc. SIGMM Workshop on Social media, 2009, pp. 81–88.<br />
[28] P. Ekman, W. Friesen, M. Osullivan, A. Chan, I. Diacoyannitarlatzis,<br />
K. Heider, R. Krause, W. Lecompte, T. Pitcairn, P. Riccibitti,<br />
K. Scherer, M. Tomita, and A. Tzavaras, “Universals and culturaldifferences<br />
in the judgments of facial expressions of emotion,”<br />
Journal of Personality and Social Psychology, vol. 53, no. 4, pp. 712–<br />
717, Oct. 1987.<br />
[29] A. Hanjalic and L.-Q. Xu, “Affective video content representation<br />
and modeling,” IEEE Trans. Multimedia, vol. 7, no. 1, pp. 143–154,<br />
2005.<br />
[30] H. L. Wang and L.-F. Cheong, “Affective understanding in film,”<br />
IEEE Trans. Circuits Syst. Video Technol., vol. 16, no. 6, pp. 689 –<br />
704, Jun. 2006.<br />
[31] M. Soleymani, J. Kierkels, G. Chanel, and T. Pun, “A Bayesian<br />
framework <strong>for</strong> video affective representation,” in Proc. Int. Conf.<br />
Affective Computing and Intelligent interaction, Sep. 2009, pp. 1–7.<br />
[32] D. Liu, “Automatic mood detection from acoustic music data,” in<br />
Proc. Int. Conf. Music In<strong>for</strong>mation Retrieval, 2003, pp. 13–17.<br />
[33] L. Lu, D. Liu, and H.-J. Zhang, “Automatic mood detection and<br />
tracking of music audio signals,” IEEE Transactions on Audio,<br />
Speech and Language Processing, vol. 14, no. 1, pp. 5–18, Jan. 2006.<br />
[34] Y.-H. Yang and H. H. Chen, “Music emotion ranking,” in Proc.<br />
Int. Conf. Acoustics, Speech and Signal Processing, ser. ICASSP ’09,<br />
Washington, DC, USA, 2009, pp. 1657–1660.<br />
[35] S. Koelstra, A. Yazdani, M. Soleymani, C. Mühl, J.-S. Lee, A. Nijholt,<br />
T. Pun, T. Ebrahimi, and I. Patras, “Single trial classification<br />
of EEG and peripheral physiological signals <strong>for</strong> recognition of<br />
emotions induced by music videos,” in Brain In<strong>for</strong>matics, ser.<br />
Lecture Notes in Computer Science, Y. Yao, R. Sun, T. Poggio,<br />
J. Liu, N. Zhong, and J. Huang, Eds. Berlin, Heidelberg: Springer<br />
Berlin / Heidelberg, 2010, vol. 6334, ch. 9, pp. 89–100.<br />
[36] M. E. Tipping, “Sparse bayesian learning and the relevance vector<br />
machine,” Journal of Machine Learning Research, vol. 1, pp. 211–244,<br />
Jun. 2001.<br />
[37] J. D. Morris, “SAM: the self-assessment manikin. An efficient<br />
cross-cultural measurement of emotional response,” Journal of<br />
Advertising Research, vol. 35, no. 8, pp. 63–68, 1995.<br />
[38] M. Bradley and P. Lang, “International affective digitized sounds<br />
(iads): Stimuli, instruction manual and affective ratings,” The<br />
Center <strong>for</strong> Research in Psychophysiology, University of Florida,<br />
Gainesville, Florida, US, Tech. Rep. B-2, 1999.<br />
[39] Lazar, N., “Combining Brains: A Survey of Methods <strong>for</strong> Statistical<br />
Pooling of In<strong>for</strong>mation,” NeuroImage, vol. 16, no. 2, pp. 538–550,<br />
June 2002.<br />
[40] T. M. Loughin, “A systematic comparison of methods <strong>for</strong> combining<br />
p-values from independent tests,” Computational Statistics<br />
& Data <strong>Analysis</strong>, vol. 47, pp. 467–485, 2004.<br />
[41] R. J. Barry, A. R. Clarke, S. J. Johnstone, C. A. Magee, and J. A.<br />
Rushby, “EEG differences between eyes-closed and eyes-open<br />
resting conditions,” Clinical Neurophysiology, vol. 118, no. 12, pp.<br />
2765–2773, Dec. 2007.<br />
[42] R. J. Barry, A. R. Clarke, S. J. Johnstone, and C. R. Brown, “EEG<br />
differences in children betweeneyes-closed and eyes-open resting<br />
conditions,” Clinical Neurophysiology, vol. 120, no. 10, pp. 1806–<br />
1811, Oct. 2009.<br />
[43] W. Klimesch, P. Sauseng, and S. Hanslmayr, “EEG alpha oscillations:<br />
the inhibition-timing hypothesis.” Brain Research Reviews,<br />
vol. 53, no. 1, pp. 63–88, Jan. 2007.<br />
[44] H. Cole and W. J. Ray, “EEG correlates of emotional tasks related<br />
to attentional demands,” International Journal of Psychophysiology,<br />
vol. 3, no. 1, pp. 33–41, Jul. 1985.<br />
[45] J. Onton andS. Makeig, “High-frequency broadbandmodulations<br />
of electroencephalographic spectra,” Frontiers in Human Neuroscience,<br />
vol. 3, 2009.<br />
[46] I. Goncharova, D. J. McFarland, J. R. Vaughan, and J. R. Wolpaw,<br />
“EMG contamination of EEG: spectral and topographical characteristics,”<br />
Clinical Neurophysiology, vol. 114, no. 9, pp. 1580–1593,<br />
Sep. 2003.<br />
[47] E. Harmon-Jones, “Clarifying the emotive functions of asymmetrical<br />
frontal cortical activity,” Psychophysiology, vol. 40, no. 6, pp.<br />
838–848, 2003.<br />
[48] R. R. Cornelius, The Science of <strong>Emotion</strong>. Research and Tradition in<br />
the Psychology of <strong>Emotion</strong>. Upper Saddle River, NJ: Prentice-Hall,<br />
1996.<br />
[49] D. Sander, D. Grandjean, and K. R. Scherer, “A systems approach<br />
to appraisal mechanisms in emotion,” Neural Networks, vol. 18,<br />
no. 4, pp. 317–352, 2005.<br />
[50] R. McCraty, M. Atkinson, W. Tiller, G. Rein, and A. Watkins, “The<br />
effects of emotions on short-term power spectrum analysis of<br />
heart rate variability,” The American Journal of Cardiology, vol. 76,<br />
no. 14, pp. 1089 – 1093, 1995.<br />
[51] S. D. Kreibig, “Autonomic nervous system activity in emotion: A<br />
review,” Biological Psychology, vol. 84, no. 3, pp. 394–421, 2010.<br />
[52] G.Chanel,J.J.M.Kierkels, M.Soleymani,andT.Pun,“Short-term<br />
emotion assessment in a recall paradigm,” International Journal of<br />
Human-Computer Studies, vol. 67, no. 8, pp. 607–627, Aug. 2009.<br />
[53] J.KimandE.André,“<strong>Emotion</strong>recognition basedonphysiological<br />
changes in music listening,” IEEETrans.Pattern Anal. Mach. Intell.,<br />
vol. 30, no. 12, pp. 2067–2083, 2008.<br />
[54] P. Rainville, A. Bechara, N. Naqvi, and A. R. Damasio, “Basic<br />
emotionsare associated with distinctpatternsof cardiorespiratory<br />
activity.” International Journal of Psychophysiology, vol.61, no. 1, pp.<br />
5–18, Jul. 2006.<br />
[55] P. Kelm, S. Schmiedeke, and T. Sikora, “Feature-based video key<br />
frame extraction <strong>for</strong> low quality video sequences,” in Proc. Int.<br />
Workshop on Image <strong>Analysis</strong> <strong>for</strong> Multimedia Interactive Services, May<br />
2009, pp. 25 –28.<br />
[56] Z. Rasheed, Y. Sheikh, and M. Shah, “On the use of computable<br />
features <strong>for</strong> film classification,” IEEE Trans. Circuits Syst. Video<br />
Technol., vol. 15, no. 1, pp. 52–64, 2005.<br />
[57] P. Valdez and A. Mehrabian, “Effects of color on emotions.” J.<br />
Exp. Psychol. Gen., vol. 123, no. 4, pp. 394–409, Dec. 1994.<br />
[58] R. W. Picard, Affective Computing. MIT Press, Sep. 1997.<br />
[59] D. Li, I. K. Sethi, N. Dimitrova, and T. McGee, “Classification of<br />
general audio data <strong>for</strong> content-based retrieval,” Pattern Recogn.<br />
Lett., vol. 22, no. 5, pp. 533–544, 2001.<br />
[60] L. Lu, H. Jiang, and H. Zhang, “A robust audio classification<br />
and segmentation method,” in Proc. ACM Int. Conf. Multimedia,<br />
Ottawa, Canada, 2001, pp. 203–211.<br />
[61] P. Boersma, “Praat, a system <strong>for</strong> doing phonetics by computer,”<br />
Glot International, vol. 5, no. 9/10, pp. 341–345, 2001.<br />
[62] L. Chen, S. Gunduz, and M. Ozsu, “Mixed type audio classification<br />
with support vector machine,” in Proc. Int. Conf. Multimedia<br />
and Expo, Toronto, Canada, Jul. 2006, pp. 781 –784.<br />
[63] J.-S. Lee and C. H. Park, “Robust audio-visual speech recognition<br />
based on late integration,” IEEE Trans. Multimedia, vol. 10, no. 5,<br />
pp. 767–779, 2008.
IEEE TRANS. AFFECTIVE COMPUTING 15<br />
Sander Koelstra (S’09) received the B.Sc. and<br />
M.Sc. degrees in Computer Science from the<br />
Delft University of Technology, The Netherlands,<br />
in 2006 and 2008, respectively. He is currently a<br />
PhD student with the School of Electronic Engineering<br />
and Computer Science at Queen Mary<br />
University of London. His research interests lie<br />
in the areas of brain-computer interaction, computer<br />
vision and pattern recognition.<br />
Christian Mühl is a PhD researcher at the<br />
Human-Media Interaction group of the University<br />
of Twente, The Netherlands. After receiving<br />
a M.Sc. Cognitive Science at the University<br />
of Osnabrueck, Germany, in 2007, working on<br />
neurophysiological mechanisms of cross-modal<br />
attention, he focuses now on the identification<br />
of affective states by neurophysiological signals<br />
in various induction contexts. Especially, he is<br />
interested in the differential effects of auditory<br />
and visual affective stimulation on the activity of<br />
the brain as measured via electroencephalography.<br />
Mohammad Soleymani (S’05) received both<br />
his B.Sc. and M. Sc. from department of Electrical<br />
and Computer Engineering, University of<br />
Tehran, in 2003 and 2006. He is now a doctoral<br />
student and research assistant at the Computer<br />
Vision and Multimedia Laboratory (CVML),<br />
Computer Science Department, University of<br />
Geneva. His research interests include: affective<br />
computing, and multimedia in<strong>for</strong>mation retrieval.<br />
He has been co-organizing the MediaEval multimedia<br />
benchmarking initiative since 2010.<br />
Jong-Seok Lee (M’06) received his Ph.D. degree<br />
in electrical engineering and computer<br />
science in 2006 from KAIST, Daejeon, Korea,<br />
where he worked as a postdoctoral researcher<br />
and an adjunct professor. He is now working<br />
as a research scientist in the Multimedia Signal<br />
Processing Group at Swiss Federal Institute<br />
of Technology in Lausanne (EPFL), Lausanne,<br />
Switzerland. His current research interests include<br />
audio-visual signal processing, multimedia<br />
quality assessment and multimodal humancomputer<br />
interaction. He is (co-)author of more than 50 publications.<br />
Ashkan Yazdani received his M.Sc. in electrical<br />
engineering from University of Tehran, Iran in<br />
2007. From 2006 to 2007, he worked as research<br />
assistant in the Brain Signal Processing<br />
Group at University of Tehran, on the topics<br />
of EEG-based person identification, braincomputer<br />
interfacing and fMRI signal processing.<br />
He is currently a PhD candidate at the Multimedia<br />
Signal Processing Group, Swiss Federal<br />
Institute of Technology in Lausanne (EPFL),<br />
Lausanne, Switzerland. His main research interests<br />
include EEG-based brain-computer interface systems and biomedical<br />
signal processing.<br />
Touradj Ebrahimi (M’92) received his M.Sc.<br />
and Ph.D., both in electrical engineering, from<br />
the Swiss Federal Institute of Technology in Lausanne<br />
(EPFL), Lausanne, Switzerland, in 1989<br />
and 1992, respectively. From 1989 to 1992, he<br />
was a research assistant at the Signal Processing<br />
Laboratory of EPFL. In 1990, he was<br />
a visiting researcher at the Signal and Image<br />
Processing Institute of the University of Southern<br />
Cali<strong>for</strong>nia, Los Angeles, Cali<strong>for</strong>nia. In 1993,<br />
he was a research engineer at the Corporate<br />
Research Laboratories of Sony Corporation in Tokyo. In 1994, he served<br />
as a research consultant at AT&T Bell Laboratories. He is currently a<br />
Professor heading Multimedia Signal Processing Group at EPFL, where<br />
he is involved with various aspects of digital video and multimedia<br />
applications. He is (co-)author of over 100 papers and holds 10 patents.<br />
Thierry Pun (IEEE Member, EE Eng. 1979,<br />
PhD 1982) is head of the Computer Vision<br />
and Multimedia Laboratory, Computer Science<br />
Department, University of Geneva, Switzerland.<br />
He received his Ph.D. in image processing <strong>for</strong><br />
the development of a visual prosthesis <strong>for</strong> the<br />
blind in 1982, at the Swiss Federal Institute<br />
of Technology, Lausanne, Switzerland. He was<br />
visiting fellow from 1982 to 1985 at the National<br />
Institutes of Health, Bethesda, USA. After being<br />
CERN Fellow from 1985 to 1986 in Geneva,<br />
Switzerland, he joined the University of Geneva, in 1986, where he<br />
currently is full professor at the Computer Science Department. He has<br />
authored or co-authored about 300 full papers as well as eight patents.<br />
His current research interests, related to affective computing and multimodal<br />
interaction, concern: physiological signals analysis <strong>for</strong> emotion<br />
assessment and brain-computer interaction, multimodal interfaces <strong>for</strong><br />
blind users, data hiding, multimedia in<strong>for</strong>mation retrieval systems.<br />
and workshops.<br />
Anton Nijholt is full professor of Human Media<br />
Interaction at the University of Twente (NL). His<br />
main research interests are multimodal interaction,<br />
brain-computer interfacing, virtual humans,<br />
affective computing, and entertainment computing.<br />
He has co-organized many conferences<br />
(e.g., IVA 2009 and ACII 2009) and satellite<br />
workshops (e.g., on affective brain-computer interfacing)<br />
and has been guest-editor of many<br />
journals <strong>for</strong> special issues devoted to selections<br />
of updates of papers from these conferences<br />
Ioannis (Yiannis) Patras (S’97, M’02, SM’11)<br />
received the the Ph.D. degree from the Department<br />
of Electrical Engineering, Delft University<br />
of Technology, The Netherlands, in 2001. He<br />
is a Senior Lecturer in Computer Vision in the<br />
School of Electronic Engineering and Computer<br />
Science in the Queen Mary, University of London.<br />
He is/has been in the organizing committee<br />
of IEEE SMC 2004, Face and Gesture Recognition<br />
2008, ICMR2011, ACM Multimedia 2013<br />
and was the general chair of WIAMIS 2009. He<br />
is associate editor in the Image and Vision Computing Journal. His<br />
research interests lie in the areas of Computer Vision and Pattern<br />
Recognition, with emphasis on Human Sensing and its applications<br />
in Multimedia Retrieval and Multimodal Human Computer Interaction.<br />
Currently, he is interested in Brain Computer Interfaces and the analysis<br />
of facial and body gestures.