DEAP: A Database for Emotion Analysis using Physiological Signals
DEAP: A Database for Emotion Analysis using Physiological Signals
DEAP: A Database for Emotion Analysis using Physiological Signals
You also want an ePaper? Increase the reach of your titles
YUMPU automatically turns print PDFs into web optimized ePapers that Google loves.
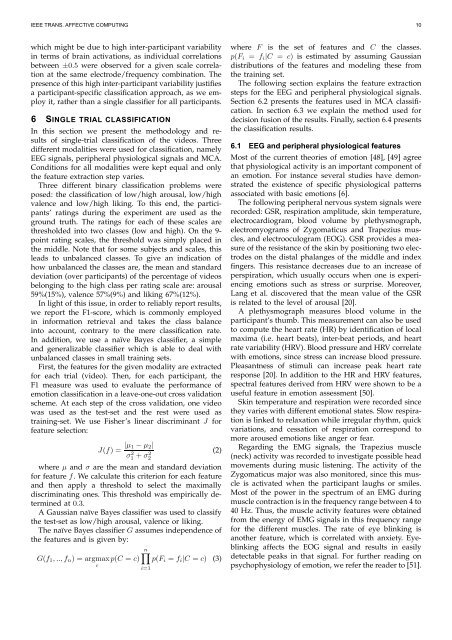
IEEE TRANS. AFFECTIVE COMPUTING 10<br />
which might be due to high inter-participant variability<br />
in terms of brain activations, as individual correlations<br />
between ±0.5 were observed <strong>for</strong> a given scale correlation<br />
at the same electrode/frequency combination. The<br />
presence of this high inter-participant variability justifies<br />
a participant-specific classification approach, as we employ<br />
it, rather than a single classifier <strong>for</strong> all participants.<br />
6 SINGLE TRIAL CLASSIFICATION<br />
In this section we present the methodology and results<br />
of single-trial classification of the videos. Three<br />
different modalities were used <strong>for</strong> classification, namely<br />
EEG signals, peripheral physiological signals and MCA.<br />
Conditions <strong>for</strong> all modalities were kept equal and only<br />
the feature extraction step varies.<br />
Three different binary classification problems were<br />
posed: the classification of low/high arousal, low/high<br />
valence and low/high liking. To this end, the participants’<br />
ratings during the experiment are used as the<br />
ground truth. The ratings <strong>for</strong> each of these scales are<br />
thresholded into two classes (low and high). On the 9point<br />
rating scales, the threshold was simply placed in<br />
the middle. Note that <strong>for</strong> some subjects and scales, this<br />
leads to unbalanced classes. To give an indication of<br />
how unbalanced the classes are, the mean and standard<br />
deviation (over participants) of the percentage of videos<br />
belonging to the high class per rating scale are: arousal<br />
59%(15%), valence 57%(9%) and liking 67%(12%).<br />
In light of this issue, in order to reliably report results,<br />
we report the F1-score, which is commonly employed<br />
in in<strong>for</strong>mation retrieval and takes the class balance<br />
into account, contrary to the mere classification rate.<br />
In addition, we use a naïve Bayes classifier, a simple<br />
and generalizable classifier which is able to deal with<br />
unbalanced classes in small training sets.<br />
First, the features <strong>for</strong> the given modality are extracted<br />
<strong>for</strong> each trial (video). Then, <strong>for</strong> each participant, the<br />
F1 measure was used to evaluate the per<strong>for</strong>mance of<br />
emotion classification in a leave-one-out cross validation<br />
scheme. At each step of the cross validation, one video<br />
was used as the test-set and the rest were used as<br />
training-set. We use Fisher’s linear discriminant J <strong>for</strong><br />
feature selection:<br />
J(f) = |µ1 −µ2|<br />
σ2 1 +σ2 (2)<br />
2<br />
where µ and σ are the mean and standard deviation<br />
<strong>for</strong> feature f. We calculate this criterion <strong>for</strong> each feature<br />
and then apply a threshold to select the maximally<br />
discriminating ones. This threshold was empirically determined<br />
at 0.3.<br />
A Gaussian naïve Bayes classifier was used to classify<br />
the test-set as low/high arousal, valence or liking.<br />
The naïve Bayes classifier G assumes independence of<br />
the features and is given by:<br />
n�<br />
G(f1,..,fn) = argmaxp(C<br />
= c) p(Fi = fi|C = c) (3)<br />
c<br />
i=1<br />
where F is the set of features and C the classes.<br />
p(Fi = fi|C = c) is estimated by assuming Gaussian<br />
distributions of the features and modeling these from<br />
the training set.<br />
The following section explains the feature extraction<br />
steps <strong>for</strong> the EEG and peripheral physiological signals.<br />
Section 6.2 presents the features used in MCA classification.<br />
In section 6.3 we explain the method used <strong>for</strong><br />
decision fusion of the results. Finally, section 6.4 presents<br />
the classification results.<br />
6.1 EEG and peripheral physiological features<br />
Most of the current theories of emotion [48], [49] agree<br />
that physiological activity is an important component of<br />
an emotion. For instance several studies have demonstrated<br />
the existence of specific physiological patterns<br />
associated with basic emotions [6].<br />
The following peripheral nervous system signals were<br />
recorded: GSR, respiration amplitude, skin temperature,<br />
electrocardiogram, blood volume by plethysmograph,<br />
electromyograms of Zygomaticus and Trapezius muscles,<br />
and electrooculogram (EOG). GSR provides a measure<br />
of the resistance of the skin by positioning two electrodes<br />
on the distal phalanges of the middle and index<br />
fingers. This resistance decreases due to an increase of<br />
perspiration, which usually occurs when one is experiencing<br />
emotions such as stress or surprise. Moreover,<br />
Lang et al. discovered that the mean value of the GSR<br />
is related to the level of arousal [20].<br />
A plethysmograph measures blood volume in the<br />
participant’s thumb. This measurement can also be used<br />
to compute the heart rate (HR) by identification of local<br />
maxima (i.e. heart beats), inter-beat periods, and heart<br />
ratevariability (HRV). Blood pressureandHRV correlate<br />
with emotions, since stress can increase blood pressure.<br />
Pleasantness of stimuli can increase peak heart rate<br />
response [20]. In addition to the HR and HRV features,<br />
spectral features derived from HRV were shown to be a<br />
useful feature in emotion assessment [50].<br />
Skin temperature and respiration were recorded since<br />
they varies with different emotional states. Slow respiration<br />
is linked to relaxation while irregular rhythm, quick<br />
variations, and cessation of respiration correspond to<br />
more aroused emotions like anger or fear.<br />
Regarding the EMG signals, the Trapezius muscle<br />
(neck) activity was recorded to investigate possible head<br />
movements during music listening. The activity of the<br />
Zygomaticus major was also monitored, since this muscle<br />
is activated when the participant laughs or smiles.<br />
Most of the power in the spectrum of an EMG during<br />
musclecontractionisinthefrequencyrangebetween4to<br />
40 Hz. Thus, the muscle activity features were obtained<br />
from the energy of EMG signals in this frequency range<br />
<strong>for</strong> the different muscles. The rate of eye blinking is<br />
another feature, which is correlated with anxiety. Eyeblinking<br />
affects the EOG signal and results in easily<br />
detectable peaks in that signal. For further reading on<br />
psychophysiology ofemotion, wereferthereaderto[51].


