Modelling an Air Traffic Control Environment Using Bayesian Belief ...
Modelling an Air Traffic Control Environment Using Bayesian Belief ...
Modelling an Air Traffic Control Environment Using Bayesian Belief ...

Create successful ePaper yourself
Turn your PDF publications into a flip-book with our unique Google optimized e-Paper software.
<strong>Modelling</strong> <strong>an</strong> <strong>Air</strong> <strong>Traffic</strong> <strong>Control</strong> <strong>Environment</strong><br />
<strong>Using</strong><br />
Bayesi<strong>an</strong> <strong>Belief</strong> Networks<br />
Dr. Martin Neil, Professor Bob Malcolm & Roger Shaw<br />
RADAR Group, Department of Computer Science, Queen Mary, University of London<br />
Keywords: Bayesi<strong>an</strong> Networks, <strong>Air</strong> <strong>Traffic</strong> <strong>Control</strong>, ATC<br />
Abstract<br />
This paper describes the process of constructing a Bayesi<strong>an</strong> <strong>Belief</strong> Network for <strong>an</strong> <strong>Air</strong> <strong>Traffic</strong><br />
<strong>Control</strong> environment. The network provides a high level model of ATC operations sp<strong>an</strong>ning a<br />
number of defensive barriers from airspace design, through tactical control, the operation of<br />
aircraft safety net features to a potential accident. Some socio-technical factors that impact the<br />
effectiveness of some of these barriers are also mentioned. The paper concludes with <strong>an</strong> example<br />
of how the net c<strong>an</strong> be used to investigate ch<strong>an</strong>ges in overall risk exposure based on a number of<br />
exploratory scenarios.<br />
Background<br />
The EPSRC funded SCORE project (Sensing Ch<strong>an</strong>ges in Operational Risk Exposure) was set up<br />
in 2001 to investigate how the risk posed by poor org<strong>an</strong>isational culture (ref. 1-2) might be<br />
measured <strong>an</strong>d monitored. The project is a collaborative venture between the RADAR Group in<br />
the Department of Computer Science, Queen Mary, University of London <strong>an</strong>d the Safety<br />
Research Group within the Department of Psychology, Liverpool University. Two studies were<br />
included in the project. One addressed Operational Risk in fin<strong>an</strong>cial environments <strong>an</strong>d the other<br />
focused on assessing the risk of collision in <strong>an</strong> <strong>Air</strong> <strong>Traffic</strong> <strong>Control</strong> environment. This paper<br />
describes the ATC study <strong>an</strong>d, in particular, the Bayesi<strong>an</strong> Network that was produced to predict<br />
accident risk <strong>an</strong>d show how different factors influence the ch<strong>an</strong>ge in risk exposure.<br />
Bayesi<strong>an</strong> Networks<br />
Bayesi<strong>an</strong> Networks (also known as Bayesi<strong>an</strong> <strong>Belief</strong> Networks, Causal Probabilistic Networks,<br />
Causal Nets, Graphical Probability Networks, Probabilistic Cause-Effect Models, <strong>an</strong>d<br />
Probabilistic Influence Diagrams) provide decision-support for a wide r<strong>an</strong>ge of problems<br />
involving uncertainty <strong>an</strong>d probabilistic reasoning. The underlying theory of BNs is Bayesi<strong>an</strong><br />
probability theory <strong>an</strong>d the idea of evidence propagation through a network structure.<br />
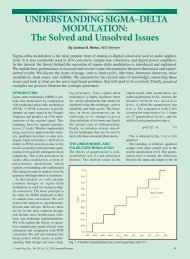
A BN is a directed graph, together with <strong>an</strong> associated set of probability tables called Node<br />
Probability Tables or NPTs. The graph consists of nodes <strong>an</strong>d arcs as shown in Figure 1. The<br />
nodes represent variables, which c<strong>an</strong> be discrete or continuous. For example, the node Faults in<br />
Test/Review is discrete having values 0,1,2, whereas the node System Safety might be continuous<br />
(such as the probability of failure on dem<strong>an</strong>d). The arcs represent causal/influential relationships<br />
between variables. For example, the Correctness of Solution <strong>an</strong>d Accuracy of Testing influence<br />
the number of Faults in Test/Review; hence this relationship is modelled by drawing appropriate<br />
arcs as shown. The key feature of BNs is that they enable uncertainty to be modelled <strong>an</strong>d<br />
reasoned about. BNs also offer considerable <strong>an</strong>alytical power to the modeller. They c<strong>an</strong> show<br />
which variables contribute most to establishing a hypothesis <strong>an</strong>d c<strong>an</strong> show how sensitive variable<br />
valuation is in determining a hypothesis. In more complicated networks variables may contribute<br />
in different proportions to establishing a hypothesis. For example, knowing how sensitive a
variable is in determining a hypothesis will provide guid<strong>an</strong>ce on how much effort should be<br />
devoted to accurately determining the value of the variable. If small ch<strong>an</strong>ges in the value of a<br />
variable dramatically alter the value of the hypothesis variable then it should be determined as<br />
accurately as possible; if the hypothesis is not that sensitive to the value of the variable then less<br />
effort c<strong>an</strong> be devoted to its determination.<br />
As part of the process of developing a BN, Node Probability Tables (NPTs) need to be<br />
constructed. Variables with no parents represent our prior assumptions regarding their likelihood<br />
while variables with parents will have probabilities conditioned upon those parent nodes.<br />
Determining the NPTs is part of the knowledge elicitation process, which traditionally has proved<br />
to be a time consuming <strong>an</strong>d often difficult task. Although not discussed here the SCORE project<br />
has developed <strong>an</strong> approach to facilitate the collection of this information from experts using a<br />
small set of graphical tools to support the process.<br />
The benefits of BNs may be summarised as follows:<br />
• Provides a sound method for reasoning under uncertainty.<br />
• Permit the combining of diverse data, including subjective beliefs <strong>an</strong>d empirical data.<br />
• Predictions c<strong>an</strong> still be secured even when evidence is incomplete.<br />
• Permits powerful “what-if” <strong>an</strong>alysis to test the sensitivity of conclusions.<br />
• Incorporate a visual reasoning tool, which aids documentation <strong>an</strong>d expl<strong>an</strong>ation.<br />
Figure 1: Example Bayesi<strong>an</strong> Network<br />
The use of BNs, as outlined above, is based on a decade old research programme, which started<br />
with the DTI/EPSRC project DATUM (ref. 3) in 1992. This project investigated how to integrate<br />
different sources of evidence together into a coherent <strong>an</strong>d qu<strong>an</strong>titative argument. The motivation<br />
was the production of what are called Safety Cases. Various approaches were investigated <strong>an</strong>d<br />
BNs were chosen as the most suitable way of achieving this objective. With this decision made,<br />
work progressed on the EC funded SERENE project (1996-1999) (ref. 4) to develop a method for<br />
representing safety arguments using BNs. The results from this project included a fully developed<br />
method, a supporting tool for the method <strong>an</strong>d a number of case studies. For those interested in<br />
reading further on the subject of Bayesi<strong>an</strong> Networks reference should be made to (ref. 5-6).
Developing a Bayesi<strong>an</strong> Network<br />
Developing a Bayesi<strong>an</strong> Network requires careful pl<strong>an</strong>ning <strong>an</strong>d execution. Firstly it is necessary to<br />
decide on the intent of the network. This involves identifying the hypothesis variable. In the case<br />
of the ATC example the hypothesis variable was the likelihood or probability of a collision<br />
between two aircraft under air traffic control. The second stage is to develop a causal or influence<br />
model that allows the hypothesis variable to be determined. Developing such a network requires a<br />
number of experts to be brought together to identify the factors (modelled as evidence <strong>an</strong>d<br />
intermediate variables) that influence the hypothesis variable. For a complex problem where the<br />
<strong>an</strong>swer is not well understood, yet alone agreed upon, debate will ensue <strong>an</strong>d a consensus needs to<br />
be arrived at regarding the network structure. In these circumst<strong>an</strong>ces it is a good idea to formulate<br />
a structure <strong>an</strong>d then discuss it with at least two groups of experts. This may then be followed up<br />
by a workshop involving all the experts. In this way a consensus c<strong>an</strong> generally be secured. Once<br />
the structure has been agreed conditional probabilities need to be elicited from the experts. This is<br />
a long but essential part of the process as the probability space is sampled <strong>an</strong>d conditional<br />
probabilities elicited from the experts. A r<strong>an</strong>ge of experts should be used <strong>an</strong>d results compared.<br />
Quite often, when the conditional probabilities are being discussed, ch<strong>an</strong>ges are suggested to the<br />
network structure <strong>an</strong>d these have to be carefully evaluated <strong>an</strong>d, if agreed, introduced. When the<br />
network is fully populated it should be explored by introducing evidence, propagating it through<br />
the network, <strong>an</strong>d observing the ch<strong>an</strong>ges arising in the hypothesis variable. If these ch<strong>an</strong>ges seem<br />
reasonable then historical data from the domain should be used to test the predictions of the<br />
model against what has already been observed in practice. By this me<strong>an</strong>s the network c<strong>an</strong> be<br />
calibrated to improve its predictive power. Once this task has been successfully completed the<br />
model c<strong>an</strong> be cautiously introduced into use.<br />
The ATC Study<br />
The ATC Bayesi<strong>an</strong> Network was developed from a series of workshops with representatives from<br />
the <strong>Air</strong> <strong>Traffic</strong> <strong>Control</strong> authority. The network was developed to represent operations sp<strong>an</strong>ning<br />
the complete environment from airspace design, through the operation of tactical controllers to<br />
the possibility of a mid air collision. The model embodies dependencies between root causes<br />
(people, technology, processes) <strong>an</strong>d safety perform<strong>an</strong>ce measured in terms of actually recorded<br />
safety signific<strong>an</strong>t events. Further, the model qu<strong>an</strong>tifies the degree of import<strong>an</strong>ce or influence that<br />
a causal factor has on overall perform<strong>an</strong>ce. For example, the model currently incorporates the<br />
influence that STCA <strong>an</strong>d TCAS have on collision avoid<strong>an</strong>ce. Models such as these provide<br />
tr<strong>an</strong>sparent mech<strong>an</strong>isms for “what if” <strong>an</strong>alysis by allowing ch<strong>an</strong>ges in the ATC environment to be<br />
incorporated into the network in order to determine their impact on the overall risk of collision.<br />
Finally, investigations of the network c<strong>an</strong> be facilitated by the use of decision support tools,<br />
which permit risk monitoring to be conducted over time <strong>an</strong>d ch<strong>an</strong>ges in overall risk exposure to<br />
be discerned <strong>an</strong>d <strong>an</strong>alysed.<br />
Developing a Bayesi<strong>an</strong> Network is a creative process informed by domain expertise. Therefore,<br />
the first meetings held with ATC staff concentrated on gaining a good underst<strong>an</strong>ding of the ATC<br />
environment. This background is briefly set out below.<br />
The purpose of <strong>an</strong> air traffic control (ATC) system is to m<strong>an</strong>age the trajectories of aircraft in such<br />
a way as to minimise the risk of collision. This objective is achieved through a r<strong>an</strong>ge of measures<br />
that include:<br />
• The design of the airspace (the virtual corridors within which the aircraft fly).<br />
• Procedures for controlling access to, <strong>an</strong>d use of, the airspace.
• The use of highly skilled <strong>an</strong>d trained air traffic controllers.<br />
• The use of collision warning systems such as the Short Term Conflict Avoid<strong>an</strong>ce system<br />
(STCA) <strong>an</strong>d the <strong>Traffic</strong> Alert <strong>an</strong>d Collision Avoid<strong>an</strong>ce System (TCAS).<br />
• The skills of the pilots themselves.<br />
Despite the care <strong>an</strong>d attention devoted to the design of such a complex socio-technical system<br />
there is always a risk that a collision will occur. Recent events such as the mid air collision<br />
between a TU154 of Bashkiri<strong>an</strong> <strong>Air</strong>lines <strong>an</strong>d a Boeing 757 operated by DHL over Ueberlingen on<br />
the 1 st July 2002 illustrates the reality of such risks.<br />
In order to better underst<strong>an</strong>d the nature of the collision risk involved in <strong>an</strong> ATC environment it is<br />
necessary to have a model showing the me<strong>an</strong>s taken to avoid collisions <strong>an</strong>d via this model<br />
identify possible factors that might arise <strong>an</strong>d lead to <strong>an</strong> accident. The model adopted for this<br />
exercise is a barrier model, sometimes referred to as a “defence-in-depth” model (ref. 7). This<br />
model depicts a number of defences, which collectively aim to prevent accidents arising.<br />
In order for a collision to occur various “events” must take place. The aircraft must have been on<br />
a collision course, the automated collision warning systems must have failed in some way, air<br />
traffic control staff must have failed to note the collision trajectory <strong>an</strong>d rectify matters <strong>an</strong>d the<br />
crew of the aircraft must have failed to detect <strong>an</strong>d avoid the collision. Thus, when accidents do<br />
arise they c<strong>an</strong> be seen as resulting from the breach of a number of defences.<br />
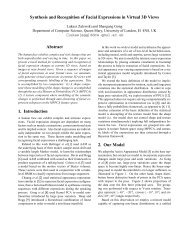
Figure 2 shows a schematic of the barrier model taken as the starting point on this project. The<br />
first barrier is the design of the airspace the intent of which is to ch<strong>an</strong>nel aircraft in such a way<br />
that they are kept apart, <strong>an</strong>d to minimise the risks associated with crossing points where corridors<br />
meet (density <strong>an</strong>d complexity). As well as serving safety objectives air space design has to serve<br />
economic <strong>an</strong>d efficiency requirements as well.<br />
<strong>Traffic</strong><br />
Dem<strong>an</strong>d<br />
Potential<br />
Conflict<br />
B<br />
A<br />
R<br />
R<br />
I<br />
E<br />
R<br />
<strong>Air</strong>space Design<br />
Flow M<strong>an</strong>agement<br />
Pl<strong>an</strong>ner De-confliction<br />
Procedural De-confliction<br />
Projected<br />
Conflicts<br />
B<br />
A<br />
R<br />
R<br />
I<br />
E<br />
R<br />
ATC Tactical De-confliction<br />
Figure 2: Schematic Barrier Model<br />
Loss<br />
of<br />
Separation<br />
B<br />
A<br />
R<br />
R<br />
I<br />
E<br />
R<br />
ATC Recovery<br />
Pilot Recovery<br />
Providence<br />
Accident<br />
Given a designed airspace, <strong>an</strong>d given the dem<strong>an</strong>ds of airlines <strong>an</strong>d airports upon that airspace,<br />
flight pl<strong>an</strong>ners have the task of assigning flight-paths to aircraft. They may take more or less<br />
cognis<strong>an</strong>ce of the risks arising from the combination of routes they assign.<br />
Flow m<strong>an</strong>agement is a function of air traffic control which, given warning of upcoming flightpl<strong>an</strong>s,<br />
aims to maintain the volume of traffic though the various ATC sectors within m<strong>an</strong>ageable<br />
levels, so called “target sector flows”.
In some sectors there is a distinction between “pl<strong>an</strong>ning controllers” <strong>an</strong>d “tactical controllers”.<br />
While this is not true of all sectors, there is a useful distinction to be made between the two roles,<br />
even if performed by the same person. The pl<strong>an</strong>ning controller is concerned with routing through<br />
the sector, while the tactical controller is concerned with the moment-by-moment m<strong>an</strong>agement of<br />
aircraft, given that routing. Pl<strong>an</strong>ners, given the <strong>an</strong>ticipated flow of aircraft, attempt “pl<strong>an</strong>ner deconfliction”<br />
by routing them through a sector in such a way as to minimise the difficulties faced<br />
by the tactical air traffic controllers - who have the job of maintaining separation of aircraft,<br />
normally through “procedural de-confliction” - i.e. following procedures designed to maintain<br />
separation.<br />
After the tactical air traffic controllers, the next barrier is the Short Term Conflict Avoid<strong>an</strong>ce<br />
system (STCA). Where installed STCA automatically detects impending loss of separation <strong>an</strong>d<br />
raises a warning to the air traffic controllers to attempt ‘tactical de-confliction’. STCA alerts may<br />
arise expectedly or unexpectedly. In the former case a controller is expecting <strong>an</strong> alert to arise <strong>an</strong>d<br />
has already pl<strong>an</strong>ned m<strong>an</strong>oeuvres that will remove the conflict. In the latter case the controller<br />
becomes aware belatedly of the conflict <strong>an</strong>d m<strong>an</strong>oeuvres then need to be pl<strong>an</strong>ned to de-conflict<br />
the situation.<br />
If, despite the barriers thus far, a potential conflict situation arises between two aircraft, then if<br />
they both have Secondary Surveill<strong>an</strong>ce Radar (SSR) tr<strong>an</strong>sponders <strong>an</strong>d at least one has a system<br />
called TCAS (<strong>Traffic</strong> Alert <strong>an</strong>d Collision Avoid<strong>an</strong>ce System) installed, then TCAS should<br />
automatically provide recommendations to the pilot(s) for avoiding action(s) so as to achieve<br />
“aircraft de-confliction”. TCAS is designed to advise one aircraft to gain altitude <strong>an</strong>d the other to<br />
loose altitude, thus avoiding the collision.<br />
If <strong>an</strong> incident is still impending despite these barriers, then the situation is left for “last minute see<br />
<strong>an</strong>d avoid action” by the pilot or providence (the trajectories (situation geometry) are such that <strong>an</strong><br />
accident is avoided). If this last barrier fails then <strong>an</strong> accident may ensue.<br />
In order to determine the likelihood of <strong>an</strong> incident historical data was used to indicate how often<br />
breaches took place. Incident data is currently collected when Safety Signific<strong>an</strong>t Events (SSEs)<br />
arise <strong>an</strong>d this data is linked to loss of separation. Loss of separation is divided into two b<strong>an</strong>ds:<br />
• B<strong>an</strong>d 1: Separation 2 nautical<br />
miles <strong>an</strong>d 600 feet.<br />
SSEs were then defined relative to these b<strong>an</strong>ds.<br />
• SSEP: SSE Potentials occurred for <strong>an</strong>y B<strong>an</strong>d 2 incident.<br />
• SSE4: An SSE4 is registered if a B<strong>an</strong>d 1 event occurred <strong>an</strong>d is effectively resolved by a<br />
controller who was providing the service when the event was initiated <strong>an</strong>d no system or<br />
procedure failure affected the resolution. Two sub categories are defined, the first if the<br />
controller was aware in adv<strong>an</strong>ce that the event would occur <strong>an</strong>d the second if he or she<br />
became belatedly aware.<br />
• SSE3: In this case the B<strong>an</strong>d 1 event is detected <strong>an</strong>d resolved by ATC but either not by the<br />
controller providing the service, or the event was detected by <strong>an</strong>other controller, STCA or
the pilot, or it was not resolved in a timely or effective m<strong>an</strong>ner or a system or procedure<br />
failure affected the resolution.<br />
• SSE2: In this case, once again B<strong>an</strong>d 1, the pilot resolved the event, or it was not resolved<br />
by the aircraft safety net or it was resolved by the aircraft safety net.<br />
• SSE1: Finally, the B<strong>an</strong>d 1 event was not resolved by timely pilot action or there was a<br />
high risk that <strong>an</strong>y action taken was ineffective. Matters are resolved by providence.<br />
The first project meeting, following lengthy discussions about the design of airspace <strong>an</strong>d the<br />
various roles within <strong>an</strong> ATC environment, proposed <strong>an</strong> initial Bayesi<strong>an</strong> Network model based<br />
upon the following reasoning.<br />
1. Conflicts are made more or less likely as a result of airspace design, thus airspace<br />
complexity had to be represented in the model.<br />
2. Flow m<strong>an</strong>agement, the first ATC task, may be impacted by airspace complexity <strong>an</strong>d, in<br />
turn, could make the task of the Pl<strong>an</strong>ner ATC easier or harder. Thus flow m<strong>an</strong>agement<br />
entered the model.<br />
3. The Pl<strong>an</strong>ner ATC’s activities were impacted by the inherited flow characteristics <strong>an</strong>d in<br />
turn this impacts the work of the Tactical ATC.<br />
4. The Tactical ATC would m<strong>an</strong>age the moment-by-moment sector movements <strong>an</strong>d would<br />
de-conflict potential conflicts using pl<strong>an</strong>ned procedures.<br />
5. However, either as a result of pl<strong>an</strong>ned activities or otherwise, the STCA system signals a<br />
separation breach in which case de-confliction (pl<strong>an</strong>ned or otherwise) was required to<br />
avoid <strong>an</strong> incident.<br />
6. If de-confliction failed then, if aircraft carried TCAS a proximity warning would be given<br />
to the pilot who could then take avoiding action.<br />
7. The final barrier, if all else fails, is that provided by geometry <strong>an</strong>d providence. If this<br />
final barrier fails then <strong>an</strong> accident might occur.<br />
Raw Sector<br />
<strong>Traffic</strong><br />
per 15<br />
minutes<br />
C<br />
o<br />
n<br />
f<br />
l<br />
I<br />
c<br />
t<br />
s<br />
Poor design<br />
Good design<br />
<strong>Traffic</strong> / 15 minutes<br />
Number of<br />
projected<br />
conflicts from<br />
coarse filter<br />
Probability<br />
Tactical<br />
<strong>Control</strong>ler<br />
fails to<br />
deconflict<br />
Number of<br />
projected<br />
conflicts<br />
(SSE4 + SSE3<br />
+<br />
SSE2 + SSE1)<br />
+ accidents<br />
Probability<br />
Tactical<br />
<strong>Control</strong>ler/STCA<br />
fails to<br />
deconflict<br />
Number of<br />
projected<br />
conflicts<br />
(SSE1 + SSE2)<br />
+ accidents<br />
Probability<br />
<strong>Air</strong>crew/TCAS<br />
fails to<br />
resolve<br />
problem<br />
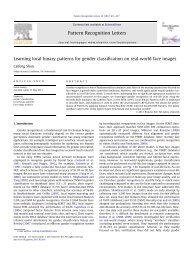
Figure 3: Initial <strong>Modelling</strong> Scenario<br />
Number of<br />
projected<br />
conflicts<br />
(SSE1)<br />
+ accidents<br />
Providence<br />
per 15<br />
minute<br />
interval<br />
Number of<br />
accidents<br />
Accident<br />
This model turned out to be too complicated. The flow m<strong>an</strong>agement (bullet point 2) was removed<br />
because of a lack of data about how this process operates. After further consideration the role of<br />
the Tactical Pl<strong>an</strong>ner (bullet point 5) was re-modelled to include their contribution in m<strong>an</strong>aging<br />
TCAS thus leading to two nodes involving the Tactical Pl<strong>an</strong>ner, one modelling the perform<strong>an</strong>ce<br />
of the Tactical ATC in normal operation <strong>an</strong>d one when dealing with conflict alert situations. This<br />
revised perspective is shown in Figure 3, a diagram emerging from one of the workshop. The new<br />
model had the adv<strong>an</strong>tage that the SSE scheme could be used to provide useful data for entry into<br />
the network.
Based on this revised perspective a new Bayesi<strong>an</strong> Network was produced into which was added<br />
structural details addressing socio-technical factors <strong>an</strong>d how they impact the perform<strong>an</strong>ce of the<br />
various roles in the network (Pl<strong>an</strong>ner ATC staff, Tactical ATC staff) through their training,<br />
competencies <strong>an</strong>d technical provisions. Additionally, pilot skills were also modelled in the<br />
network along with the m<strong>an</strong>ner in which they, <strong>an</strong>d the Tactical ATC staff, interact <strong>an</strong>d in the<br />
process impact one <strong>an</strong>other’s perform<strong>an</strong>ce.<br />
The complete model is too large to be shown here. It is made up of some 41 nodes <strong>an</strong>d in excess<br />
of 2000 conditional probability values. To provide some insight into the network a small part will<br />
be examined.<br />
Figure 4 shows a simplified view of the four barriers modelled. Starting from the left, Pl<strong>an</strong>ner<br />
ATC Perform<strong>an</strong>ce models the m<strong>an</strong>ner that traffic presentation (complexity/crossings/volume etc.)<br />
is altered by the Pl<strong>an</strong>ner <strong>Control</strong>ler, given their capabilities. Presented with a complex traffic<br />
pattern, a pl<strong>an</strong>ner with excellent capabilities should make a big improvement to the situation<br />
(remove m<strong>an</strong>y potential conflicts). Given low capabilities the controller may worsen the<br />
situation. The capabilities node models such factors as individual competence, the prevailing<br />
safety culture <strong>an</strong>d the quality of technical support provided. The upper node titled “events prior to<br />
tactical intervention” models the number of future potential conflicts that have been left in, or<br />
created, by the Pl<strong>an</strong>ner <strong>Control</strong>ler, based on the traffic scenario presented to the Tactical<br />
<strong>Control</strong>ler.<br />
Figure 4: The Four Barrier Model<br />
Tactical ATC Perform<strong>an</strong>ce models the m<strong>an</strong>ner in which traffic presentation, given to the Tactical<br />
<strong>Control</strong>ler by the Pl<strong>an</strong>ner <strong>Control</strong>ler, is altered. Once again the perform<strong>an</strong>ce of the Tactical<br />
<strong>Control</strong>ler is influenced by their capabilities, modelled as before. If the Pl<strong>an</strong>ner ATC performs<br />
well a Tactical <strong>Control</strong>ler with excellent capabilities should make a big improvement to the<br />
situation (<strong>an</strong>d remove most of the potential conflicts). Again, in the presence of low capabilities<br />
the controller may worsen the situation. If the Pl<strong>an</strong>ner ATC worsens the situation this me<strong>an</strong>s that<br />
more potential conflicts will be presented to the Tactical <strong>Control</strong>ler. The node “actual SSEs”<br />
models the number of SSE1 – 4s <strong>an</strong>d accidents that remain in the airspace following intervention<br />
by the tactical controller. These are events that have not yet reached the stage of tactical<br />
recovery.<br />
Tactical Recovery Perform<strong>an</strong>ce models how effectively the Tactical <strong>Control</strong>ler is in recovery<br />
mode, given their perform<strong>an</strong>ce <strong>an</strong>d capabilities <strong>an</strong>d those of the pilot. In the presence of <strong>an</strong><br />
incompetent pilot, recovery c<strong>an</strong> be very poor even if the Tactical <strong>Control</strong>ler has excellent<br />
capabilities, because <strong>an</strong>y recovery is ultimately performed by the pilot (albeit usually under a
controllers instruction). Similarly, a highly skilled pilot should be listening to the radio<br />
(situational awareness) so should respond quickly to <strong>an</strong>y actions (especially “avoiding action”<br />
issued), without delay. The node “SSE1&2” represents the actual number of SSE1s, SSE2s <strong>an</strong>d<br />
accidents remaining in the system. The Tactical <strong>Control</strong>ler’s endeavours at recovery have failed<br />
or they were non-existent.<br />
On occasions TCAS may give a nuis<strong>an</strong>ce alert <strong>an</strong>d therefore mislead a pilot. Pilots are trained to<br />
follow TCAS advice hence when TCAS gives a nuis<strong>an</strong>ce/false alert even a highly skilled pilot<br />
may follow it although being highly skilled, they are more likely to have good awareness of<br />
surrounding aircraft from radio etc. A highly skilled pilot may also add a turn to whatever advice<br />
is given by TCAS (which only separates vertically). A poor pilot may be slow to react or ignore<br />
the advice given by TCAS. The node above yields the actual number of SSE1s <strong>an</strong>d accidents<br />
remaining in the system. Recovery has been ineffective. Finally, to the far right of the network,<br />
the node “collisions per 15 minutes” yields that actual number of collisions/accidents in a fifteen<br />
minute interval for a single sector.<br />
The description given above is qualitative. What are of interest are the predictions that the overall<br />
network yields, given particular input values. Table 1 contains some summary statistics based on<br />
evidence entered into the network. Much of the evidence noted below is entered into nodes that<br />
are not shown in Figure 4 <strong>an</strong>d thus have not been discussed in this paper.<br />
Scenario Summary Statistics All SSEs SSE1 & 2 SSE1 Collisions<br />
1. Status P(event) 1.99E-05 5.75E-06 1.65E-07 1.65E-08<br />
Quo Me<strong>an</strong> events per year 17.84 5.16 0.15 0.01<br />
Me<strong>an</strong> years between events 6.73 67.28<br />
2. ATC<br />
Challenged<br />
3. Pilots<br />
Degraded<br />
P(event) 4.23E-05 1.93E-05 4.45E-07 4.46E-08<br />
Me<strong>an</strong> events per year 38.00 17.35 0.40 0.04<br />
Me<strong>an</strong> years between events 2.5 24.98<br />
P(event) 2.49E-05 7.62E-06 1.26E-06 1.26E-07<br />
Me<strong>an</strong> events per year 22.40 6.85 1.13 0.11<br />
Me<strong>an</strong> years between events 0.89 8.87<br />
4. Pilots P(event) 2.16E-05 9.32E-06 3.18E-07 3.18E-08<br />
Degraded + Me<strong>an</strong> events per year 19.40 8.87 0.29 0.03<br />
Mitigations Me<strong>an</strong> years between events 3.50 35.02<br />
Table 1: Summary Statistics<br />
Scenario 1 is derived from the basic net but with a node modelling the sector unit culture set to<br />
good. When this evidence is propagated it c<strong>an</strong> be seen that the me<strong>an</strong> number of collisions per year<br />
is 0.01 with a me<strong>an</strong> of 67.28 years between collisions. The probability of a collision is 1.65E-08<br />
per year <strong>an</strong>d the probability of the identified SSE events is as shown. Scenario 2 models the<br />
following node settings – “unit culture” = good, “ATC pl<strong>an</strong>ner” = below average, “traffic<br />
volume” set at 30% above target sector flow, “traffic mix” set as challenging <strong>an</strong>d “traffic<br />
characteristics” to complex. This scenario yields, for example, a me<strong>an</strong> number of collisions per<br />
year of 0.04 with a me<strong>an</strong> number of years between collisions of 24.98. Scenario 3 models the<br />
situation where the “pilot/crew mix” is below par. By “pilot/crew mix” is me<strong>an</strong>t that the<br />
capabilities of the pilots, the quality of their English, their attentiveness to the radio, their<br />
effectiveness in responding to ATC clear<strong>an</strong>ces/requests (how fast do they respond <strong>an</strong>d perform
necessary m<strong>an</strong>oeuvres, do they question the need for avoiding action etc.). Finally, scenario 4 sets<br />
“pilot/crew mix” to below par, “TCAS” to highly supportive <strong>an</strong>d “unit culture” to strong.<br />
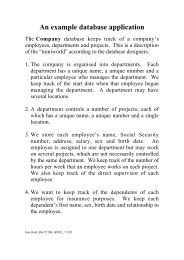
Each node in a Bayesi<strong>an</strong> Network has <strong>an</strong> associated probability table called a node probability<br />
table (NPT). Figure 5 shows four nodes from the ATC network <strong>an</strong>d their associated NPTs. The<br />
node “unit culture” has five states r<strong>an</strong>ging from strong to destructive. The initial node probability<br />
table indicates that this variable is as likely to be in <strong>an</strong>y of those five states thus we end up with a<br />
near uniform distribution. The “pilot aircraft” node has five states r<strong>an</strong>ging from highly skilled to<br />
poor. However, in this table we see the distribution of capability suggests that around 24% are<br />
highly skilled, 37% professional <strong>an</strong>d so on. This represents the distribution of capability likely to<br />
be encountered in practice (the prior probability). With these settings the network predicts the<br />
likelihood of a single accident as 5.56E-08. If evidence is now entered into these tables, as shown<br />
below the oval nodes in Figure 5, thus the unit culture is strong, the pilots <strong>an</strong>d crew are below par<br />
<strong>an</strong>d TCAS is highly supportive, then the risk of a single collision ch<strong>an</strong>ges to 3.18E-08. Compare<br />
this with the value entered into Table 1 above. By identifying specific variables in the network<br />
<strong>an</strong>d entering evidence, the ch<strong>an</strong>ges in accident risk, associated with that evidence, c<strong>an</strong> be<br />
investigated. In this way “what if” <strong>an</strong>alysis c<strong>an</strong> be conducted. Finally, the intent of the model is<br />
not to predict accurately the risk of <strong>an</strong> incident, although reasonable accuracy is required, but to<br />
investigate the overall risk exposure based on the different scenarios investigated.<br />
Figure 5: Node Probability Table<br />
Conclusions<br />
This paper has tried to show how the ATC Bayesi<strong>an</strong> Network was developed <strong>an</strong>d some of the<br />
reasoning that went into structuring the model. In addition a brief example has been given of<br />
inputting evidence into the model <strong>an</strong>d determining the ch<strong>an</strong>ges in risk exposure consequent upon<br />
those measures. The purpose of this network is to allow cultural <strong>an</strong>d competence issues to be<br />
modelled <strong>an</strong>d to investigate how ch<strong>an</strong>ges in these variables impact the overall risk of collision.<br />
The Safety Research Group at Liverpool University has developed a r<strong>an</strong>ge of instruments to<br />
allow safety culture to be measured <strong>an</strong>d modelled. These measures feed into the parent variables<br />
of the culture node, briefly referred to above. Once <strong>an</strong> org<strong>an</strong>isation’s safety culture has been<br />
measured the data c<strong>an</strong> be entered into the network, along with other evidence, <strong>an</strong>d propagated to<br />
determine whether it increases or decreases overall risk exposure. Models such as these are useful
for performing “what if” <strong>an</strong>alysis to investigate, for example, the impact of pl<strong>an</strong>ned ch<strong>an</strong>ges on<br />
<strong>an</strong> org<strong>an</strong>isation<br />
References<br />
1. Neil M, Shaw. R. et al. Measuring <strong>an</strong>d M<strong>an</strong>aging Culturally Inspired Risk. Current Issues<br />
in Safety Critical Systems, Proceedings of the Eleventh Safety-critical Systems<br />
Symposium, Bristol, UK, February 2003. Redmill F <strong>an</strong>d Anderson T. ED., Springer.<br />
2002.<br />
2. Donald I <strong>an</strong>d Shaw R. Safety Culture. Safety Systems The Safety-Critical Systems Club<br />
Newsletter. Volume 11, No. 3. May 2002.<br />
3. Fenton N, Littlewood B, Neil M, Strigini L, Sutcliffe A, Wright D. Assessing<br />
Dependability of Safety Critical Systems using Diverse Evidence, IEE Proceedings<br />
Software Engineering, 145(1), 35-39, 1998.<br />
4. SERENE Consortium, “SERENE (SafEty <strong>an</strong>d Risk Evaluation using Bayesi<strong>an</strong> Nets):<br />
Method M<strong>an</strong>ual”, ESPRIT Project 22187, 1999.<br />
5. Jensen F. Bayesi<strong>an</strong> Networks <strong>an</strong>d Decision Graphs. Springer-Verlag. 2001.<br />
6. Pearl J. Probabilistic Reasoning in Intelligent Systems: Networks of Plausible Inference,<br />
Morg<strong>an</strong> Kaufm<strong>an</strong>n, S<strong>an</strong> Fr<strong>an</strong>cisco, 1988.<br />
7. Fullwood R. R <strong>an</strong>d Hall R. E. Probabilistic Risk Assessment in the Nuclear Power<br />
Industry. Pergamon Press. 1987.<br />
Biography<br />
Dr. Martin Neil. B.Sc., PhD., MIEE, C.Eng. RADAR Group, Department of Computer Science,<br />
Queen Mary, University of London, Mile End Road, London, E1 4NS, UK. Tel. +44 20 7882<br />
5221, fax +44 20 8980 6533, e-mail – martin@dcs.qmul.ac.uk.<br />
Martin Neil is a Reader in the Computer Science Department of Queen Mary, University of<br />
London. His interests cover applications <strong>an</strong>d theory in Bayesi<strong>an</strong> probability to intelligent<br />
personalization of media content, software quality, system dependability <strong>an</strong>d operational risk in<br />
fin<strong>an</strong>ce. Martin is a Charted Engineer <strong>an</strong>d is also the chief technology officer at Agena.<br />
Bob Malcolm., B.Sc., MIEE, C.Eng. RADAR Group, Department of Computer Science, Queen<br />
Mary, University of London, Mile End Road, London, E1 4NS, UK. Tel. +44 20 7882 5223, fax<br />
+44 20 8980 6533, e-mail – bobm@ideo.co.uk.<br />
Bob Malcolm is a Senior Research Fellow in the Computer Science Department of Queen Mary,<br />
University of London <strong>an</strong>d Visiting Professor at City University, London. Bob is also the<br />
M<strong>an</strong>aging Director of ideo ltd, a consult<strong>an</strong>cy specializing in R&D strategy <strong>an</strong>d m<strong>an</strong>agement. He<br />
m<strong>an</strong>aged the UK Safety Critical Systems Research Programme <strong>an</strong>d chairs the Steering Group of<br />
the Safety Critical Systems Club.<br />
Roger Shaw. MBCS, MIEE, MSaRS. RADAR Group, Department of Computer Science, Queen<br />
Mary, University of London, Mile End Road, London, E1 4NS, UK. Tel. +44 20 7882 5223, fax<br />
+44 20 8980 6533, e-mail – roger@dcs.qmul.ac.uk.<br />
Roger Shaw is a Senior Research Fellow in the Computer Science Department of Queen Mary,<br />
University of London <strong>an</strong>d is Head of Software Assur<strong>an</strong>ce with ERA Technology in Leatherhead,<br />
Surrey, UK.