2 Seismic Wave Propagation and Earth models
2 Seismic Wave Propagation and Earth models
2 Seismic Wave Propagation and Earth models

You also want an ePaper? Increase the reach of your titles
YUMPU automatically turns print PDFs into web optimized ePapers that Google loves.
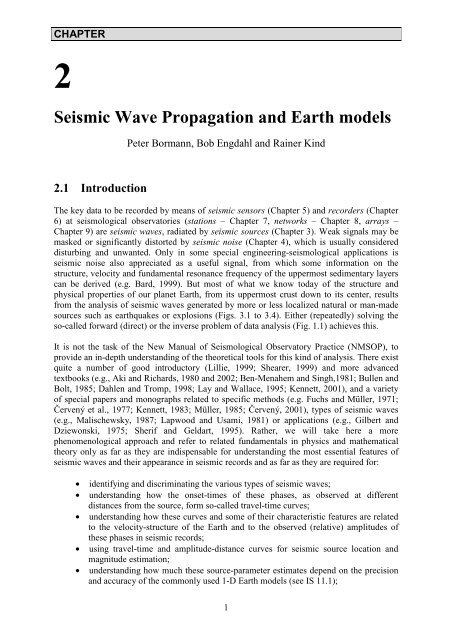
CHAPTER<br />
2<br />
<strong>Seismic</strong> <strong>Wave</strong> <strong>Propagation</strong> <strong>and</strong> <strong>Earth</strong> <strong>models</strong><br />
2.1 Introduction<br />
Peter Bormann, Bob Engdahl <strong>and</strong> Rainer Kind<br />
The key data to be recorded by means of seismic sensors (Chapter 5) <strong>and</strong> recorders (Chapter<br />
6) at seismological observatories (stations – Chapter 7, networks – Chapter 8, arrays –<br />
Chapter 9) are seismic waves, radiated by seismic sources (Chapter 3). Weak signals may be<br />
masked or significantly distorted by seismic noise (Chapter 4), which is usually considered<br />
disturbing <strong>and</strong> unwanted. Only in some special engineering-seismological applications is<br />
seismic noise also appreciated as a useful signal, from which some information on the<br />
structure, velocity <strong>and</strong> fundamental resonance frequency of the uppermost sedimentary layers<br />
can be derived (e.g. Bard, 1999). But most of what we know today of the structure <strong>and</strong><br />
physical properties of our planet <strong>Earth</strong>, from its uppermost crust down to its center, results<br />
from the analysis of seismic waves generated by more or less localized natural or man-made<br />
sources such as earthquakes or explosions (Figs. 3.1 to 3.4). Either (repeatedly) solving the<br />
so-called forward (direct) or the inverse problem of data analysis (Fig. 1.1) achieves this.<br />
It is not the task of the New Manual of Seismological Observatory Practice (NMSOP), to<br />
provide an in-depth underst<strong>and</strong>ing of the theoretical tools for this kind of analysis. There exist<br />
quite a number of good introductory (Lillie, 1999; Shearer, 1999) <strong>and</strong> more advanced<br />
textbooks (e.g., Aki <strong>and</strong> Richards, 1980 <strong>and</strong> 2002; Ben-Menahem <strong>and</strong> Singh,1981; Bullen <strong>and</strong><br />
Bolt, 1985; Dahlen <strong>and</strong> Tromp, 1998; Lay <strong>and</strong> Wallace, 1995; Kennett, 2001), <strong>and</strong> a variety<br />
of special papers <strong>and</strong> monographs related to specific methods (e.g. Fuchs <strong>and</strong> Müller, 1971;<br />
Červený et al., 1977; Kennett, 1983; Müller, 1985; Červený, 2001), types of seismic waves<br />
(e.g., Malischewsky, 1987; Lapwood <strong>and</strong> Usami, 1981) or applications (e.g., Gilbert <strong>and</strong><br />
Dziewonski, 1975; Sherif <strong>and</strong> Geldart, 1995). Rather, we will take here a more<br />
phenomenological approach <strong>and</strong> refer to related fundamentals in physics <strong>and</strong> mathematical<br />
theory only as far as they are indispensable for underst<strong>and</strong>ing the most essential features of<br />
seismic waves <strong>and</strong> their appearance in seismic records <strong>and</strong> as far as they are required for:<br />
• identifying <strong>and</strong> discriminating the various types of seismic waves;<br />
• underst<strong>and</strong>ing how the onset-times of these phases, as observed at different<br />
distances from the source, form so-called travel-time curves;<br />
• underst<strong>and</strong>ing how these curves <strong>and</strong> some of their characteristic features are related<br />
to the velocity-structure of the <strong>Earth</strong> <strong>and</strong> to the observed (relative) amplitudes of<br />
these phases in seismic records;<br />
• using travel-time <strong>and</strong> amplitude-distance curves for seismic source location <strong>and</strong><br />
magnitude estimation;<br />
• underst<strong>and</strong>ing how much these source-parameter estimates depend on the precision<br />
<strong>and</strong> accuracy of the commonly used 1-D <strong>Earth</strong> <strong>models</strong> (see IS 11.1);<br />
1
2. <strong>Seismic</strong> <strong>Wave</strong> <strong>Propagation</strong> <strong>and</strong> <strong>Earth</strong> <strong>models</strong><br />
• appreciating how these source parameter estimates can be improved by using more<br />
realistic (2-D, 3-D) <strong>Earth</strong> <strong>models</strong> as well as later (secondary) phase onsets in the<br />
processing routines; <strong>and</strong><br />
• being aware of the common assumptions <strong>and</strong> simplifications used in synthetic<br />
seismogram calculations that are increasingly used nowadays in seismological<br />
routine practice (see 2.5.4.4, 2.8, 3.5.3).<br />
2.2 Elastic moduli <strong>and</strong> body waves<br />
2.2.1 Elastic moduli<br />
<strong>Seismic</strong> waves are elastic waves. <strong>Earth</strong> material must behave elastically to transmit them. The<br />
degree of elasticity determines how well they are transmitted. By the pressure front exp<strong>and</strong>ing<br />
from an underground explosion, or by an earthquake shear rupture, the surrounding <strong>Earth</strong><br />
material is subjected to stress (compression, tension <strong>and</strong>/or shearing). As a consequence, it<br />
undergoes strain, i.e., it changes volume <strong>and</strong>/or distorts shape. In an inelastic (plastic, ductile)<br />
material this deformation remains while elastic behavior means that the material returns to its<br />
original volume <strong>and</strong> shape when the stress load is over.<br />
The degree of elasticity/plasticity of real <strong>Earth</strong> material depends mainly on the strain rate,<br />
i.e., on the length of time it takes to achieve a certain amount of distortion. At very low strain<br />
rates, such as movements in the order of mm or cm/year, it may behave ductilely. Examples<br />
are the formation of geologic folds or the slow plastic convective currents of the hot material<br />
in the <strong>Earth</strong>’s mantle with velocity on the order of several cm per year. On the other h<strong>and</strong>, the<br />
<strong>Earth</strong> reacts elastically to the small but rapid deformations caused by a transient seismic<br />
source pulse. Only for very large amplitude seismic deformations in soft soil (e.g., from<br />
earthquake strong-motions in the order of 40% or more of the gravity acceleration of the<br />
<strong>Earth</strong>) or for extremely long-period free-oscillation modes (see 2.4) does the inelastic<br />
behavior of seismic waves have to be taken into account.<br />
Within its elastic range the behavior of the <strong>Earth</strong> material can be described by Hooke’s Law<br />
that states that the amount of strain is linearly proportional to the amount of stress. Beyond its<br />
elastic limit the material may either respond with brittle fracturing (e.g., earthquake faulting,<br />
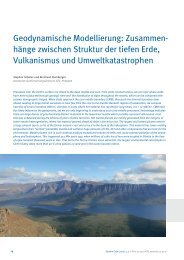
see Chapter 3) or ductile behavior/plastic flow (Fig. 2.1).<br />
Fig. 2.1 Schematic presentation of the relationship between stress <strong>and</strong> strain.<br />
2
3<br />
2.2 Elastic moduli <strong>and</strong> body waves<br />
Elastic material resists differently to stress depending on the type of deformation. It can be<br />
quantified by various elastic moduli:<br />
• the bulk modulus κ is defined as the ratio of the hydrostatic (homogeneous all-sides)<br />
pressure change to the resulting relative volume change, i.e., κ = ΔP / (ΔV/V),<br />
which is a measure of the incompressibility of the material (see Fig. 2.2 top);<br />
• the shear modulus μ (or “rigidity”) is a measure of the resistance of the material to<br />
shearing, i.e., to changing the shape <strong>and</strong> not the volume of the material. Its value is<br />
given by half of the ratio between the applied shear stress τxy (or tangential force ΔF<br />
divided by the area A over which the force is applied) <strong>and</strong> the resulting shear strain<br />
exy (or the shear displacement ΔL divided by the length L of the area acted upon by<br />
ΔF) , that is μ = τxy/2 exy or μ = (ΔF/A) / (ΔL/L) (Fig. 2.2 middle). For fluids μ = 0,<br />
<strong>and</strong> for material of very strong resistance (i.e. ΔL → 0) μ → ∞;<br />
• the Young’s modulus E (or “stretch modulus”) describes the behavior of a cylinder<br />
of length L that is pulled on both ends. Its value is given by the ratio between the<br />
extensional stress to the resulting extensional strain of the cylinder, i.e., E = (F/A) /<br />
(ΔL/L) (Fig. 2.2 bottom);<br />
• the Poisson’s ratio σ is the ratio between the lateral contraction (relative change of<br />
width W) of a cylinder being pulled on its ends to its relative longitudinal extension,<br />
i.e., σ = (ΔW/W) / (ΔL/L) (Fig. 2.2 bottom).<br />
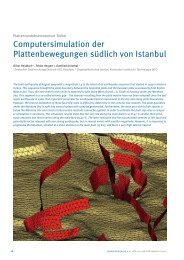
Fig. 2.2 Deformation of material samples for determining elastic moduli. Top: bulk modulus<br />
κ; middle: shear modulus μ; bottom: Young’s modulus E <strong>and</strong> Poisson’s ratio σ. a – original<br />
shape of the volume to be deformed; b – volume <strong>and</strong>/or shape after adding pressure ΔP to the<br />
volume V (top), shear force ΔF over the area A (middle) or stretching force F in the direction<br />
of the long axis of the bar (bottom).
2. <strong>Seismic</strong> <strong>Wave</strong> <strong>Propagation</strong> <strong>and</strong> <strong>Earth</strong> <strong>models</strong><br />
Young’s modulus, the bulk modulus <strong>and</strong> the shear modulus all have the same physical units<br />
as pressure <strong>and</strong> stress, namely (in international st<strong>and</strong>ard (SI) units):<br />
1 Pa = 1 N m -2 = 1 kg m -1 s -2 (with 1 N = 1 Newton = 1 kg m s -2 ). (2.1)<br />
2.2.2 Stress-strain relationship<br />
The most general linear relationship between stress <strong>and</strong> strain of an elastic medium is<br />
governed in the generalized Hook’s law (see Eqation (10) in the IS 3.1) by a fourth order<br />
parameter tensor. It contains 21 independent moduli. The properties of such a solid may vary<br />
with direction. Then the medium is called anisotropic. Otherwise, if the properties are the<br />
same in all directions, a medium is termed isotropic. Although in some parts of the <strong>Earth</strong>’s<br />
interior anisotropy on the order of a few percent exists, isotropy has proven to be a reasonable<br />
first-order approximation for the <strong>Earth</strong> as a whole. The most common <strong>models</strong>, on which data<br />
processing in routine observatory practice is based, assume isotropy <strong>and</strong> changes of properties<br />
only with depth.<br />
In the case of isotropy the number of independent parameters in the elastic tensor reduces to<br />
just two. They are called after the French physicist Lamé (1795-1870) the Lamé parameters λ<br />
<strong>and</strong> μ. The latter is identical with the shear modulus. λ does not have a straightforward<br />
physical explanation but it can be expressed in terms of the above mentioned elastic moduli<br />
<strong>and</strong> Poisson’s ratio, namely<br />
σ E<br />
λ = κ - 2μ /3 =<br />
. (2.2)<br />
( 1 + σ )( 1 − 2σ<br />
)<br />
The other elastic parameters can also be expressed as functions of μ, λ <strong>and</strong>/or κ:<br />
<strong>and</strong><br />
( 3λ<br />
+ 2μ)<br />
μ<br />
E =<br />
(2.3)<br />
( λ + μ)<br />
λ<br />
σ =<br />
2( λ + μ)<br />
3κ<br />
− 2μ<br />
= . (2.4)<br />
2(<br />
3κ<br />
+ μ)<br />
For a Poisson solid λ = μ <strong>and</strong> thus, according to (2.4), σ = 0.25. Most crustal rocks have a<br />
Poisson’s ratio between about 0.2 <strong>and</strong> 0.3. But σ may reach values of almost 0.5, e.g., for<br />
unconsolidated, water-saturated sediments, <strong>and</strong> even negative values of σ are possible (see<br />
Tab. 2.1).<br />
The elastic parameters govern the velocity with which seismic waves propagate. The equation<br />
of motion for a continuum can be written as<br />
∂<br />
2<br />
i ρ 2<br />
∂t<br />
u<br />
= ∂ jτ<br />
ij + f i , (2.5)<br />
4
5<br />
2.2 Elastic moduli <strong>and</strong> body waves<br />
with ρ - density of the material, ui – displacement, τij – stress tensor <strong>and</strong> fi – the body force<br />
term that generally consists of a gravity term <strong>and</strong> a source term. The gravity term is important<br />
at low frequencies in normal mode seismology (see 2.4), but it can be neglected for<br />
calculations of body- <strong>and</strong> surface-wave propagation at typically observed wavelengths.<br />
Solutions of Eq. (2.5) which predict the ground motion at locations some distance away from<br />
the source are called synthetic seismograms (see Figs. 2.54 <strong>and</strong> 2.55).<br />
In the case of an inhomogeneous medium, which involves gradients in the Lamé parameters,<br />
Eq. (2.5) takes a rather complicated form that is difficult to solve efficiently. Also, in case of<br />
strong inhomogeneities, transverse <strong>and</strong> longitudinal waves (see below) are not decoupled.<br />
This results in complicated particle motions. Therefore, most methods for synthetic<br />
seismogram computations ignore gradient terms of λ <strong>and</strong> μ in the equation of motion by<br />
modeling the material either as a series of homogeneous layers (which also allows to<br />
approximate gradient zones; see reflectivity method by Fuchs <strong>and</strong> Müller, 1971; Kennett,<br />
1983; Müller, 1985) or by assuming that variations in the Lamé parameters are negligible<br />
over a wavelength Λ <strong>and</strong> thus these terms tend to zero at high frequencies (ray theoretical<br />
approach; e.g., Červený et al., 1977; Červený, 2001). In homogeneous media <strong>and</strong> for small<br />
deformations the equation of motion for seismic waves outside the source region (i.e., without<br />
the source term fs <strong>and</strong> neglecting the gravity term fg) takes the following simple form:<br />
ρ ü = (λ + 2μ)∇∇⋅u - μ ∇×∇×u (2.6)<br />
where u is the displacement vector <strong>and</strong> ü its second time derivative. Eq. (2.6) provides the<br />
basis for most body-wave, synthetic seismogram calculations. Although it describes rather<br />
well most basic features in a seismic record we have to be aware that it is an approximation<br />
only for an isotropic homogeneous linearly elastic medium.<br />
2.2.3 P- <strong>and</strong> S-wave velocities, waveforms <strong>and</strong> polarization<br />
The first term on the right side of Eq. (2.6) contains the scalar product ∇⋅u = div u. It<br />
describes a volume change (compression <strong>and</strong> dilatation), which always contains some<br />
(rotation free!) shearing too, unless the medium is compressed hydrostatically (as in Fig. 2.2<br />
top). The second term is a vector product (rot u = ∇×u) corresponding to a curl (rotation) <strong>and</strong><br />
describes a change of shape without volume change (pure shearing). Generally, every vector<br />
field, such as the displacement field u, can be decomposed into a rotation-free (u r ) <strong>and</strong> a<br />
divergence-free (u d ) part, i.e., we can write u = u r + u d . Since the divergence of a curl <strong>and</strong> the<br />
rotation of a divergence are zero, we get accordingly two independent solutions for Eq. (2.6)<br />
when forming its scalar product ∇⋅u <strong>and</strong> vector product ∇×u, respectively:<br />
<strong>and</strong><br />
∂<br />
∂<br />
2<br />
2<br />
( ∇ ⋅u)<br />
λ + 2μ<br />
2 r<br />
= ∇ ( ∇ ⋅ u )<br />
2<br />
∂ t ρ<br />
(2.7)<br />
( ∇ × u)<br />
μ 2 d<br />
= ∇ ( ∇ × u ) . (2.8)<br />
2<br />
∂ t ρ
2. <strong>Seismic</strong> <strong>Wave</strong> <strong>Propagation</strong> <strong>and</strong> <strong>Earth</strong> <strong>models</strong><br />
Eqs. (2.7) <strong>and</strong> (2.8) are solutions of the wave equation for the propagation of two independent<br />
types of seismic body waves, namely longitudinal (compressional - dilatational) P waves <strong>and</strong><br />
transverse (shear) S waves. Their velocities are<br />
<strong>and</strong><br />
vp =<br />
λ + 2μ<br />
=<br />
ρ<br />
6<br />
κ + 4μ<br />
/ 3<br />
ρ<br />
(2.9)<br />
μ<br />
vs = . (2.10)<br />
ρ<br />
Accordingly, for a Poisson solid with λ = μ vp/vs = 3 . This comes close to the vp/vs ratio of<br />
consolidated sedimentary <strong>and</strong> igneous rocks in the <strong>Earth</strong>’s crust (see Tab. 2.1). Eqs. (2.9) <strong>and</strong><br />
2.10) also mean that P (primary) waves travel significantly faster than S (secondary) waves<br />
<strong>and</strong> thus arrive ahead of S in a seismic record (see Fig. 2.3). The Poisson’s ratio is often used<br />
as a measure of the vp/vs ratio, namely<br />
σ = (vp 2 /vs 2 – 2)/2(vp 2 /vs 2 – 1) (2.11)<br />
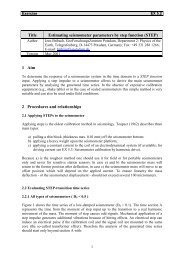
Fig. 2.3 The three components of ground-velocity proportional digital records of the P <strong>and</strong> S<br />
waves from a local event, an aftershock of the Killari-Latur earthquake, India (18.10.1993), at<br />
a hypocentral distance of about 5.3 km.<br />
Note the simple transient waveform (wavelet) of P in the Z-component of Fig. 2.3. The<br />
waveform <strong>and</strong> duration of the primary body wave is related to the shape <strong>and</strong> duration of the<br />
source-time function. It is for an earthquake shear rupture usually a more or less complex<br />
displacement step (see Figs. 2.4 <strong>and</strong> 3.4) which can be described by the moment-release<br />
function M(t) (see 3.5). In the far-field, i.e., at distances larger than the source dimension <strong>and</strong><br />
several wavelengths of the considered signal, the related displacement u(t) looks, in the<br />
idealized case, bell-shaped <strong>and</strong> identical with the moment-rate M (t)<br />
& (or velocity source-time)<br />
function (see Fig. 2.4 middle). The base-width of this far-field displacement source pulse u(t)<br />
corresponds to the duration of displacement at the source (for examples see Fig. 3.7).<br />
However, usually broadb<strong>and</strong> seismometers record ground velocity u& (t)<br />
instead of ground<br />
displacement. The recorded waveform then looks similar to the ones seen in Fig. 2.3 <strong>and</strong> Fig.
7<br />
2.2 Elastic moduli <strong>and</strong> body waves<br />
2.4 bottom. The period of the wavelet u& (t)<br />
corresponds to the duration of the displacement of<br />
the source, τs. This waveform of primary body waves will be slightly changed due to<br />
frequency-dependent attenuation <strong>and</strong> other wave-propagation effects, e.g., those that cause<br />
phase shifts. But the duration of the body-wave ground-motion wavelet (or wave-group) will<br />
remain essentially that of the source process, independent of the observational distance, unless<br />
it is significantly prolonged <strong>and</strong> distorted by narrowb<strong>and</strong> seismic recordings (see 4.2). We<br />
have made this point in order to better appreciate one of the principal differences in the<br />
appearance in seismic records of transient body waves on the one h<strong>and</strong> <strong>and</strong> of dispersed<br />
surface waves (see 2.3 <strong>and</strong>, e.g., Figs. 2.14 <strong>and</strong> 2.23) on the other h<strong>and</strong>.<br />
Fig. 2.4 Relationship between near-field displacement, far-field displacement <strong>and</strong> velocity<br />
from isotropic or double-couple source earthquake shear sources (modified from Shearer,<br />
Introduction to Seismology, 1999; with permission from Cambridge University Press).<br />
Tab. 2.1 gives some approximate average values for the elastic moduli κ an μ, the density ρ<br />
<strong>and</strong> the seismic velocities vp <strong>and</strong> vs for air, water, ice <strong>and</strong> some selected <strong>Earth</strong> materials. The<br />
following general conclusions can be drawn from it:<br />
- For the same material, shear waves travel always slower than compressional waves;<br />
- The higher the rigidity of the material, the higher the P- <strong>and</strong> S-wave velocities;<br />
- The rigidity usually increases with density ρ, but more rapidly than ρ. This explains<br />
why denser rocks have normally faster wave propagation velocities although v 2 ∼ 1/ρ ;<br />
- Fluids (liquids or gasses) have no shear strength (μ = 0) <strong>and</strong> thus do not propagate<br />
shear waves;<br />
- For the same material, compressional waves travel slower through its liquid state than<br />
through its solid state (e.g., water <strong>and</strong> ice, or, in the <strong>Earth</strong>’s core, through the liquid<br />
outer <strong>and</strong> solid inner iron core, respectively).<br />
<strong>Seismic</strong> energy is usually radiated from localized sources with linear dimensions much<br />
smaller than the distance of observation. Therefore, seismic “wavefronts” from such “point<br />
sources,” i.e., the surfaces along which the propagating waves are oscillating in phase, are<br />
generally curved <strong>and</strong> the “seismic rays,” perpendicular to the wavefronts, are oriented in the
2. <strong>Seismic</strong> <strong>Wave</strong> <strong>Propagation</strong> <strong>and</strong> <strong>Earth</strong> <strong>models</strong><br />
radial directions of wave propagation. However, when the distance is large enough, the<br />
curvature of the wavefronts becomes so small that we can approximate them locally (e.g.,<br />
within the aperture of a local seismic network or an array; see Chapters 8 <strong>and</strong> 9) by plane<br />
waves with parallel seismic rays.<br />
Tab. 2.1 Typical values (averages <strong>and</strong>/or approximate ranges) of elastic constants, density,<br />
Poisson's ratio <strong>and</strong> seismic wave velocities for some selected materials, unconsolidated<br />
sediments, sedimentary rocks of different geologic age <strong>and</strong> igneous/plutonic rocks. Values for<br />
granite relate to 200 MPa confining pressure, corresponding to about 8 km depth, for basalt to<br />
600 MPa (about 20 km depth), <strong>and</strong> for Peridotite, Dunite <strong>and</strong> Pyroxenite to1000 MPa (about<br />
30 km depth) (compiled from Hellwege, 1982; Lillie, 1999; <strong>and</strong> other sources).<br />
Material or<br />
Geologic<br />
Formation<br />
Bulk<br />
Modulus<br />
in 10 9 Pa<br />
Shear<br />
Modulus<br />
in 10 9 Pa<br />
Density<br />
in kg m -3<br />
8<br />
Poisson<br />
Ratio<br />
vp<br />
in km s -1<br />
vs<br />
in km s -1<br />
vp/vs<br />
Air 0.0001 0 1.0 0.5 0.32 0 ∞<br />
Water 2.2 0 1000 0.5 1.5 0 ∞<br />
Ice 3.0 4.9 920 -0.034 3.2 2.3 1.39<br />
Clastic sedi-<br />
(1.4-5.3)<br />
mentary rocks<br />
S<strong>and</strong>stone 24 17 2500 0.21 4.3 2.6 1.65<br />
Salt 24 18 2200 0.17 4.6<br />
(3.8-5.2)<br />
2.9 1.59<br />
Limestone 38 22 2700 0.19 4.7<br />
(2.9-5.6)<br />
2.9 1.62<br />
Granite 56 34 2610 0.25 6.2 3.6<br />
(47-69) (30-37) (2340-2670) (0.20-0.31) (5.8-6.4) (3.4-3.7)<br />
Basalt 71 38 2940 0.28 6.4 3.6<br />
(64-80) (33-41) (2850-3050) (0.26-0.29) (6.1-6.7) (3.4-3.7)<br />
Peridotite, 128 63 3300 0.29 8.0 4.4<br />
Dunit,<br />
Pyroxenite<br />
(113-141) (52–72) (3190-3365) (0.26-0.29) (7.5–8.4) (4.0–4.7)<br />
Metamorphic&<br />
igneous rocks<br />
(3.8-6.4)<br />
Ultramafic<br />
rocks<br />
(7.2-8.7)<br />
Cenozoic 1500-2100 0.38-
9<br />
2.2 Elastic moduli <strong>and</strong> body waves<br />
(longitudinal polarization) but that of the S wave is perpendicular (transverse) to it, in the<br />
given case oscillating up <strong>and</strong> down in the vertical plane (SV-wave). However, S waves may<br />
also oscillate purely in the horizontal plane (SH waves) or at any angle between vertical <strong>and</strong><br />
horizontal, depending on the source mechanism (Chapter 3), the wave propagation history,<br />
<strong>and</strong> the incidence angle io at the seismic station (see Fig. 2.27).<br />
Fig. 2.5 Displacements from a harmonic plane P wave (top) <strong>and</strong> SV wave (bottom)<br />
propagating in a homogeneous isotropic medium. Λ is the wavelength. 2A means double<br />
amplitude. The white surface on the right is a segment of the propagating plane wavefront<br />
where all particles undergo the same motion at a given instant in time, i.e., they oscillate in<br />
phase. The arrows indicate the seismic rays, defined as the normal to the wavefront, which<br />
points in the direction of propagation (modified according to Shearer, Introduction to<br />
Seismology, 1999; with permission from Cambridge University Press).<br />
The wavelength Λ is defined by the distance (in km) between neighboring wave peaks or<br />
troughs or volumes of maximum compression or dilatation (see Fig. 2.5). The wave period T<br />
is the duration of one oscillation (in s) <strong>and</strong> the frequency f is the number of oscillations per<br />
second (unit [Hz] = [s -1 ]). The wavelength is the product of wave velocity v <strong>and</strong> period T<br />
while the wavenumber is the ratio 2π/Λ. Tab. 2.2 summarizes all these various harmonic<br />
wave parameters <strong>and</strong> their mutual relationship.<br />
Tab. 2.2 Harmonic wave parameters <strong>and</strong> their mutual relationship.<br />
Name Symbol Relationships<br />
Period T T = 1/f = 2π/ω = Λ/v<br />
Frequency f f = 1/T = ω/2π = v/Λ<br />
Angular frequency ω ω = 2πf = 2π/T = v⋅k<br />
Velocity v v = Λ/T = f⋅Λ = ω/k<br />
<strong>Wave</strong>length Λ Λ = v/f = v⋅T = 2π/k<br />
<strong>Wave</strong>number k k = ω/v = 2π/Λ = 2πf/v<br />
In any case, the polarization of both P <strong>and</strong> S waves, when propagating in a homogenous <strong>and</strong><br />
isotropic medium, is linear. This is confirmed rather well by particle motion analysis of real<br />
seismic recordings, if they are broadb<strong>and</strong> (or long period). But higher frequencies, which are<br />
more strongly affected by local inhomogeneities in the <strong>Earth</strong>, show a more elliptical or<br />
irregular particle motion. Fig. 2.6 shows an example. While the rectilinearity of P is almost 1
2. <strong>Seismic</strong> <strong>Wave</strong> <strong>Propagation</strong> <strong>and</strong> <strong>Earth</strong> <strong>models</strong><br />
(0.95) in the BB record it is significantly less (0.82 as an average over 5 oscillations <strong>and</strong> down<br />
to 0.68 for some single oscillations) for the short-period filtered record.<br />
Fig. 2.6 3-component records at station MOX (top traces) <strong>and</strong> related plots of particle motion<br />
in the horizontal (N-E) plane <strong>and</strong> two vertical planes (Z-N <strong>and</strong> Z-E, respectively) of the Pwave<br />
onset from a local seismic event (mining collapse) in Germany (13.03.1989; Ml = 5.5;<br />
epicentral distance D = 112 km, backazimuth BAZ = 273°). Upper part: broadb<strong>and</strong> recording<br />
(0.1-5 Hz); lower part: filtered short-period recording (1- 5 Hz). Note: The incidence angle is<br />
59.5° for the long-period P-wave oscillation <strong>and</strong> 47.3° for the high-frequency P-wave group.<br />
10
11<br />
2.3 Surface waves<br />
S waves are also linearly polarized when propagating in homogeneous isotropic medium.<br />
However, in the presence of anisotropy, they split into a fast <strong>and</strong> slow component. These split<br />
waves propagate with different velocity that causes some time delay <strong>and</strong> related phase shift.<br />
Accordingly, the two split S-wave components superimpose to an elliptical polarization (Fig.<br />
2.7). The orientation of the main axis <strong>and</strong> the degree of ellipticity are controlled by the fast<br />
<strong>and</strong> slow velocity directions of the medium with respect to the direction of wave propagation<br />
<strong>and</strong> the degree of anisotropy. Therefore, shear-wave splitting is often used to study S-wave<br />
velocity anisotropy in the <strong>Earth</strong>.<br />
Fig. 2.7 Examples of SKS <strong>and</strong> SKKS recordings <strong>and</strong> plots of particle motion at three stations<br />
of the German Regional Seismograph Network. The horizontal radial (R) <strong>and</strong> transverse (T)<br />
components are shown. They were derived by rotation of the N-S <strong>and</strong> E-W horizontal<br />
components with the backazimuth angle. The T component at BFO has the same scale as the<br />
R component, while T is magnified two-fold relative to R at BRG <strong>and</strong> MOX. The top panels<br />
show the polarization in the R-T plane. Anisotropy is manifested in all three cases by the<br />
elliptical polarization. Linear polarization is obtained by correcting the R-T seismograms for<br />
the anisotropy effect using an anisotropy model where the direction of the fast shear wave is<br />
sub-horizontal <strong>and</strong> given by the angle Φ measured clockwise from north, <strong>and</strong> the delay time<br />
(in seconds) between the slow <strong>and</strong> the fast shear wave is given by δt (courtesy of G. Bock).<br />
2.3 Surface waves<br />
2.3.1 Origin<br />
So far we have considered only body-wave solutions of the seismic wave equation. They exist<br />
in the elastic full space. However, in the presence of a free surface, as in the case of the <strong>Earth</strong>,<br />
other solutions are possible. They are called surface waves. There exist two types of surface<br />
waves, Love waves <strong>and</strong> Rayleigh waves. While Rayleigh (LR or R) waves exist at any free<br />
surface, Love (LQ or G) waves require some kind of a wave guide formed by a velocity<br />
increase with depth (gradient- or layer-wise). Both conditions are fulfilled in the real <strong>Earth</strong>.<br />
SH waves are totally reflected at the free surface. Love waves are formed through<br />
constructive interference of repeated reflections of teleseismic SH at the free-surface (i.e., S3,<br />
S4, S5, etc.; see Fig. 2.42 <strong>and</strong> overlay to Figs. 2.48 <strong>and</strong> 2.49). They can also result from<br />
constructive interference between SH waves, which are postcritically reflected (see 2.5.3.5)<br />
within a homogeneous layer (or a set of i layers with increasing vsi) overlaying a half-space
2. <strong>Seismic</strong> <strong>Wave</strong> <strong>Propagation</strong> <strong>and</strong> <strong>Earth</strong> <strong>models</strong><br />
with higher velocity. The latter is the case of crustal layers, overlaying the upper mantle with<br />
a significant velocity increase at the base of the crust, called the “Mohorovičić-discontinuity”<br />
or Moho for short. The Moho marks the transition between the usually more mafic (often<br />
termed “basaltic”) lower crust <strong>and</strong> the peridotitic uppermost mantle (for related velocities see<br />
Tab. 2.1) <strong>and</strong> may, together with other pronounced intra-crustal velocity discontinuities give<br />
rise to the formation of complex guided crustal waves (see 2.3.3).<br />
Generally, destructive interference of the upgoing <strong>and</strong> downgoing reflected SH waves will<br />
occur, except at certain discrete frequencies ω <strong>and</strong> n multiples of it (with n as an integer). The<br />
values of ω given for n = 0 are termed the fundamental modes while larger values of n define<br />
the higher modes or overtones. Fig. 2.8 (top) shows the horizontal (SH type) of displacement<br />
<strong>and</strong> linear polarization of the fundamental Love-wave mode as well as the exponential decay<br />
of its amplitudes with depth.<br />
When a P (or SV) wave arrives at the surface the reflected wave energy contains (because of<br />
mode conversion, see 2.5.3.4) both P <strong>and</strong> SV waves. Lord Rayleigh showed more than 100<br />
years ago that in this case a solution of the wave equation exists for two coupled<br />
inhomogeneous P <strong>and</strong> SV waves that propagate along the surface of a half-space. While<br />
Rayleigh waves show no dispersion in a homogeneous half-space, they are always dispersed<br />
in media with layering <strong>and</strong>/or velocity gradients such as in the real <strong>Earth</strong>. Rayleigh waves<br />
travel - for a Poisson solid - with a phase velocity c = 2 − 2 / 3 vs ≈ 0.92 vs, i.e., they are<br />
slightly slower than Love waves. Therefore, they appear somewhat later in seismic records.<br />
The exact value of c depends on vp <strong>and</strong> vs. Since Rayleigh waves originate from coupled P<br />
<strong>and</strong> SV waves they are polarized in the vertical (SV) plane of propagation <strong>and</strong> due to the<br />
phase shift between P <strong>and</strong> SV the sense of their particle motion at the surface is elliptical <strong>and</strong><br />
retrograde (counter clockwise). Fig. 2.8 (bottom) shows schematically the displacements for<br />
the fundamental mode of Rayleigh waves. They also decay exponentially with depth. The<br />
short-period fundamental mode of Rayleigh type in continental areas is termed Rg.<br />
Fig. 2.8 Displacements caused by horizontally propagating fundamental Love (top) <strong>and</strong><br />
Rayleigh waves (bottom). In both cases the wave amplitudes decay strongly with depth (from<br />
Shearer, Introduction to Seismology, 1999; with permission from Cambridge University<br />
Press).<br />
12
2.3.2 Dispersion <strong>and</strong> polarization<br />
13<br />
2.3 Surface waves<br />
The penetration depth below the surface increases with Λ. This is comparable with the<br />
frequency-dependent skin effect of electromagnetic waves propagating in a conducting<br />
medium with a free surface. Since the types of rocks, their rigidity <strong>and</strong> bulk modulus change<br />
(usually increase) with depth, the velocities of surface waves change accordingly since the<br />
longer waves “sense” deeper parts of the <strong>Earth</strong>. This results in a frequency dependence of<br />
their horizontal propagation velocity, called dispersion. Accordingly, while body-wave<br />
arrivals with no or negligibly small dispersion only (due to intrinsic attenuation) appear in<br />
seismic records as rather impulsive onsets or short transient wavelets (with the shape <strong>and</strong><br />
duration depending on the b<strong>and</strong>width of the seismograph; see Chapter 4.2), the dispersion of<br />
surface waves forms long oscillating wave trains. Their duration increases with distance.<br />
Usually, the more long-period surface waves arrive first (normal dispersion). But in some<br />
regions of the <strong>Earth</strong> low-velocity layers exist (e.g., the asthenosphere in the upper mantle; see<br />
the PREM model in 2.7, Fig. 2.53, in the depth range between about 80 <strong>and</strong> 220 km). This<br />
general trend may then be reversed for parts of the surface wave spectrum. Presentations of<br />
the propagation velocity of surface waves as a function of the period T or the frequency f are<br />
called dispersion curves. They differ for Love <strong>and</strong> Rayleigh waves <strong>and</strong> also depend on the<br />
velocity-depth structure of the <strong>Earth</strong> along the considered segment of the travel path (Fig.<br />
2.9). Thus, from the inversion of surface wave dispersion data, information on the shear-wave<br />
velocity structure of the crust, <strong>and</strong>, when using periods up to about 500 s (mantle surface<br />
waves), even of the upper mantle <strong>and</strong> transition zone can be derived.<br />
Fig. 2.9 Group-velocity dispersion curves as a function of period for Love <strong>and</strong> Rayleigh<br />
waves (fundamental modes <strong>and</strong> overtones) (from Bullen <strong>and</strong> Bolt, An Introduction to the<br />
Theory of Seismology, 1985; with permission from Cambridge University Press).<br />
The large differences in crustal thickness, composition <strong>and</strong> velocities between oceanic <strong>and</strong><br />
continental areas (Fig. 2.10) result in significant differences between their related average<br />
group-velocity dispersion curves (Fig. 2.9). They are particularly pronounced for Rayleigh
2. <strong>Seismic</strong> <strong>Wave</strong> <strong>Propagation</strong> <strong>and</strong> <strong>Earth</strong> <strong>models</strong><br />
waves. While the velocities for continental Rayleigh waves vary in the period range from<br />
about 15 <strong>and</strong> 30 s only from 2.9 to 3.3 km/s, they vary much more in oceanic areas (from<br />
about 1.5 to 4.0 km/s within the same period range. Consequently, LR wave trains from travel<br />
paths over continental areas are shorter <strong>and</strong> look more clearly dispersed because the various<br />
periods follow each other at shorter time differences (e.g., Figures 1d <strong>and</strong> 5a in DS 11.2). In<br />
contrast, LR wave trains with dominatingly oceanic travel paths are much longer with almost<br />
monochromatic oscillations over many minutes (Fig. 2.11). Actually, the discovery of<br />
different surface-wave velocities along continental <strong>and</strong> oceanic paths were in the 1920s the<br />
first indication of the principle structural difference between oceanic <strong>and</strong> continental crust.<br />
Fig. 2.10 Cross-section through the crust along 40° northern latitude. Note the different<br />
signatures for the upper (granitic), intermediate (dioritic) <strong>and</strong> lower (mafic) continental crust<br />
<strong>and</strong> the basaltic oceanic crust. The crustal base is termed “Moho” (according to its discoverer,<br />
the Croatian seismologist Andrija Mohorovičić). The P-wave velocity increases at the Moho<br />
from about 6.5-6.8 km/s to 7.8-8.2 km/s. The continental crust is about 25 to 45 km thick<br />
(average about 35 km) <strong>and</strong> has “roots” under young high mountain ranges which may reach<br />
down to nearly 70 km. The oceanic crust is rather thin (about 8 to 12 km) with a negligible<br />
upper crust (courtesy of Mooney <strong>and</strong> Detweiler, 2002).<br />
Fig. 2.11 Record of Rayleigh waves in the long-period vertical component at the station<br />
Toledo, Spain, from an earthquake in the Dominican Republic (D = 6,622 km; travel-path<br />
through the Atlantic Ocean) (courtesy of G. Payo, 1986).<br />
14
15<br />
2.3 Surface waves<br />
Strictly speaking, when dealing with dispersive waves, one has to discriminate between the<br />
group velocity U(T), with which the energy of the wave group moves <strong>and</strong> the phase velocity<br />
c(T), with which the wave peaks <strong>and</strong> troughs at a given frequency travel along the surface. As<br />
seen from Fig. 2.12, c(T) is always larger than U(T). When comparing Figs. 2.9 <strong>and</strong> 2.12 the<br />
significant differences between dispersion curves calculated for a global 1-D <strong>Earth</strong> model like<br />
PREM (see 2.7, Fig. 2.53 <strong>and</strong> DS 2.1) <strong>and</strong> averaged measured curves for different types of<br />
crust or mantle <strong>models</strong> become obvious.<br />
Fig. 2.12 Fundamental mode Love- <strong>and</strong> Rayleigh-wave dispersion curves computed for the<br />
PREM model with anisotropy (courtesy of Gabi Laske).<br />
As shown in Fig. 2.13, the horizontal component of the fundamental Rayleigh wave mode<br />
will vanish in a uniform half-space at a depth of about Λ/5 <strong>and</strong> thus the particle motion<br />
becomes vertical linear. At larger depth the particle trajectories will be elliptical again, but<br />
with a prograde (clockwise) sense of motion. The amplitudes decay rapidly with depth. At a<br />
depth of Λ/2, the horizontal particle motion is about 10% of that at the surface while the<br />
vertical particle motion at the surface is reduced to about 30%.<br />
Because of the strong decay of surface wave amplitudes with depth, earthquakes deeper than<br />
the recorded wavelengths will produce significantly reduced or no surface waves. The<br />
amplitude ratio between body <strong>and</strong> surface waves in broadb<strong>and</strong> records is thus a reliable quick<br />
discriminator between shallow <strong>and</strong> deep earthquakes. For shallow teleseismic earthquakes the<br />
surface wave group has generally by far the largest amplitudes in broadb<strong>and</strong> <strong>and</strong> long-period<br />
records (see Fig. 2.23). This is because of their 2-D propagation along the surface of the <strong>Earth</strong><br />
<strong>and</strong> energy decay ∼ 1/r as compared to the 3-D propagation of body-waves <strong>and</strong> energy decay<br />
∼ 1/r 2 . Also, the local maxima <strong>and</strong> minima in the group-velocity curves (Figs. 2.9 <strong>and</strong> 2.12)<br />
imply that surface wave energy in a wider period range around these extremes will travel with<br />
nearly the same velocity <strong>and</strong> arrive at a seismic station at about the same time, thus<br />
superimposing to large amplitudes. These amplitude maxima in the dispersive surface wave<br />
train are called Airy phases. For continental travel paths a pronounced Rayleigh wave Airy<br />
phase with periods around 20 s occurs which is rather stable <strong>and</strong> used for estimating the<br />
st<strong>and</strong>ard surface wave magnitude Ms (see 3.2.5.1). An example is given in Fig. 2.23. Longperiod<br />
mantle Rayleigh waves have an Airy phase around T ≈ 220 s (see Fig. 2.9).
2. <strong>Seismic</strong> <strong>Wave</strong> <strong>Propagation</strong> <strong>and</strong> <strong>Earth</strong> <strong>models</strong><br />
Fig. 2.13 Particle motion for the fundamental Rayleigh mode in a uniform half-space. Shown<br />
is one horizontal wavelength. At the surface the vertical motion is about 1.5 times larger than<br />
the horizontal motion. Note the change from retrograde to prograde sense of elliptical particle<br />
motion at a depth larger about Λ/5. The wave propagates from left to right. The dots show the<br />
position of the same particle at a fixed distance with time increasing from the right to the left<br />
(modified from Shearer, Introduction into Seismology, 1999; with permission from<br />
Cambridge University Press).<br />
Fig. 2.14 3-component broadb<strong>and</strong> records (top traces) <strong>and</strong> related plots of particle motion in<br />
the horizontal (N-E) plane <strong>and</strong> two vertical planes (Z-N <strong>and</strong> Z-E, respectively) of the surfacewave<br />
group of the same event as in Fig. 2.6 (D = 112 km; backazimuth BAZ = 273°).<br />
Fig. 2.14 above shows, for the event in Fig. 2.6, the 3-component broadb<strong>and</strong> record of the<br />
Rayleigh-wave group <strong>and</strong> the related particle motion trajectories in three perpendicular<br />
planes. There exists indeed a strikingly clear retrograde elliptical motion in the vertical-east<br />
16
17<br />
2.3 Surface waves<br />
(Z-E) plane, which is in this case almost identical with the vertical plane of wave propagation<br />
(backazimuth 273°). Also the amplitude ratio vertical/horizontal component is 1.5, as<br />
theoretically expected. In the horizontal N-E plane, however, there is also some transverse<br />
energy present in this wave group. It is due to some SH energy present in the N-S component.<br />
Generally, one should be aware that the theoretically expected complete separation of LQ <strong>and</strong><br />
LR waves in a homogeneous isotropic (horizontally layered) half-space is not absolutely true<br />
in the real <strong>Earth</strong> because of heterogeneity <strong>and</strong> anisotropy. This may cause the coupling of<br />
some Rayleigh-wave energy into Love waves <strong>and</strong> vice versa (see e.g., Malischewsky (1987)<br />
<strong>and</strong> Meier et al. (1997)), similar to S-wave splitting in the presence of anisotropy (see Fig.<br />
2.7).<br />
Higher mode surface waves have a different depth dependence than fundamental modes <strong>and</strong><br />
sample deeper structure than that probed by fundamental modes of the same period.<br />
2.3.3 Crustal surface waves <strong>and</strong> guided waves<br />
Because of the broad maximum of the group velocity of Love-wave continental overtones<br />
with values around 3.5 km/s between about 3 <strong>and</strong> 10 s (see Fig. 2.9) they may appear in<br />
seismic records as an onset-like Lg-wave group with almost no dispersion, sometimes even in<br />
pairs (Lg1, Lg2) because of the nearby local minimum in the dispersion curve. Since the<br />
group velocity of Lg-waves is higher than that of continental fundamental modes with T < 30<br />
s (see Fig. 2.9), they may appear in broadb<strong>and</strong> records with an upper corner period around 20<br />
s as clear forerunners to the surface wave group. The Lg-wave group, however, is not a pure<br />
continental Love wave but rather a complex guided crustal wave. It is caused by<br />
superposition of multiple S-wave reverberations between the surface <strong>and</strong> the Moho <strong>and</strong> SV to<br />
P <strong>and</strong>/or P to SV conversions as well as by scattering of these waves at lateral heterogeneities<br />
in the crust. Accordingly, Lg waves are also recorded on vertical components (see Fig. 2.15).<br />
Beyond epicentral distances of about 3° their amplitude maximum is usually well-separated<br />
from the earlier onset of Sg. Lg usually dominates seismic records of local <strong>and</strong> regional<br />
events <strong>and</strong> may propagate rather effectively along continental paths, in shield regions in<br />
particular, over a few thous<strong>and</strong> kilometers (see Fig. 2.15). Because of the stability of Lg<br />
amplitude-distance relationships in continental areas this phase is well suited for reliable<br />
magnitude estimates of regional events (see 3.2.6.6). The propagation of Lg may be barred by<br />
lateral changes in the velocity structure such as sedimentary basins, Moho topography, the<br />
transition between oceanic <strong>and</strong> continental crust or the boundaries between different tectonic<br />
units.<br />
Near-surface seismic events such as industrial or underground nuclear explosions, rock-bursts<br />
etc. also generate short-period fundamental-mode Rayleigh waves, termed Rg. Rg waves<br />
show normal dispersion <strong>and</strong> have relatively large amplitudes on vertical components (see Fig.<br />
2.16.). They are not excited by seismic events deeper than about one wavelength <strong>and</strong> thus a<br />
good discriminator between often man-made seismic sources near the surface <strong>and</strong> most<br />
natural earthquakes with depths most likely between 5 <strong>and</strong> 25 km (crustal earthquakes) or<br />
even deeper (intermediate or deep earthquakes in subduction zones). Rg is more strongly<br />
attenuated than the guided wave Lg. Its range of propagation is limited to less than about 600<br />
km. However, up to about 200 km distance Rg may dominate the recorded wave train from<br />
local near-surface seismic events.
2. <strong>Seismic</strong> <strong>Wave</strong> <strong>Propagation</strong> <strong>and</strong> <strong>Earth</strong> <strong>models</strong><br />
Fig. 2.15 Records of Lg, together with other crustal phases, in records of a Kola peninsula<br />
mining blast (Ml = 2.4) at the Norwegian array stations ARCES (distance D = 391 km; upper<br />
two traces) <strong>and</strong> NORES (D = 1309 km, bottom traces). cb <strong>and</strong> sb – P- <strong>and</strong> S-wave beams (see<br />
Chapter 9) of the vertical elements of the array, filtered with 2-8 Hz <strong>and</strong> 1-4 Hz, respectively<br />
(courtesy of J. Schweitzer).<br />
Fig. 2.16 Mining induced rock burst south of Saarbrücken, Germany, recorded at station<br />
WLF in Luxemburg (D = 80 km, h = 1 km, Ml = 3.7). Note the strong dispersive Rg phase.<br />
18
2.3.4 Mantle surface waves<br />
19<br />
2.3 Surface waves<br />
Love <strong>and</strong> Rayleigh waves travel along great circle paths around the globe. Surface waves<br />
from strong earthquakes may travel several times around the <strong>Earth</strong>. They are termed global<br />
surface waves. The first surface wave group arriving at a seismic station at the epicentral<br />
distance Δ° will have taken the shorter great circle while the later arrival has traveled the<br />
major arc path over 360° - Δ° (Fig. 2.17).<br />
Fig. 2.17 Great circle paths for the first three arrivals of global Rayleigh waves.<br />
These arrival groups are called R1, R2, R3, R4 etc. for Rayleigh waves <strong>and</strong> G1, G2, G3, G4<br />
etc. for Love waves, respectively. R3 (or G3) have traveled over 360° + Δ° <strong>and</strong> R4 over 720°-<br />
Δ° etc. Fig. 2.18 gives an example for long-period records of P, SV, SH, R1, R2, G1 <strong>and</strong> G2<br />
in the vertical (Z) <strong>and</strong> the two rotated horizontal components (radial R <strong>and</strong> transverse T). As<br />
expected, P appears only on Z <strong>and</strong> R while S has both SV <strong>and</strong> SH energy. The Love wave<br />
groups G1 <strong>and</strong> G2 are strongest in T <strong>and</strong> arrive ahead of R1 in R2, which are visible only on<br />
the R <strong>and</strong> Z components. But Fig. 2.18 is also a good example for inverse (negative)<br />
dispersion in the Rayleigh-wave groups. Their periods range from about 60 s to almost 200 s,<br />
with the longest periods arriving at the end of the R1 <strong>and</strong> R2 groups. This is just the period<br />
range of inverse dispersion according to Fig. 2.9 for both continental <strong>and</strong> oceanic mantle<br />
Rayleigh waves. This inverse dispersion is not seen in records of classical WWSSN longperiod<br />
seismographs with a peak magnification around 15 s because the corresponding<br />
periods are filtered out by the system response of these seismographs.<br />
Further, one should note in Fig. 2.18 that these surface waves originate from an earthquake in<br />
the Tonga trench subduction zone at a depth of h = 230 km. This seems to contradict the<br />
above statement, that no or only weak surface waves can be observed from deep earthquakes.<br />
However, there is no contradiction. As discussed above, the depth of penetration (<strong>and</strong> thus<br />
constructive interference) of surface waves increases with their wavelength. For the periods<br />
considered in Fig. 2.18 Λ ranges between about 230 <strong>and</strong> 880 km, i.e., it is comparable or<br />
larger than the source depth. Therefore, we still can expect significant surface wave energy in<br />
that period range for the largest amplitudes in Fig. 2.18. However, no periods below 50 s, as<br />
recorded in classical narrow-b<strong>and</strong> long-period records, are recognizable in these surface-wave<br />
trains.
2. <strong>Seismic</strong> <strong>Wave</strong> <strong>Propagation</strong> <strong>and</strong> <strong>Earth</strong> <strong>models</strong><br />
With modern very broadb<strong>and</strong> (VBB) recording systems of high dynamic range (see Chapter<br />
5) it is possible to record such long-period global mantle surface waves up to about R7, riding<br />
on oscillations of solid <strong>Earth</strong>’s tides of even longer period (more than 12 hours). Fig. 2.19<br />
shows a striking example. The successive groups of R reveal an exponential decay of<br />
amplitudes. This allows the determination of the intrinsic frequency-dependent attenuation in<br />
the crust <strong>and</strong> mantle (see 2.5.4.2).<br />
Fig. 2.18 Records of the March 11, 1989 Tonga trench earthquake (h = 235 km) in the Z, R<br />
<strong>and</strong> T components of the IRIS/IDA station NNA in Peru (D = 93.7°) (from Shearer,<br />
Introduction to Seismology, 1999; with permission from Cambridge University Press).<br />
Fig. 2.19 Example of a very broadb<strong>and</strong> (VBB) record with high dynamic range by the STS1<br />
seismograph operated by the Nagoya University, Japan. The seismic wave groups from a<br />
magnitude 8.2 earthquake in the Kermadec Isl<strong>and</strong>s (October 20, 1986) are superimposed to<br />
solid <strong>Earth</strong>’s tides (modified from a pamphlet of the Japanese Global Seismology<br />
Subcommittee for the POSEIDON project).<br />
20
2.4 Normal modes<br />
21<br />
2.4 Normal modes<br />
Since the <strong>Earth</strong> is not an infinite half-space but a finite body, all wave motions must be<br />
confined too. Body waves are reflected back from the surface into the <strong>Earth</strong>, surface waves<br />
orbit along great circle paths. Thus, there will be a multitude of different seismic phases<br />
arriving at a given point on the surface. Depending on their timing <strong>and</strong> periods they will<br />
interfere with each other, either in a more destructive or more constructive manner. The latter<br />
will be the case at certain resonant frequencies only. They are termed the <strong>Earth</strong>’s normal<br />
modes <strong>and</strong> provide another alternative way of representing wave propagation. An analogy is<br />
the st<strong>and</strong>ing wave modes of a vibrating string fixed at both ends (Fig. 2.20). The lowest<br />
frequency is called the fundamental mode; the higher modes are the overtones. This can be<br />
treated as an eigenvalue problem: the resonant frequencies are called eigenfrequencies; the<br />
related displacements are termed the eigenfunctions.<br />
Fig. 2.20 The first four modes of vibration of a string between fixed endpoints (from Shearer,<br />
Introduction to Seismology, 1999; with permission from Cambridge University Press).<br />
One should be aware of the following points about normal modes in observatory practice:<br />
• any wave motion within the <strong>Earth</strong> may be expressed as a sum of normal modes with<br />
different excitation factors;<br />
• there exist, in analogy to P/SV (Rayleigh) <strong>and</strong> SH (Love) -wave motion, spheroidal<br />
modes <strong>and</strong> toroidal modes, respectively;<br />
• toroidal modes involve no radial motion <strong>and</strong> are only sensitive to the shear velocity;<br />
• spheroidal modes have both radial <strong>and</strong> horizontal motion. They are sensitive to both<br />
compressional <strong>and</strong> shear velocities;<br />
• long-period spheroidal modes are sensitive to gravity <strong>and</strong> thus provide information<br />
about the density structure of the <strong>Earth</strong> that may not be obtained in any other way;<br />
• the ellipticity of the <strong>Earth</strong>, its rotation as well as its 3-D velocity variations will cause<br />
a splitting of the eigenfrequency spectral lines. Thus the investigation of normal mode<br />
splitting allows to constrain 3-D structures of the <strong>Earth</strong>;<br />
• normal modes do (besides PKPdf amplitudes) provide information about the shearwave<br />
velocity of the inner core;<br />
• the decay of mode amplitudes with time has provided important information about the<br />
attenuation properties of the <strong>Earth</strong> at very long periods;<br />
• normal modes provide a complete set of basis functions for the computation of<br />
synthetic seismograms for surface-wave <strong>and</strong> long-period body-wave seismology.
2. <strong>Seismic</strong> <strong>Wave</strong> <strong>Propagation</strong> <strong>and</strong> <strong>Earth</strong> <strong>models</strong><br />
Therefore, the collection of high-quality broadb<strong>and</strong> data that also allow retrieval of normal<br />
modes is an important function of high-tech seismological broadb<strong>and</strong> observatories. This<br />
requires very stable installation conditions, for horizontal seismometers in particular, e.g., in<br />
boreholes (see 7.4.5) or deep non-producing underground mines in order to reduce near<br />
surface tilt noise caused by barometric pressure variations. The latter may also be filtered out<br />
by correlating parallel recordings of seismometers <strong>and</strong> micro-barometers (e.g., Warburton <strong>and</strong><br />
Goodkind, 1977; Beauduin et al., 1996; see Fig. 2.21).<br />
Fig. 2.21 Normal mode spectra exited by an Ms = 8.2 earthquake in the Macquarie Isl<strong>and</strong><br />
region <strong>and</strong> recorded with STS1 at the stations SSB2 in France <strong>and</strong> BFO in Germany. BFO is<br />
located in an old silver mine <strong>and</strong> has very low tilt noise. The latter is high at SSB2 (broken<br />
lines) but could be filtered out (solid lines) by correlation with micro-barometric recordings<br />
(reproduced from Beauduin et al., The Effects of the Atmospheric Pressure Changes on<br />
<strong>Seismic</strong> Signals …, Bull. Seism. Soc. Am., Vol. 86, No. 6, Fig. 8, page 1768, 1996; ©<br />
Seismological Society of America).<br />
In fact, normal mode analysis in the spectral domain (see Chapter 4.1) is the only practical<br />
way to examine seismic records at very long periods (> 500 s) <strong>and</strong> thus with wavelengths of<br />
2000 <strong>and</strong> more kilometers. But normal mode studies themselves are beyond the scope of<br />
routine data analysis at seismological observatories <strong>and</strong> will not be considered in this Manual.<br />
(For further readings see Gilbert <strong>and</strong> Dziewonski, 1975; Aki <strong>and</strong> Richards, 1980 <strong>and</strong> 2002;<br />
Lapwood <strong>and</strong> Usami, 1981; Lay <strong>and</strong> Wallace, 1995; Dahlen <strong>and</strong> Tromp, 1998; Kennett,<br />
2001).<br />
22
23<br />
2.4 Normal modes<br />
First observations of some normal modes were made in conjunction with the strongest<br />
earthquake of the 20 th century (Chile, 1960). Since then, further progress in seismometry <strong>and</strong><br />
data analysis have permitted the identification of over a thous<strong>and</strong> modes <strong>and</strong> on that basis, to<br />
significantly refine velocity, density <strong>and</strong> attenuation <strong>models</strong> of the <strong>Earth</strong> (see 2.7; PREM<br />
model). Fig. 2.22 shows the patterns of surface <strong>and</strong> radial motions related to some of the<br />
spheroidal <strong>and</strong> toroidal modes. Their general nomenclature is nSl <strong>and</strong> nTl. n is the number of<br />
zero crossings of amplitudes with depth while l is the number of zero (nodal) lines on the<br />
surface of the sphere.<br />
Fig. 2.22 Top: Surface <strong>and</strong> radial patterns of motions of spheroidal modes. Bottom: Purely<br />
radial modes involve no nodal pattern on the surface but have nodal surfaces at depth.<br />
Toroidal modes involve purely horizontal twisting of the <strong>Earth</strong>. For explanation of mode<br />
nomenclature see text (after Bolt, 1982; from Lay <strong>and</strong> Wallace, 1995, Fig. 4.24, p. 160; with<br />
permission of Elsevier Science (USA)).<br />
Accordingly, the fundamental spheroidal “breathing” mode of the <strong>Earth</strong> is oSo because it<br />
represents a simple expansion <strong>and</strong> contraction of the <strong>Earth</strong>. It has a period of about 20 min<br />
oS2 has the longest period (≈ 54 min) <strong>and</strong> describes an oscillation between an ellipsoid of<br />
horizontal <strong>and</strong> vertical orientation, sometimes termed “rugby” mode. The toroidal mode oT2<br />
corresponds to a purely horizontal twisting motion between the northern <strong>and</strong> southern<br />
hemisphere <strong>and</strong> has a period of about 44 min. Overtones iS <strong>and</strong> iT with i = 1, 2, 3,… have one,<br />
two, three or more nodal surfaces at constant radii from the center of the <strong>Earth</strong> across which<br />
the sense of radial or twisting motions reverses.<br />
In summary, strong earthquakes can make the planet <strong>Earth</strong> ring like a bell. Seismologists may<br />
be compared with experienced bell-makers who are able to infer from the complex sound<br />
spectra of a bell not only its size <strong>and</strong> general shape but also the composition of the alloy of<br />
which it is made.
2. <strong>Seismic</strong> <strong>Wave</strong> <strong>Propagation</strong> <strong>and</strong> <strong>Earth</strong> <strong>models</strong><br />
2.5 <strong>Seismic</strong> rays, travel times, amplitudes <strong>and</strong> phases<br />
2.5.1 Introduction<br />
So far we have introduced seismic body <strong>and</strong> surface waves. We have learned why these<br />
different wave types travel with different velocities through <strong>and</strong> consequently appear in the<br />
seismogram at different times. We have seen that body waves form short transient wavelets<br />
(see Figs. 2.3 <strong>and</strong> 3.7), in contrast to the prolonged <strong>and</strong> dispersed wave trains of surface<br />
waves (e.g., Figs. 2.11 <strong>and</strong> 2.23). Fig. 2.23 shows a seismic record of an earthquake 73° away.<br />
Besides the discussed primary body <strong>and</strong> surface waves (P, S, LQ, <strong>and</strong> LR), several additional<br />
arrivals are marked in the seismogram <strong>and</strong> their symbols are given. These energy pulses are<br />
mainly caused by reflection or mode conversion of primary P or S waves either at the free<br />
surface of the <strong>Earth</strong> or at velocity-density discontinuities inside the <strong>Earth</strong>.<br />
Fig. 2.23 Digital broadb<strong>and</strong> record of the Seattle Mw = 6,8 earthquake on 28 February 2001<br />
at the station Rüdersdorf (RUE), Germany (epicentral distance D = 73°). Note the detailed<br />
interpretation of secondary phase onsets.<br />
A proper underst<strong>and</strong>ing of these arrivals is essential for a correct phase identification that in<br />
turn is of great importance for event location (see IS 11.1) <strong>and</strong> magnitude determination (see<br />
3.2 <strong>and</strong> EX 3.1) but also for later determination of seismic velocities inside the <strong>Earth</strong>. We will<br />
24
2.5 <strong>Seismic</strong> rays, travel times, amplitudes <strong>and</strong> phases<br />
introduce <strong>and</strong> use the concept of seismic rays to underst<strong>and</strong> <strong>and</strong> illustrate the formation <strong>and</strong><br />
propagation of these different wave arrivals.<br />
<strong>Seismic</strong> ray theory is a very convenient <strong>and</strong> intuitive way to model the propagation of seismic<br />
energy <strong>and</strong> in particular of body waves. It is generally used to locate earthquakes <strong>and</strong> to<br />
determine focal mechanisms <strong>and</strong> velocity structure from body wave arrivals. <strong>Seismic</strong> ray<br />
theory is essentially analogous to optical ray theory, including phenomena like ray-bending,<br />
focusing <strong>and</strong> defocusing.<br />
Using ray theory, it is important to keep in mind that it is an approximation that does not<br />
include all aspects of wave propagation. Ray theory is based on the so-called high-frequency<br />
approximation which states that fractional changes in velocity gradient over one seismic<br />
wavelength are small compared to the velocity. In other words, we may use ray theory only if<br />
the dimensions of structures to be considered are larger than the seismic wavelengths used.<br />
These conditions are valid for most parts of the <strong>Earth</strong> (see global model in Fig. 2.53) <strong>and</strong> for<br />
the wavelengths that are usually recorded <strong>and</strong> analyzed in seismological observatory practice.<br />
The problem of relatively sharp boundaries, as for example the crust-mantle interface (Moho -<br />
discontinuity), discontinuities in the upper mantle, <strong>and</strong> the core-mantle boundary (CMB) or<br />
the inner-core boundary (ICB) can be tackled by matching the boundary conditions between<br />
neighboring regions in which the ray solutions are valid.<br />
2.5.2 Huygen’s <strong>and</strong> Fermat’s Principle <strong>and</strong> Snell’s Law<br />
In classical optics, Huygen’s Principle governs the geometry of a wave surface. It states that<br />
every point on a propagating wavefront can be considered the source of a small secondary<br />
wavefront that travels outward at the wave velocity in the medium at that point. The position<br />
of the wavefront at a later time is given by the tangent surface of the exp<strong>and</strong>ing secondary<br />
wavefronts. Since portions of the primary wave front, which are located in relatively highvelocity<br />
material, produce secondary wavefronts that travel faster than those produced by<br />
points in relatively low-velocity material, this results in temporal changes of the shape of the<br />
wavefront when propagating in an inhomogeneous medium. Since rays are defined as the<br />
normals to the wavefront, they will change accordingly. Rays are a convenient means for<br />
tracking an exp<strong>and</strong>ing wavefront. Fig. 2.24 depicts the change of direction of a plane<br />
wavefront <strong>and</strong> associated ray when traveling through a discontinuity which separates two<br />
homogeneous media with different but constant wave propagation velocity.<br />
Fermat’s Principle governs the geometry of the raypath. It states that the energy (or ray) will<br />
follow a minimum time path, i.e., it takes that path d between two points, which takes an<br />
extreme travel-time t (i.e., the shortest or the longest possible travel time, with ∂t/∂d = 0).<br />
Such a path is called stationary. In case of a stationary time path there exist three possibilities,<br />
depending on the value (sign) of the higher derivatives of ∂t/∂d:<br />
for ∂ 2 t/∂d 2 > 0 the ray follows a true minimum time path,<br />
for ∂ 2 t/∂d 2 < 0 the ray follows a maximum time path <strong>and</strong><br />
for ∂ 2 t/∂d 2 = 0 i.e., in case of an inflection point of the travel-time curve, the ray<br />
follows a minimax time path.<br />
25
2. <strong>Seismic</strong> <strong>Wave</strong> <strong>Propagation</strong> <strong>and</strong> <strong>Earth</strong> <strong>models</strong><br />
Different kinds of seismic waves follow different time paths, e.g., the reflected waves pP (see<br />
Fig. 2.43) a true minimum path, the PP or the SKKS reflection (Fig. 2.42) a minimax path <strong>and</strong><br />
the reflected wave P'P' (PKPPKP) (Fig. 2.44) a true maximum path. Note that the character of<br />
the stationary path influences the character (phase shift) of the reflected waveform. Whenever<br />
a seismic ray travels in some parts of its raypath as a maximum time ray, it touches a caustic.<br />
This caustic can be a focusing point (see 2.5.3.3 or 2.5.3.4) or a surface along which seismic<br />
rays superimpose each other (see 2.5.4.3). In any case prominent phase distortion can be<br />
observed <strong>and</strong> has to be taken into account during the analysis of seismograms.<br />
2.5.2.1 Snell’s Law for a flat <strong>Earth</strong><br />
From Fermat’s Principle follows, with some simple geometry <strong>and</strong> mathematics, Snell’s Law<br />
of wave refraction (e.g., Aki <strong>and</strong> Richards 1980 <strong>and</strong> 2002; Lay <strong>and</strong> Wallace, 1995; Shearer,<br />
1999; Červeny, 2001; Kennett, 2001):<br />
sin i/v = s sin i = sx = 1/vapp ≡ p = constant (2.12)<br />
where i is the angle of incidence, measured between the ray <strong>and</strong> the vertical (see Fig. 2.24), v<br />
is the velocity of wave propagation in the medium, s =1/v is called slowness, <strong>and</strong> p is the socalled<br />
ray parameter, v/sin i = vapp is the apparent horizontal wave propagation velocity in xdirection<br />
with vapp = ∞ for i = 0 (vertical incidence of the ray) <strong>and</strong> sx = 1/vapp is the horizontal<br />
component of the slowness vector s. Note, however, that p is constant for laterally<br />
homogeneous media only. In Fig. 2.24 the refraction of a seismic wavefront <strong>and</strong> of a related<br />
seismic ray across the interface of two half spaces with different but constant seismic<br />
velocities v1 <strong>and</strong> v2 is sketched. Such an instantaneous velocity jump is called first-order<br />
discontinuity. Because the ray parameter must remain constant across the interface, the ray<br />
angle has to change:<br />
sin i1/v1 = sin i2/v2 = s1 sin i1 = s2 sin i2. (2.13)<br />
Fig. 2.24 A plane wavefront with the associated ray crossing a medium boundary with v2>v1.<br />
The ray in medium two is refracted away from the vertical, i.e., i2>i1.<br />
2.5.2.2 Snell's Law for the spherical <strong>Earth</strong><br />
Above, a flat-layered case was considered. Yet the <strong>Earth</strong> is a sphere <strong>and</strong> curvature has to be<br />
taken into account at distances greater than about 12°. In this case the ray parameter has to be<br />
26
2.5 <strong>Seismic</strong> rays, travel times, amplitudes <strong>and</strong> phases<br />
modified. In Fig. 2.25 a ray is sketched in a sphere composed of two concentric shells 1 <strong>and</strong> 2<br />
of different but constant velocity v1 <strong>and</strong> v2 or slowness s1 = 1/v1 <strong>and</strong> s2 = 1/v2, respectively. At<br />
the first interface between medium 1 <strong>and</strong> 2, Snell's Law must be satisfied locally, i.e.,:<br />
s1 sin i 1 (r1) = s2 sin i2(r2) (2.14)<br />
for r1 = r2. Inside shell 2, however, despite v2 = const., the incidence angle changes as the ray<br />
progresses, namely, i1(r1) ≠ i'2(r' 2 ). If we project the ray in medium 2 further to its turning<br />
point where r = rmin we see from the set of right triangles that the following relationship holds:<br />
s1 r1 sin i1 = s2 r'2 sin i'2.<br />
This is true along the entire ray path <strong>and</strong> we can generalize<br />
which is the modified Snell's Law for a spherical <strong>Earth</strong>.<br />
s r sin i = r sin i/v ≡ p, (2.15)<br />
Fig. 2.25 Ray geometry for an <strong>Earth</strong> model consisting of two spherical shells of constant but<br />
different velocity v1 <strong>and</strong> v2..<br />
2.5.3 Rays <strong>and</strong> travel times in laterally homogeneous (1-D) media<br />
2.5.3.1 Velocity gradient<br />
It is true for most parts of the <strong>Earth</strong> that the seismic velocity increases with depth due to<br />
compaction of the material. Consider a ray travelling downwards through a stack of layers<br />
with constant velocities vi = 1/si each, however, increasing layer velocities with depth (Fig.<br />
2.26). Applying Snell's law<br />
p = s1 sin i1 = s2 sin i2 = s3 sin i3 ... (2.16)<br />
we can derive the incidence angle i, that is continuously increasing with depth, <strong>and</strong> finally<br />
approaching 90°. At i = 90° the ray is at its turning point tp.<br />
27
2. <strong>Seismic</strong> <strong>Wave</strong> <strong>Propagation</strong> <strong>and</strong> <strong>Earth</strong> <strong>models</strong><br />
Fig. 2.26 Ray through a multi-layered model with constant velocity within the layers but<br />
increasing velocity with depth of the layers. The ray angle i increases accordingly with depth.<br />
This can be generalized by modeling a velocity gradient with depth as a stack of many thin<br />
layers with constant velocity. Rays <strong>and</strong> travel times for this case are sketched in Fig. 2.27.<br />
The plot of arrival times t versus distance x is generally called the travel-time curve. The<br />
tangent dti/dxi on the travel-time curve at any distance xi corresponds to the inverse of the<br />
horizontal wave propagation velocity 1/vappi <strong>and</strong> thus to the ray parameter pi of that ray which<br />
comes back to the surface at xi. Because of sin i = sin 90° = 1 at the turning point of the ray,<br />
we can determine the velocity vtp at the turning point of the ray either from the gradient of the<br />
travel-time curve at xi via pi = dti/dxi = 1/vtp or by knowing the sub-surface velocity voi at<br />
station xi <strong>and</strong> measuring the incidence angle ioi at that station (vtp = voi /sin ioi).<br />
Fig. 2.27 Raypaths (middle) <strong>and</strong> travel-time curve (right) for a model with velocity v<br />
gradually increasing with depth z (left). The incidence angle i increases continuously until it<br />
reaches 90°at the turning point tp, then the rays turn up again to reach the surface at xi. On the<br />
travel-time curve each point comes from a different ray with a different slowness <strong>and</strong> ray<br />
parameter p. The gradient of the tangent on the travel time curve at xi is the ray parameter pi =<br />
dti/dxi. In the considered case of modest velocity increase with depth the distance x increases<br />
with decreasing p. The related travel-time curve is termed prograde.<br />
2.5.3.2 Effect of a sharp velocity increase<br />
Next we consider the effect of a sharp velocity increase, which may be an increase in gradient<br />
(second-order discontinuity) or an instantaneous velocity jump (first-order discontinuity). Fig.<br />
28
2.5 <strong>Seismic</strong> rays, travel times, amplitudes <strong>and</strong> phases<br />
2.28a shows on the left side a hypothetical velocity-depth model in the upper crust of the<br />
<strong>Earth</strong> together with the related seismic rays <strong>and</strong> on the right the corresponding travel-time<br />
curves in the reduced-time presentation tred = t – (x/vred). Usually travel-time increases with<br />
distance. Consequently, presenting absolute travel-time curves for large epicentral distances<br />
would require very long time-scales. Also, small changes in dt/dx are then not so well<br />
recognizable. Therefore, in order to reduce the time scale <strong>and</strong> to increase the resolution of<br />
changes in slowness, travel-time curves are often represented as reduced travel-time curves,<br />
in which tred = t - x/vred is plotted (for some constant vred) as a function of x. The reduction<br />
velocity vred is usually chosen so as to be close to the mean velocity in the considered depth<br />
range or of the considered seismic phase. Its reduced travel-time is then constant <strong>and</strong> positive<br />
or negative slowness deviations are clearly recognizable.<br />
In the ray diagram of Fig. 2.28a one recognizes that at certain distances x, rays with different<br />
incidence angles may emerge. Modest velocity gradients in the upper <strong>and</strong> lower part of the<br />
velocity profile result in rays which return to the surface with increasing distance x for<br />
decreasing ray parameter p. This produces prograde travel-time branches (yellow <strong>and</strong> green<br />
branches in the tred-x plot). In contrast, a strong velocity gradient leads to decreasing x with<br />
decreasing p <strong>and</strong> thus to a receding (retrograde) travel-time branch (red). Thus, a strong<br />
gradient zone between two weak gradient zones results in a triplication of the travel-time<br />
curve. The endpoints of the triplication are called caustics. At the caustics (positions x1 <strong>and</strong><br />
x2) rays, which have left the source under different take-off angles, arrive at the surface at the<br />
same time. This causes a focusing of energy, large amplitudes <strong>and</strong> a waveform distortion (see<br />
2.5.4.3). Fig. 2.28b shows qualitatively, with the same color coding as in Fig. 2.28a, the<br />
changes in the ray parameter p with distance x for the prograde <strong>and</strong> retrograde travel-time<br />
branch(es) of a triplication.<br />
Fig. 2.28a Left: Velocity-depth profile in a model of the upper crust with a strong velocity<br />
gradient between about 2.5 <strong>and</strong> 6 km depth <strong>and</strong> related seismic rays from a surface source.<br />
Right: ray diagram <strong>and</strong> tred-x relation for the given model; vred = 4.5 km/s. Note the<br />
differently colored segments of the velocity-depth distribution <strong>and</strong> of the travel-time branches<br />
that relate to the seismic rays given in the same color. Yellow <strong>and</strong> green: prograde travel-time<br />
curves, red: retrograde travel-time curve. Note the two lowermost blue rays that have already<br />
been affected by a low-velocity zone below 10 km depth (courtesy of P. Richards.)<br />
29
2. <strong>Seismic</strong> <strong>Wave</strong> <strong>Propagation</strong> <strong>and</strong> <strong>Earth</strong> <strong>models</strong><br />
Fig. 2.28b Distance x as a function of ray parameter p for triplications. Note that the colors in<br />
this diagram correspond to the colors of the related rays <strong>and</strong> velocity segments in Fig. 2.28a.<br />
The gradient of the retrograde travel-time branch <strong>and</strong> the position x1 <strong>and</strong> x2 of the caustics are<br />
controlled by the thickness <strong>and</strong> the velocity-gradient in this strong-gradient zone. Similar<br />
triplications develop in the presence of first-order discontinuities with positive velocity jump.<br />
In this case the retrograde branch relates to the postcritical reflections from such a<br />
discontinuity (see 2.5.3.6 <strong>and</strong> Fig. 2.32). The identification <strong>and</strong> quantification of such first-<br />
<strong>and</strong> second-order discontinuities is of greatest importance for the underst<strong>and</strong>ing of related<br />
changes in physical <strong>and</strong>/or compositional properties in the <strong>Earth</strong>. This necessitates, however,<br />
that not only first arrivals of seismic waves but also later, secondary arrivals are identified <strong>and</strong><br />
their amplitudes measured. Since the latter may follow rather closely to the former, their<br />
proper identification <strong>and</strong> onset-time measurement may be difficult in very narrow-b<strong>and</strong><br />
filtered recordings because of their strong signal distortion (see figures in 4.2).<br />
Fig. 2.29 Triplications of the P-wave travel-time curve (here in reduced presentation) due to<br />
the 410 km <strong>and</strong> 660 km upper mantle/transition zone discontinuities, calculated according to<br />
the IASP91 velocity model (Kennett <strong>and</strong> Engdahl, 1991) (see 2.7, Fig. 2.51). The P waves<br />
diving directly below the 410 km (660 km) are called P410 (P660); the phases P410P <strong>and</strong><br />
P660P are the overcritical reflections from the outer side of these discontinuities, respectively.<br />
30
2.5 <strong>Seismic</strong> rays, travel times, amplitudes <strong>and</strong> phases<br />
Two of the most pronounced velocity <strong>and</strong> density increases occur at about 410 <strong>and</strong> 660 km<br />
below the surface (see 2.7, Figs. 2.51 <strong>and</strong> 2.53). They mark the lower boundary of the upper<br />
mantle <strong>and</strong> of the transition zone from the upper mantle to the lower mantle, respectively.<br />
Both are caused by phase transitions of the mantle material into states of higher density at<br />
critical pressure-temperature (P-T) conditions. These two pronounced discontinuities result in<br />
triplications of the P-wave travel-time curves in the distance range between about 14° <strong>and</strong> 28°<br />
(see Fig. 2.29) associated with a strong increase of P-wave amplitudes around 20° (so-called<br />
20° discontinuity; see also Fig. 3.13).<br />
2.5.3.3 Effect of a low-velocity zone<br />
Velocity generally increases with depth due to compaction, however, lithologic changes or the<br />
presence of water or melts may result in low-velocity zones (LVZ). Fig. 2.30 shows the<br />
effects of an LVZ on seismic rays <strong>and</strong> the travel-time curve. The latter becomes<br />
discontinuous, forming a shadow zone within which no rays emerge back to the surface.<br />
Beyond the shadow zone the travel-time curve continues with a time off-set (delay) from a<br />
caustic with two branches: one retrograde branch (blue) beginning with the same apparent<br />
horizontal velocity as just before the beginning of the shadow zone <strong>and</strong> another prograde<br />
branch with higher apparent velocity (smaller dt/dx). This is shown in Fig. 2.30 which is in<br />
fact a continuation of the model shown in Fig. 2.28a towards greater depth. One recognizes a<br />
low-velocity zone between 12 <strong>and</strong> 18 km depth. The related ray diagram clearly shows how<br />
the rays that are affected by the LVZ jump from an arrival at distance 79 km to 170 km, <strong>and</strong><br />
then go back to a caustic at 110 km before moving forward again. The related prograde traveltime<br />
branches <strong>and</strong> rays have been color-coded with green, blue <strong>and</strong> violet. The corresponding<br />
tred-x plot on the right side of Fig. 2.30 shows nicely the travel-time offset <strong>and</strong> caustic beyond<br />
the shadow zone with two branches: a) retrograde (blue) <strong>and</strong> b) prograde (violet).<br />
Fig. 2.30 Left: Velocity-depth profile <strong>and</strong> seismic rays in the crust with a low-velocity zone<br />
between 12 km < h < 18 km depth. The black segment in the velocity-depth curve produces<br />
the shadow zone. Right: ray diagram <strong>and</strong> tred-x relation for the considered model. The<br />
reduction velocity is vred = 5.0 km/s. Note the additional colored travel-time branches which<br />
relate to the seismic rays given in the same color. Green <strong>and</strong> violet: prograde travel-time<br />
curves, blue <strong>and</strong> red: retrograde travel-time curves. There is a caustic at distance x3.<br />
Therefore, the end of the shadow has strong amplitudes (courtesy of P. Richards).<br />
31
2. <strong>Seismic</strong> <strong>Wave</strong> <strong>Propagation</strong> <strong>and</strong> <strong>Earth</strong> <strong>models</strong><br />
An outst<strong>and</strong>ing example for an LVZ, which shows these feature very clearly, is the outer core.<br />
At the core-mantle boundary the P-wave velocity drops from about 13.7 km/s in the<br />
lowermost mantle to about 8 km/s in the liquid outer core. This causes a shadow zone for<br />
short-period direct P waves between around 100° <strong>and</strong> 144°, however slightly “illuminated” by<br />
reflected arrivals from the inner-core boundary (PKiKP) <strong>and</strong> by rays that have been refracted<br />
backward to shorter distances (retrograde travel-time branch) due to the strong velocity<br />
increase in the inner core (phase PKPdf = PKIKP) (see Fig. 11.59). The travel-time branch<br />
PKPab corresponds qualitatively to the blue branch <strong>and</strong> the branch PKPdf beyond the caustic<br />
to the violet branch in Fig. 2.30 (compare with overlay to Fig. 2.47). There may exist,<br />
however, also LVZ´s in the crust <strong>and</strong> in the upper mantle (asthenosphere; see PREM model in<br />
Fig. 2. 53). Low-velocity zones are often more pronounced in S-wave velocity than in P-wave<br />
velocity because material weakening due to (partial) melting reduces more strongly the shear<br />
modulus μ than the bulk modulus κ (see Eqs. (2.9) <strong>and</strong> (2.10)).<br />
2.5.3.4 Refraction, reflection, <strong>and</strong> conversion of waves at a boundary<br />
So far we have only considered transmission of seismic waves at a boundary. However,<br />
generally not all energy is transmitted; parts are reflected or converted. If a P wave hits a<br />
boundary between different seismic velocities, four different waves may be generated: a<br />
transmitted P wave; a converted transmitted S wave purely polarized in the vertical plane of<br />
propagation (SV-wave); a reflected P wave; <strong>and</strong> a reflected converted SV wave (Fig. 2.31).<br />
The geometry of these waves is also governed by Snell's Law:<br />
sin i/vp1 = sin j/vs1 = sini´/vp2 = sin j´/vs2. (2.17)<br />
Fig. 2.31 An incident P wave at a solid-solid boundary (shown is the case v1 < v2) generates a<br />
reflected <strong>and</strong> a transmitted P wave <strong>and</strong> a reflected <strong>and</strong> transmitted SV wave. Snell’s Law<br />
governs the angular relationship between the rays of the resultant waves.<br />
32
2.5 <strong>Seismic</strong> rays, travel times, amplitudes <strong>and</strong> phases<br />
In the case of an SH wave hitting the boundary, which is purely polarized in the horizontal<br />
plane, there is only a transmitted <strong>and</strong> a reflected SH wave, but no conversion into P or SV<br />
possible. If a single incident wave is split into multiple scattered waves, energy must be<br />
partitioned between these waves. Coefficients governing the partitioning between transmitted,<br />
reflected, <strong>and</strong> converted energy will generally depend on the incidence angle of the incoming<br />
wave <strong>and</strong> the impedance contrast at the boundary. Impedance is the product of wave velocity<br />
<strong>and</strong> density of the medium. Derivation of the expressions for reflection, transmission, <strong>and</strong><br />
conversion coefficients is beyond the scope of this book. We refer, e.g., to the classic<br />
textbook of Aki <strong>and</strong> Richards (1980 <strong>and</strong> 2002) for a complete treatment <strong>and</strong> to Müller (1985)<br />
or Shearer (1999) for a condensed overview. The same applies to the following considerations<br />
below on seismic energy, amplitudes <strong>and</strong> phases.<br />
2.5.3.5 <strong>Seismic</strong> rays <strong>and</strong> travel times in homogeneous <strong>models</strong> with horizontal <strong>and</strong> tilted<br />
layers<br />
Below we consider a horizontal two-layer model above a half-space. Within the layers <strong>and</strong> in<br />
the half space the wave velocities are constant with v1 icr all energy incident at a first-order discontinuity is totally reflected back into the<br />
overlaying layer. However, part of it may be converted. The point in the travel-time curve at<br />
which a critically reflected ray (reflection coefficient 1) comes back to the surface is termed<br />
the critical point xcr. The travel-time curve has a caustic there. Reflected rays arriving with i <<br />
icr are termed precritical (or steep angle) reflections (with reflection coefficients < 1), those<br />
with i > icr as postcritical, supercritical or wide-angle reflections (with a reflection coefficient<br />
= 1) (see Fig. 2.32). However, in this case the reflection coefficient becomes a complex<br />
number which results in the above discussed phase distortion of overcritical reflections. Note<br />
that the travel-time hyperbola of the reflected waves from the bottom of the first layer (red<br />
curve) merges asymptotically at larger distances with the travel-time curve of the direct wave<br />
in this layer (yellow curve).<br />
<strong>Seismic</strong> rays incident with in = i n cr on the lower boundary of layer n are refracted with in+1 =<br />
90° into the boundary between the two layers n <strong>and</strong> n+1. They form so-called seismic head<br />
waves (green <strong>and</strong> blue rays <strong>and</strong> travel-time curves, respectively, in Fig. 2.32). Head waves are<br />
inhomogeneous boundary waves that travel along the discontinuity with the velocity of layer<br />
n+1 <strong>and</strong> radiate upward wave energy under the angle i n cr. The full description of this kind of<br />
wave is not possible in terms of ray theory but requires a wave-theoretical treatment. In the<br />
real <strong>Earth</strong>, with non-ideal first-order layer boundaries, true head waves will hardly exist but<br />
rather so-called diving waves which slightly penetrate - through the high-gradient zone<br />
between the two media - into the underlying high-velocity medium. There they travel subparallel<br />
to the discontinuity <strong>and</strong> are refracted back towards the surface under an angle ≈ icr. In<br />
terms of travel time there is practically no difference between a diving wave <strong>and</strong> a pure headwave<br />
along a first-order velocity discontinuity; diving waves, however, have usually larger<br />
amplitudes.<br />
33
2. <strong>Seismic</strong> <strong>Wave</strong> <strong>Propagation</strong> <strong>and</strong> <strong>Earth</strong> <strong>models</strong><br />
Fig. 2.32 Schematic local travel-time curves (time t over distance x from the source) for a<br />
horizontal two-layer model with constant layer velocities v1 <strong>and</strong> v2, layer thickness h1 <strong>and</strong> h2<br />
over a half-space with velocity v3. Other abbreviations st<strong>and</strong> for: t 1 ic <strong>and</strong> t 2 ic – intercept times<br />
at x = 0 of the extrapolated travel-time curves for the “head-waves”, which travel with v2<br />
along the intermediate discontinuity between the layers 1 <strong>and</strong> 2 <strong>and</strong> with v3 along the<br />
discontinuity between layer 2 <strong>and</strong> the half-space, respectively. x 1 cr <strong>and</strong> x 2 cr mark the distances<br />
from the source at which the critically reflected rays from the bottom of the first <strong>and</strong> the<br />
second layer, respectively, return to the surface. Beyond x 1 co <strong>and</strong> x 2 co the head-waves from the<br />
bottom of the first <strong>and</strong> the second layer, respectively, become the first arriving waves (xco -<br />
crossover distance) Rays <strong>and</strong> their corresponding travel-time curves are shown in the same<br />
color. The full red (violet) travel-time curve relates to the supercritical reflections (i > icr)<br />
from the intermediate (lower) discontinuity while the dotted red (violet) travel-time curve<br />
refers to the respective pre-critical (i < icr) steep angle reflections.<br />
In the case of horizontal layering as in Fig. 2.32 the layer <strong>and</strong> half-space velocities can be<br />
determined from the gradients dt/dx of the yellow, green <strong>and</strong> blue travel-time curves which<br />
correspond to the inverse of the respective layer velocities. When determining additionally the<br />
related intercept times t 1 ic <strong>and</strong> t 2 ic by extrapolating the green <strong>and</strong> blue curves, or with help of<br />
the crossover distances x 1 co <strong>and</strong> x 2 co, then one can also determine the layer thickness h1 <strong>and</strong> h2<br />
from the following relationships:<br />
h1 = 0.5 x 1 co<br />
v1<br />
+ v<br />
v + v<br />
1<br />
2<br />
2<br />
=<br />
0.<br />
5<br />
t<br />
1<br />
ic<br />
v ⋅v<br />
v<br />
1<br />
2<br />
2<br />
2<br />
− v<br />
2<br />
1<br />
<strong>and</strong> h2<br />
34<br />
t<br />
− 2 h<br />
v<br />
− v<br />
(v ⋅v<br />
)<br />
2<br />
2 2<br />
−1<br />
=<br />
ic<br />
2<br />
1 3 1 1 2<br />
2 2<br />
−1<br />
v 3 − v 2 ⋅(v<br />
2 ⋅v<br />
3 )<br />
. (2.18)<br />
For the calculation of crossover distances for a simple one-layer model as a function of layer<br />
thickness <strong>and</strong> velocities see Equation (6) in IS 11.1.<br />
In the case where the layer discontinuities are tilted, the observation of travel-times in only<br />
one direction away from the seismic source will allow neither the determination of the proper<br />
sub-layer velocity nor the differences in layer thickness. As can be seen from Fig. 2.33, the<br />
intercept times, the cross-over distances <strong>and</strong> the apparent horizontal velocities for the<br />
critically refracted head-waves differ when observed down-dip or up-dip from the source<br />
although their total travel times to a given distance from the source remain constant.
2.5 <strong>Seismic</strong> rays, travel times, amplitudes <strong>and</strong> phases<br />
Therefore, especially in controlled-source seismology, countershot profiles are deliberately<br />
designed so as to identify changes in layer dip <strong>and</strong> thickness.<br />
Fig. 2.33 Schematic travel-time curves for direct waves <strong>and</strong> head waves in a single-layer<br />
model with inclined lower boundary towards the half-space. Note the difference between updip<br />
<strong>and</strong> down-dip observations (“countershot profile”). t - ic <strong>and</strong> v – 2 are the intercept time <strong>and</strong><br />
related apparent velocity of the down-dip head wave, t + ic <strong>and</strong> v + 2 the respective values for the<br />
up-dip travel-time curve.<br />
For the considered simple one-layer case in Fig. 2.33 the dip angle ϕ <strong>and</strong> the orthogonal<br />
distance h1 to the layer boundary underneath the seismic source on the left can be determined<br />
from the following relations:<br />
<strong>and</strong><br />
2.5.3.6 Wiechert-Herglotz inversion<br />
ϕ = ½ [sin -1 (v1/v - 2) – sin -1 (v1/v + 2)] (2.19)<br />
h1 = ½ t - ic [v1 v2 / √(v2 2 – v1 3 )]. (2.20)<br />
In the case of velocity v = f(z) increasing monotonously with depth z, as in Fig. 2.27, a<br />
continuous travel-time curve is observed because all rays return back to the surface. The<br />
epicentral distance x = D of their return increases with decreasing p, i.e. dx/dp < 0. The<br />
related travel-time curve, with dt/dx > 0 is termed prograde. In this case an exact analytical<br />
solution of the inverse problem exists, i.e., when knowing the apparent horizontal velocity<br />
cx(D) = vo/sinio = dD/dt at any point D, we know the velocity vtp at the turning point of the ray<br />
that returns to the surface at D. Thus we can calculate the depth z(p) = ztp of its turning point.<br />
The following relations were given by Wiechert <strong>and</strong> Herglotz in 1910 for the return distance<br />
D(p) <strong>and</strong> the depth of the turning point z(p) of a given ray:<br />
<strong>and</strong><br />
z(p)<br />
p v(z)<br />
D(p) = 2 ∫<br />
dz<br />
2 2<br />
0 1−<br />
p v(z)<br />
D<br />
35<br />
(2.21)<br />
1 −1<br />
c x (D)<br />
z(p) = cosh d x<br />
π ∫<br />
. (2.22)<br />
c (x)<br />
0 x
2. <strong>Seismic</strong> <strong>Wave</strong> <strong>Propagation</strong> <strong>and</strong> <strong>Earth</strong> <strong>models</strong><br />
Note, however, that the velocity vtp(p) determined from dx/dt at distance x = D does always<br />
relate to the respective depth half way between source <strong>and</strong> station! Nevertheless, practically<br />
all one-dimensional <strong>Earth</strong> <strong>models</strong> have been derived this way assuming that lateral variations<br />
of velocity are negligible as compared to the vertical velocity variations.<br />
2.5.4 Amplitudes <strong>and</strong> phases<br />
2.5.4.1 Energy of seismic waves<br />
The energy density E contained in a seismic wave may be expressed as the sum of kinetic<br />
(Ekin) <strong>and</strong> potential (Epot) energy densities :<br />
E = Ekin + Epot . (2.23)<br />
The potential energy results from the distortion of the material (strain; see. Figs. 2.2 <strong>and</strong> 2.5)<br />
working against the elastic restoring force (stress) while the kinetic energy density is<br />
Ekin = ½ ρ av 2 , (2.24)<br />
where ρ is the density of the material, av = A ω cos(ωt – kx) is the ground-motion particle<br />
velocity, with A - wave amplitude, ω - angular frequency 2πf <strong>and</strong> k - wavenumber. Since the<br />
mean value of cos 2 is ½ it follows for the average kinetic energy density⎺Ekin = ¼ ρ A 2 ω 2 ,<br />
<strong>and</strong> with Ekin = Epot in case of an isotropic stress-strain relationship in a non-dispersive<br />
(closed) system for the average energy density<br />
⎺E = ½ ρ A 2 ω 2 . (2.25)<br />
The energy-flux density per unit of time in the direction of wave propagation with velocity v<br />
is then<br />
Eflux = ½ v ρ A 2 ω 2 (2.26)<br />
<strong>and</strong> the total energy-flux density Eflux through a small surface area dS of the wavefront<br />
bounded by neighboring rays which form a ray tube<br />
Eflux = ½ v ρ A 2 ω 2 dS. (2.27)<br />
When considering only waves with wavelengths being small as compared to the<br />
inhomogeneities of the medium of wave propagation (high-frequency approximation), then<br />
we can assume that the seismic energy only travels along the rays. According to the energy<br />
conservation law, the energy flux within a considered ray tube must remain constant although<br />
the surface area dS of the wavefront related to this ray tube may vary along the propagation<br />
path due to focusing or defocusing of the seismic rays (compare Fig. 2.28). Considering at<br />
different times two surface patches of the propagating wavefront dS1 ≠ dS2, which are<br />
bounded by the same ray tube, <strong>and</strong> assuming that v <strong>and</strong> ρ are the same at these two locations<br />
then<br />
A1/A2 = (dS2/dS1) 1/2 , (2.28)<br />
36
2.5 <strong>Seismic</strong> rays, travel times, amplitudes <strong>and</strong> phases<br />
i.e., the amplitudes vary inversely as the square root of the surface area of the wavefront patch<br />
bounded by the ray tube. Thus amplitudes increase due to ray focusing, which is particularly<br />
strong at caustics (see 2.5.3.2) <strong>and</strong> decrease when the wavefront spreads out.<br />
Also, for a spherical wavefront (e.g., body-wave propagation in a homogeneous isotropic<br />
medium) the surface area grows with r 2 <strong>and</strong> for a cylindrical wavefront (e.g., for surface<br />
waves) with distance r only. Accordingly, the wave-amplitude decay is in the former case ~ r<br />
<strong>and</strong> in the latter case ~ √r. This difference in geometrical spreading is the main reason for the<br />
domination of surface wave amplitudes in seismic records of shallow events (see Fig. 2.23<br />
above <strong>and</strong> Fig. 3.13).<br />
However, wave amplitudes will also change, even in the absence of geometrical spreading,<br />
when density ρ <strong>and</strong> velocity v vary at different locations along the ray path. We then get<br />
A1/A2 = [(ρ2 v2)/(ρ1 v1)/] ½ . (2.29)<br />
The product ρ v is termed the impedance of the material <strong>and</strong> (ρ2 v2)/(ρ1 v1) is the impedance<br />
contrast between the two adjacent media m1 <strong>and</strong> m2. The latter largely controls the reflection<br />
<strong>and</strong> transmission coefficients at the media discontinuity. From Eq. (2.29) it follows that<br />
seismic amplitudes will increase as waves propagate into media of lower density <strong>and</strong> wave<br />
propagation velocity. This has two important implications. On the one h<strong>and</strong>, seismic stations<br />
on hard bedrock tend to record smaller amplitudes <strong>and</strong> thus to slightly underestimate event<br />
magnitudes as compared to stations on average or soft-soil conditions. On the other h<strong>and</strong>,<br />
ground shaking from strong earthquakes is usually more intense on top of unconsolidated<br />
sediments as compared with nearby rock sites. Additionally, reverberations <strong>and</strong> resonance<br />
within the unconsolidated near-surface layers above the basement rocks may significantly<br />
amplify the amplitudes at soft-soil sites. This may increase significantly local seismic hazard.<br />
2.5.4.2 <strong>Wave</strong> attenuation<br />
Amplitudes of seismic waves are not only controlled by geometrical spreading or focusing<br />
<strong>and</strong> by the reflection <strong>and</strong> transmission coefficients that occur at discontinuities. Besides this,<br />
wave amplitudes may be reduced because of energy loss due to inelastic material behavior or<br />
internal friction during wave propagation. These effects are called intrinsic attenuation. Also,<br />
scattering of energy at small-scale heterogeneities along the travel paths may reduce<br />
amplitudes of seismic waves. In the case of such scattering attenuation, however, the<br />
integrated energy in the total wavefield remains constant, while intrinsic attenuation results in<br />
loss of mechanical wave energy, e.g., by transformation into heat. The wave attenuation is<br />
usually expressed in terms of the dimensionless quality factor Q<br />
Q = 2π E/ΔE (2.30)<br />
with ΔE the dissipated energy per cycle. Large energy loss means low Q <strong>and</strong> vice versa, i.e.,<br />
Q is inversely proportional to the attenuation. In a simplified way we can write for the decay<br />
of source amplitude A0 with distance x<br />
37
2. <strong>Seismic</strong> <strong>Wave</strong> <strong>Propagation</strong> <strong>and</strong> <strong>Earth</strong> <strong>models</strong><br />
A 0<br />
A = n<br />
x<br />
ω t<br />
−<br />
2 Q<br />
e<br />
=<br />
A<br />
x<br />
38<br />
π x<br />
−<br />
0 Q T v<br />
e n<br />
=<br />
A −<br />
x<br />
0 e n<br />
ω x<br />
2Q<br />
v<br />
, (2.31)<br />
with A0/x n – the geometrical spreading term, exp(-x t/2Q) = exp(- π/Q T v) the attenuation<br />
term, ω - angular frequency 2π /T, T – period of wave, t – travel time, v – propagation<br />
velocity of wave, <strong>and</strong> n – exponential factor controlled by the kind of geometric spreading.<br />
According to experimental data, n varies between about 0.3 <strong>and</strong> 3, depending also on the type<br />
of seismic wave <strong>and</strong> distance range considered.<br />
In ray theoretical methods, attenuation may be modeled through the use of the parameter t *<br />
that is defined as the integrated value of the travel time divided by 1/Q<br />
* dt<br />
t = ∫ , (2.32)<br />
path →<br />
Q( r )<br />
where →<br />
r is the position vector. We can then write Eq. (2.31) as<br />
A(ω) = A0(ω) e -ω t*/2 . (2.33)<br />
Note, that P-wave attenuation Qα <strong>and</strong> S-wave attenuation Qβ differ. They are related to the<br />
shear attenuation Qμ <strong>and</strong> the bulk attenuation Qκ by the relationships<br />
Qβ = Qμ <strong>and</strong> 1/Qα = 4(β/α) 2 /3Qμ + [1 - 4(β/α) 2 /3]/Qκ. (2.34)<br />
with P-wave velocity α = vp <strong>and</strong> S-wave velocity β = vs. In the <strong>Earth</strong> shear attenuation is<br />
much stronger than bulk attenuation. While Qμ is smallest (<strong>and</strong> thus shear attenuation<br />
strongest) in the upper mantle <strong>and</strong> the inner core, Qκ is generally assumed to be infinite,<br />
except in the inner core. While the P- <strong>and</strong> S-wave velocities are rather well known <strong>and</strong> do not<br />
differ much between different <strong>Earth</strong> <strong>models</strong>, the various model assumptions with respect to<br />
Qα <strong>and</strong> Qβ as a function of depth still differ significantly (see Fig. 2.53). According to the<br />
PREM model, Qμ is 600 for less than 80 km depth. It then drops between 80 <strong>and</strong> 220 km to<br />
80, increases to 143 from 220 to 670 km, <strong>and</strong> is 312 for the lower mantle below 670 km<br />
depth.<br />
In practice, it is difficult to separate intrinsic attenuation <strong>and</strong> scattering Q. Particularly in local<br />
earthquake records, which are strongly affected by scattering on crustal inhomogeneities,<br />
scattering Q dominates. Scattering Q is usually determined from the decay of coda waves<br />
following Sg (SmS) onsets (e.g., Fig. 2.40) <strong>and</strong> is called accordingly Qc. A full discussion on<br />
these topics can be found,e.g., in Aki <strong>and</strong> Richards (1980; pp. 170-182).<br />
In this context it should be mentioned that amplitudes of S waves are generally about five<br />
times larger than those of P waves (see Fig. 2.3). This follows directly from Eq. (3.2) in<br />
Chapter 3 or from the far-field term of the Green’s function when modeling earthquake shear<br />
sources (see Equation (24) in the IS 3.1) taking into account that vP ≈ vS √3 (see this Chapter,<br />
Eq. (2.9)). Also, the periods of S waves are longer than those of P waves, again by at least a<br />
factor of √3, due to the differences in wave propagation velocity <strong>and</strong> the related differences in<br />
the corner frequencies of the P- <strong>and</strong> S-wave source spectrum. Additionally, S waves are much<br />
stronger attenuated than P waves (see following section), thus filtering out higher frequencies<br />
more strongly. It should also be noted that S waves do not propagate in the fluid outer core
2.5 <strong>Seismic</strong> rays, travel times, amplitudes <strong>and</strong> phases<br />
because of vanishing shear modulus (see Fig. 2.53). Therefore, no direct S waves are<br />
observed beyond 100° epicentral distance.<br />
The discussed differences in amplitude-distance relationships have to be compensated by<br />
wave-type dependent calibration functions in order to be able to derive comparable magnitude<br />
values for seismic events based on amplitude readings from different types of seismic waves<br />
(see 3.2).<br />
2.5.4.3 Phase distortions <strong>and</strong> Hilbert transform<br />
As shown in Fig. 2.27 seismic rays will curve in the case of a vertical velocity gradient <strong>and</strong><br />
thus seismic wavefronts will no longer be planar. Nevertheless, locally, between adjacent rays<br />
defining a ray tube, the wavefront still can be considered as a plane wavefront. In the case of<br />
strong gradients, retrograde travel-time branches will develop because rays bend stronger,<br />
cross each other <strong>and</strong> the wavefront folds over itself at the turning point (Fig. 2.34).<br />
Accordingly, a local plane wavefront traveling through a strong vertical velocity gradient will<br />
experience a constant, frequency-independent π/2 phase advance at the turning point. The<br />
envelope of turning points of these crossing bended rays is termed an internal caustic surface.<br />
Because of the -π/2 phase shift the up-going plane wave is the Hilbert transform of the downgoing<br />
wave. More generally, whenever a ray has a non-pure minimum raypath (see 2.5.2) it<br />
touches such a caustic. Consequently, its pulse shape is altered (see Fig. 2.35). Example: The<br />
Hilbert transform of a pure sine wave is a cosine wave. In the case of seismic waves this<br />
phase shift by -π/2 has to be applied to each single frequency represented in the seismic pulse.<br />
This results in the known pulse shape alterations.<br />
Fig. 2.34 In a medium with steep vertical velocity gradient, seismic rays with larger take-off<br />
angles from the source turn back towards the source thus forming a retrograde branch of a<br />
travel-time curve. The crossing of ray paths forms an internal caustic surface that produces a<br />
-π/2 phase shift in the waveforms (according to Choy <strong>and</strong> Richards, 1975; modified from<br />
Shearer, Introduction to Seismology, 1999; with permission from Cambridge University<br />
Press).<br />
Fig. 2.35 Left: a typical seismic pulse; right: its Hilbert transform.<br />
39
2. <strong>Seismic</strong> <strong>Wave</strong> <strong>Propagation</strong> <strong>and</strong> <strong>Earth</strong> <strong>models</strong><br />
Generally, in the case of a steep velocity gradient producing a retrograde travel-time branch,<br />
ray theory predicts that seismic wave arrivals along this branch are Hilbert transformed<br />
compared to the prograde branches. One should note, however, that also in case of relatively<br />
weak vertical velocity gradients, which do not produce a retrograde travel-time branch for the<br />
direct wave, the related reflected phase might nevertheless be Hilbert transformed (see Fig.<br />
2.36 for PP waves). On the other h<strong>and</strong>, when the gradient becomes too steep, or in case of a<br />
first-order velocity step discontinuity, the postcritical reflection coefficients for such an<br />
interface involve a continuous change in phase with ray angle. The phase shift may then<br />
acquire any value other than a constant -π/2 phase shift.<br />
Without exception, all the distorted waveforms bear little or no resemblance to the original<br />
waveforms. Accordingly, neither their onset times (first arrival of energy) nor the relative<br />
position of peaks <strong>and</strong> troughs of the distorted waveforms appear at the times that are<br />
theoretically predicted by ray theory. This biases onset-time picking, related travel-time<br />
determinations as well as waveform correlations between primary <strong>and</strong> Hilbert transformed<br />
phases. Therefore, modern digital data-analysis software can routinely apply the inverse<br />
Hilbert transform to phases distorted by internal caustics. The following major teleseismic<br />
body-wave phases are Hilbert transformed: PP, PS, SP, SS, PKPab, pPKPab, sPKPab,<br />
SKKSac, SKKSdf, P'P', S'S'ac. For the nomenclature of these phases <strong>and</strong> their travel paths see<br />
Fig. 2.42 <strong>and</strong> IS 2.1). ). However, many phases pass caustics several times in the <strong>Earth</strong> <strong>and</strong><br />
then the final pulse shapes are the sum of all internal caustic effects.<br />
Fig. 2.36 Ray paths for the surface reflected phase PP. Note that the rays after the reflection<br />
points cross again <strong>and</strong> form an internal caustic. Accordingly, PP is Hilbert transformed<br />
relative to P <strong>and</strong> additionally has an opposite polarity (phase shift of π) due to the surface<br />
reflection (from Shearer, Introduction to Seismology, 1999; with permission from Cambridge<br />
University Press).<br />
2.5.4.4 Effects not explained by ray theory<br />
As mentioned above, ray theory is a high-frequency approximation that does not cover all<br />
aspects of wave propagation. Although detailed wave-theoretical considerations are beyond<br />
the scope of this Manual we will shortly mention three major phenomena that are of practical<br />
importance <strong>and</strong> not covered by ray theory.<br />
Head waves<br />
As mentioned in 2.5.4.1, seismic waves impinging at a discontinuity between the layers n <strong>and</strong><br />
n+1 with vn < vn+1 under the critical incidence angle ic with sin ic = vn/vn+1 are refracted into<br />
this discontinuity with the angle in+1 = 90°. There they travel along (or just below) this<br />
discontinuity with the velocity vn+1 of the lower faster medium. Such inhomogeneous waves<br />
40
2.5 <strong>Seismic</strong> rays, travel times, amplitudes <strong>and</strong> phases<br />
are usually referred to as head waves. They have the unique property to transmit energy back<br />
into the upper medium at exactly the critical angle ic. However, the amplitudes of true headwave<br />
are rather small as compared to direct, reflected or converted waves. The travel-time<br />
curve of a head wave is a straight line with the slope of 1/vn+1 (see Fig. 2.32). This provides a<br />
convenient <strong>and</strong> direct measure of the sub-discontinuity velocity. Head waves are of particular<br />
importance for crustal studies <strong>and</strong> in the analysis of seismic records from local <strong>and</strong> regional<br />
seismic events (see 2.6.1).<br />
<strong>Seismic</strong> Diffraction<br />
Diffraction, analog to optics, is the phenomenon of transmission of energy by non-geometric<br />
ray paths. In optics, the classic example is the diffraction of light “leaking” around the edge of<br />
an opaque screen. In seismology, diffraction occurs whenever the radius of curvature of a<br />
reflecting interface is less than a few wavelengths of the propagating wave. <strong>Seismic</strong><br />
diffraction is important for example in steep-angle reflection data in the presence of sharp<br />
boundaries. But there are also long-period diffracted waves such as Pdif <strong>and</strong> Sdif which are<br />
“bended” around the core-mantle boundary into the core shadow zone beyond about 100°<br />
epicentral distance. Only little short-period P- <strong>and</strong> S-wave energy is observed in this shadow<br />
zone. In fact, the edge of a discontinuity/impedance contrast acts like a secondary source<br />
according to Huygen’s principle <strong>and</strong> radiates energy forward in all directions.<br />
Diffractions can also be understood from the st<strong>and</strong>point of Fresnel zones. This concept states<br />
that waves are not only reflected at a considered point of the discontinuity (like a seismic ray)<br />
but also from a larger surrounding area. The radius of the so-called first Fresnel zone is about<br />
½ wavelength around a considered ray arriving at a station, i.e., the range within which<br />
reflected energy might interfere constructively. The wavelength-dependent width of this<br />
Fresnel zone also determines the geometrical resolution of objects/impedance contrasts that<br />
can be at best achieved by seismic (or optical) methods.<br />
Since the real <strong>Earth</strong> may significantly deviate from simplified global one-dimensional <strong>models</strong>,<br />
scattering <strong>and</strong> diffraction effects render not only amplitudes but also travel times of more lowfrequency<br />
waves sensitive to the 3-D structure off the seismic rays. This has to be taken into<br />
account when making use of recent developments of automated travel-time measurement<br />
techniques which use cross-correlation of observed body wave phases in digital broadb<strong>and</strong><br />
records with the corresponding synthetic phases possible in spherical <strong>Earth</strong>. Marquering et al.<br />
(1999) showed that for an SS wave observed at an epicentral distance of 80°, near-surface<br />
heterogeneities situated more than 15° from the bounce point at 40° can exert a significant<br />
influence upon the travel time of an SS wave. They conclude that geometrical ray theory,<br />
which has been a cornerstone of seismology for about a century <strong>and</strong> proven useful in most<br />
practical applications, including earthquake location <strong>and</strong> tomography, is, however, valid only<br />
if the scale length of the 3-D heterogeneities is much greater than the seismic wavelengths. In<br />
other words, the validity of ray theory is based on a high-frequency (short-period)<br />
approximation. However, intermediate-period <strong>and</strong> long-period seismic waves, with<br />
wavelength of the order of 100 – 1000 km, already have comparable scale lengths with 3-D<br />
anomalies in current global tomographic <strong>models</strong>. When investigating smaller 3-D structures<br />
<strong>and</strong> applying new methods of waveform correlation, these wave-theoretical considerations<br />
gain growing importance, probably even in future observatory routines.<br />
Scattering of seismic waves<br />
Often the primary arrivals are followed by a multitude of later arrivals that can not be<br />
explained by simple 1-D <strong>models</strong> (Fig. 2.37). The complex wave train following the primary<br />
41
2. <strong>Seismic</strong> <strong>Wave</strong> <strong>Propagation</strong> <strong>and</strong> <strong>Earth</strong> <strong>models</strong><br />
arrival is called coda. Coda arrivals are produced by scattering, that is, the wavefield’s<br />
interaction with small-scale heterogeneities. Heterogeneity at different length scales is present<br />
almost universally inside the <strong>Earth</strong>. <strong>Seismic</strong> coda waves can be used to infer stochastic<br />
properties of the medium, i.e., scale amplitude of the average heterogeneities <strong>and</strong> to estimate<br />
coda Qc which is particularly needed for correcting source spectra prior to deriving spectral<br />
source parameters from records of local events (see exercise EX 3.4).<br />
Fig. 2.37 Three-component seismogram of a local, 100 km deep earthquake recorded at a<br />
portable station on the active volcano Lascar in northern Chile. The P-wave arrival is<br />
followed by coda waves produced by heterogeneous structure in the vicinity of the volcano<br />
(courtesy of B. Schurr, 2001).<br />
2.6 <strong>Seismic</strong> phases <strong>and</strong> travel times in the real <strong>Earth</strong><br />
The basic types of horizontally propagating seismic surface waves (Rayleigh waves, Love<br />
waves, <strong>and</strong> their higher modes; see 2.3) remain more or less unchanged with growing<br />
distance. Surface waves, however, do not form seismic phases (wavelets) with well-defined<br />
onsets <strong>and</strong> duration but rather dispersed wave trains. Due to the dispersion their duration<br />
increases with distance. Occasionally, surface wave trains of relatively high frequencies, as<br />
generated by shallow local events, may additionally be prolonged significantly due to lateral<br />
reverberations when propagating through strong lateral velocity contrasts in the crust (see Fig.<br />
2.38). This phenomenon was used by Meier et al. (1997) to establish a tomography with<br />
reflected surface waves.<br />
In contrast, seismic body waves, which propagate three-dimensionally, are more strongly<br />
affected then surface waves by refraction, reflection <strong>and</strong> mode conversion at the main<br />
impedance contrasts in the radial direction of the <strong>Earth</strong>. This gives rise, with growing<br />
distance, to the appearance of more <strong>and</strong> more secondary seismic body-wave phases following<br />
the direct P- <strong>and</strong> S-wave arrivals in seismic records. And since body waves show no<br />
dispersion in the considered frequency range below a few Hz these phases can usually be well<br />
observed <strong>and</strong> discriminated from each other as long as their travel-time curves do not overlap.<br />
42
2.6 <strong>Seismic</strong> phases <strong>and</strong> travel times in real <strong>Earth</strong><br />
All of these secondary phases have a special story to tell about the geometrical <strong>and</strong> physical<br />
properties of the discontinuities which they encountered during their travel through the<br />
<strong>Earth</strong>’s interior <strong>and</strong> which have shaped their waveforms <strong>and</strong> influenced their amplitude <strong>and</strong><br />
frequency content. Therefore, the proper identification <strong>and</strong> parameter or waveform reporting<br />
about later phases in seismic records to relevant data centers is an important duty of<br />
seismological observatories. In addition, the complementary use of secondary phases<br />
significantly improves the precision <strong>and</strong> accuracy of seismic event locations, their source<br />
depth in particular (see Figure 7 in IS 11.1). In the following, we will introduce the main<br />
types of seismic body-wave phases that can generally be observed at local, regional <strong>and</strong><br />
teleseismic distance ranges. They should be recognized <strong>and</strong> reported by the personnel at<br />
seismic observatories or data analysis centers. Basic features of their travel-time curves,<br />
polarization <strong>and</strong> frequency range of observation, which can guide their identification, will be<br />
presented.<br />
Fig. 2.38 Ray paths of surface waves (broken lines) from a mining collapse (star) to several<br />
seismic stations in the eastern part of Germany. Note: Records at stations along travel paths<br />
that have not or only once crossed some of the main tectonic faults in the area, are rather<br />
short. They have only one surface-wave maximum. In contrast, at station PRW, which is at<br />
the same epicentral distance as HAL, the seismic record is about four times longer <strong>and</strong> shows<br />
four surface-wave groups due to multiple reflections at several pronounced fault systems<br />
(compiled from data provided by H. Neunhöfer (1985; <strong>and</strong> personal communication)).<br />
2.6.1 <strong>Seismic</strong> phases <strong>and</strong> travel times from local <strong>and</strong> regional seismic events<br />
<strong>Seismic</strong> waves arriving at stations at local distances of up to about 150 km or regional<br />
distances of up to about 15° (1° = 111.2 km) from the seismic source have traveled<br />
exclusively or dominatingly through the crust or the sub-crustal uppermost mantle. The crust<br />
varies strongly in its thickness (see Fig. 2.10), petrologic composition <strong>and</strong> internal structure<br />
43
2. <strong>Seismic</strong> <strong>Wave</strong> <strong>Propagation</strong> <strong>and</strong> <strong>Earth</strong> <strong>models</strong><br />
due to folding <strong>and</strong> faulting processes in the past. The resulting strong heterogeneities in its<br />
physical properties at scale length of several decameters to several km cause intensive<br />
scattering of P <strong>and</strong> S waves in the typical frequency range for the recording of near seismic<br />
events (about 0.5 to 50 Hz). Therefore, primary wave onsets are usually followed by signalgenerated<br />
noise or coda waves that make it difficult to identify later seismic phases reflected<br />
or refracted from weaker intra-crustal discontinuities. It is usually only the significant velocity<br />
increase of about 20% at the base of the crust towards the upper mantle (Mohorovičić<br />
discontinuity, or Moho for short), which produces first or later wave onsets besides the direct<br />
P <strong>and</strong> S waves that are strong enough to be recognizable above the ambient or signalgenerated<br />
noise level. Only in some continental regions may an intermediate discontinuity,<br />
named the Conrad discontinuity after its discoverer, produce recognizable critically refracted<br />
(Pb = P*; Sg = S*) or reflected waves (see Fig. 2.39). Accordingly, for purposes of routine<br />
seismological observatory practice, it is usually sufficient to represent the crust as a horizontal<br />
one-layer model above the half-space (upper mantle).<br />
The currently most common global 1-D <strong>Earth</strong> model IASP91 (Kennett <strong>and</strong> Engdahl, 1991;<br />
see 2.7) assumes a homogeneous 35 km thick two-layer crust with the intermediate crustal<br />
discontinuity at 20 km depth. The respective average velocities for the upper <strong>and</strong> lower crust<br />
<strong>and</strong> the upper mantle are for P waves 5.8 km/s, 6.5 km/s <strong>and</strong> 8.04 km/s, <strong>and</strong> for S waves 3.36<br />
km/s, 3.75 km/s <strong>and</strong> 4.47 km/s, respectively. The impedance contrast at the Conrad<br />
discontinuity <strong>and</strong> the Moho is about 1.3. Fig. 2.39 is a simplified depiction of such a twolayer<br />
crust <strong>and</strong> of the seismic rays of the main crustal/upper mantle phases to be expected.<br />
These are: Pg, Sg, Pb, Sb, Pn, Sn, PmP <strong>and</strong> SmS. For a detailed definition of the named<br />
phases see IS 2.1.<br />
Fig. 2. 39 A simplified model of the crust showing the ray traces of the main “crustal<br />
phases” observed for near (local <strong>and</strong> regional) earthquakes. Note: P* = Pb <strong>and</strong> S* = Sg.<br />
The apparent horizontal velocity of the reflected PmP <strong>and</strong> SmS waves varies with distance<br />
according to their changing incidence angle on the surface. Their travel-time branches form<br />
hyperbolae that approach asymptotically the travel-time curves for Pg <strong>and</strong> Sg(or Pb <strong>and</strong> Sb)<br />
with increasing distance (see Fig. 2.40). Note that Pn <strong>and</strong> head waves have usually smaller<br />
amplitudes than Pg <strong>and</strong> Sg, at least for distances up to about 300 km. Pn can be usually<br />
identified above the noise level only when it becomes the P-wave first arrival. At larger<br />
distances, because of the stronger attenuation of upper crustal Pg <strong>and</strong> Sg <strong>and</strong> with Pn <strong>and</strong> Sn<br />
being less attenuated upper mantle diving phases, Pn <strong>and</strong> Sn may become clear P <strong>and</strong> S first<br />
arrivals (see Fig. 2.15). Beyond the critical point (at about 70-80 km distance for an average<br />
44
2.6 <strong>Seismic</strong> phases <strong>and</strong> travel times in real <strong>Earth</strong><br />
crust) the supercritically reflected waves PmP <strong>and</strong> SmS have generally the largest<br />
amplitudes, however, arriving always closely after Pg <strong>and</strong> Sg, their onset times can usually<br />
not be picked reliably enough as to be of value for earthquake location. Therefore, these<br />
phases are usually not explicitly reported in routine observatory practice. However, reporting<br />
of Pg, Sg, Pn <strong>and</strong> Sn, if recognizable, is a must. This also applies to the reporting of the<br />
maximum amplitudes in records of near seismic events for the determination of local<br />
magnitudes Ml (see 3.2.4). Depending on source depth too, this amplitude maximum may be<br />
related to Sg/SmS, Lg, or Rg (see Figs. 2.15, 2.16 <strong>and</strong> 2.40).<br />
Travel-time curves for the phases Pn, Pg, Sn, Sg <strong>and</strong> Lg for distances up to 400 km are given<br />
in Figure 4 of Exercise EX 11.1. These curves relate to an average single-layer crust for<br />
Central Europe. From the global <strong>Earth</strong> model IASP91, given in Datasheet DS 2.1, one may<br />
calculate respective travel-time curves for a two-layer crustal model. However, such global<br />
crustal travel-time curves may not be representative at all for certain regions <strong>and</strong> may serve as<br />
a starting model only to work with. It is one of the main tasks of operators of local <strong>and</strong><br />
regional seismic networks to derive from their own carefully analyzed data of near events not<br />
only local/regional magnitude calibration functions (see 3.2.4) but also average local/regional<br />
travel-time curves. The latter will not only allow significantly improved seismic event<br />
locations but may later serve also as starting <strong>models</strong> for 3-D tomographic studies of crustal<br />
heterogeneities.<br />
Fig. 2.40 shows real short-period seismic network records of two local earthquakes in<br />
Switzerl<strong>and</strong> in the distance range between about 10 km <strong>and</strong> 180 km along different profiles<br />
together with the modeling of their reduced travel-time curves <strong>and</strong> inferred structural profiles.<br />
While one event was at a depth of only 5 km, the other event was about 30 km deep. The first<br />
one was observed by stations situated up-dip while the latter event was observed down-dip.<br />
One sees striking differences in the shape <strong>and</strong> gradient of the travel-time curves <strong>and</strong> in the<br />
crossover distance between Pg <strong>and</strong> Pn, in particular. In the case of the deeper event near to the<br />
Moho, Pn becomes the first arrival beyond 70 km distance, whereas for the shallower event<br />
Pn outruns Pg only at more than 130 km epicentral distance. In both cases Pg (Sg) <strong>and</strong>/or<br />
PmP (SmS) are the prominent P <strong>and</strong> S arrivals. The Pn first arrivals are relatively small. No<br />
Pb, Sb or reflected waves from a mid-crustal discontinuity are recognizable in Fig. 2.40.<br />
Note, however, that depending on the orientation of the earthquake rupture <strong>and</strong> thus of the<br />
related radiation characteristic of the source, it may happen that a maximum of energy is<br />
radiated in the direction of the Pn ray <strong>and</strong> a minimum in the direction of the Pg ray. Then the<br />
usual relationship APn < APg may be reversed (examples are given in 11.5.1).<br />
Misinterpretation of Pn as Pg or vice versa may result in large errors of event location.<br />
Therefore, one should have at least a rough idea at which distance in the region under study,<br />
depending on the average crustal thickness <strong>and</strong> velocity, one may expect Pn to become the<br />
first arrival. A “rule-of-thumb” for calculating the crossover distance xco is given in Equation<br />
(6) of IS 11.1. For an average single-layer crust <strong>and</strong> a surface source, xco ≈ 5 zm with zm –<br />
Moho depth. However, as demonstrated with Fig. 2.40, xco is only about half as large for near<br />
Moho earthquakes <strong>and</strong> also the dip of the Moho <strong>and</strong> the direction of observation (up- or<br />
downdip) does play a role. Yet, lower crustal earthquakes are rare in a continental (intraplate)<br />
environment. Mostly they occur in the upper crust.<br />
Rules-of-thumb for calculating the source distance from the travel-time differences Sg-Pg <strong>and</strong><br />
Sn-Pn are given in Eqs. (11.1) <strong>and</strong> (11.2).<br />
45
2. <strong>Seismic</strong> <strong>Wave</strong> <strong>Propagation</strong> <strong>and</strong> <strong>Earth</strong> <strong>models</strong><br />
Fig. 2.40 Records (above) of two regional earthquakes of Oct. 9, 1986 at Sierre (left) <strong>and</strong> of<br />
July 7, 1985 at Langenthal, Switzerl<strong>and</strong> together with the calculated reduced travel-time<br />
curves (middle) <strong>and</strong> ray-tracing crustal <strong>models</strong> which best fit the observations (below),<br />
redrawn <strong>and</strong> complemented from Anatomy of Seismograms, Kulhánek, plate 4, pp. 83-84, ©<br />
1990 (with permission from Elsevier Science).<br />
Sometimes, very strong onsets after Pg, well before Sn or Sg can be expected, may be related<br />
to depth phases (e.g., sPmP; Bock et al., 1996). This may complicate proper interpretation of<br />
the local phases as well <strong>and</strong> can usually not be solved in routine analysis. Also be aware that<br />
in the case of sub-crustal earthquakes, which are common in subduction zones, none of the<br />
crustal phases discussed above exist. In this case, the first arriving longitudinal <strong>and</strong> shear<br />
wave onsets are termed P <strong>and</strong> S, respectively, as for teleseismic events (see Fig. 2.41).<br />
Fig. 2.41 P- <strong>and</strong> S-wave onsets from a local earthquake in northern Chile at a depth of 110<br />
km <strong>and</strong> a hypocentral distance of about 240 km (courtesy of B. Schnurr, 2001).<br />
46
2.6 <strong>Seismic</strong> phases <strong>and</strong> travel times in real <strong>Earth</strong><br />
2.6.2 <strong>Seismic</strong> phases <strong>and</strong> travel times at teleseismic distances<br />
<strong>Seismic</strong> waves arriving at distances beyond 10° up to about 30° have mainly traveled through<br />
the upper mantle (from Moho to about 410 km depth) <strong>and</strong> the transition zone to the lower<br />
mantle (between about 410 km <strong>and</strong> 660 km depth). The strong discontinuities which mark the<br />
upper <strong>and</strong> lower boundary of the transition zone are associated with strong increases in<br />
seismic impedance (i.e., of both velocity <strong>and</strong> density; see Fig. 2.53). This results in two<br />
remarkable triplications of the travel-time curve for P waves (see Fig. 2.30) <strong>and</strong> S waves,<br />
which give rise to complicated short-period waveforms of P <strong>and</strong> S with rather long duration<br />
(up to about 10 <strong>and</strong> more seconds) <strong>and</strong> consisting of a sequence of successive onsets with<br />
different amplitudes.<br />
For epicentral distances D > 30° P <strong>and</strong> S waves are followed by an increasing number of<br />
secondary waves, mainly phases, which have been reflected or converted at the surface of the<br />
<strong>Earth</strong> or at the core-mantle boundary. Fig. 2.42 depicts a typical collection of possible<br />
primary <strong>and</strong> secondary ray paths together with a three-component seismic record at a distance<br />
of D = 112.5° that relates to the suit of seismic rays shown in red in the upper part of the cross<br />
section through the <strong>Earth</strong>. The phase names are st<strong>and</strong>ardized <strong>and</strong> in detail explained in IS 2.1<br />
Fig. 2.42 Top: <strong>Seismic</strong> ray paths through the mantle (M), outer core (OC) <strong>and</strong> inner core<br />
(IC) of the <strong>Earth</strong> (above) with the respective phase symbols according to the international<br />
nomenclature (see IS 2.1, also for detailed ray tracing). Full lines: P rays: broken lines: S rays.<br />
Related travel-time curves are given in Fig. 2.46 <strong>and</strong> the transparency to Fig. 2.48. Red rays<br />
relate to the 3-component Kirnos SKD broadb<strong>and</strong> seismograms recorded at station MOX,<br />
Germany (bottom) of body-waves from an earthquake at an epicentral distance of 112.5°.<br />
47
2. <strong>Seismic</strong> <strong>Wave</strong> <strong>Propagation</strong> <strong>and</strong> <strong>Earth</strong> <strong>models</strong><br />
In the case of deep earthquakes the direct P wave that leaves the source downward will arrive<br />
at a teleseismic station first. It will be followed, depending on the source depth, up to about<br />
4.5 min later by other phases that has left the source upward. These phases, reflected <strong>and</strong><br />
eventually converted at the free surface of the <strong>Earth</strong> or an ocean bottom (e.g., pP, sP, pPP,<br />
sPP, pPKP, etc.), at the free surface of the ocean (e.g., pwP) or from the inner side of the<br />
Moho (e.g., pmP) are the so-called depth phases. Their proper identification, onset-time<br />
picking <strong>and</strong> reporting is of crucial importance for reliable determination of source depth (see<br />
6.1 <strong>and</strong> Figure 7 in Information Sheet 11.1). Differential travel-time tables pP-P <strong>and</strong> sP-P are<br />
given in the Exercise EX 11.2. For the definition of these phases see also IS 2.1.<br />
Fig. 2.43 Left: Different ray paths of a direct teleseismic P wave <strong>and</strong> of its depth phases.<br />
Right: Records of depth phases of the May 24, 1991 Peru earthquake (hypocentral depth h =<br />
127 km); a) broadb<strong>and</strong> record <strong>and</strong> b) simulated short-period recording (the right figure is a<br />
corrected cutout of Fig. 6.4 of Lay <strong>and</strong> Wallace, Modern Global Seismology, p. 205, © 1995;<br />
with permission of Elsevier Science (USA).<br />
However, the identification of depth phases is rather difficult for shallow crustal earthquakes<br />
because their onsets follow rather close to the direct phase, thus superposing with their<br />
wavelets. They may, however, be discriminated by waveform modeling with variable source<br />
depth (see subchapter 2.8, Fig. 2. 56).<br />
Between about 30° <strong>and</strong> 100° epicentral distance P <strong>and</strong> S have traveled through the lower<br />
mantle, which is characterized by a rather smooth positive velocity <strong>and</strong> density gradient (see<br />
Fig. 2.53). In this distance range, seismograms are relatively clearly structured with P <strong>and</strong> S<br />
(or beyond 80° with SKS) being the first, prominent longitudinal <strong>and</strong> transverse wave<br />
arrivals, respectively, followed by multiple surface <strong>and</strong> core-mantle boundary (CMB)<br />
reflections or conversions of P <strong>and</strong> S such as PP, PS, SS <strong>and</strong> PcP, ScP etc. (see Fig. 2.42 <strong>and</strong><br />
2.48 with overlay). Within about 15 to 35 min after the first P arrival multiple reflections of<br />
PKP from the inner side of the CMB (PKKP; P3KP) or from the surface (PKPPKP = P'P')<br />
may be recognizable in short-period seismic records. Their ray traces are shown in Fig. 2.44<br />
<strong>and</strong> many more, with record examples, in 11.5.3.<br />
48
2.6 <strong>Seismic</strong> phases <strong>and</strong> travel times in real <strong>Earth</strong><br />
Fig. 2.44 Ray paths of PKKP <strong>and</strong> P'P' (= PKPPKP) with respect to the direct P phase<br />
(courtesy of S. Wendt, 2001).<br />
Beyond 100°, only P-wave rays, which entered the outer core after strong downward<br />
refraction, will reach the surface. This is due to the dramatic reduction of the P-wave velocity<br />
at the CMB from about 13.7 km/s in the lowermost mantle to 8.0 km/s in the upper outer core.<br />
Thus, P waves form a core shadow. However, long-period P-wave energy is diffracted around<br />
the CMB into this shadow zone. According to the new IASPEI nomenclature of phase names<br />
(see IS 2.1) the diffracted P wave is termed Pdif, however the old phase symbol Pdiff is still<br />
widely used.<br />
The amplitudes of Pdif are comparably small thus making PP the strongest longitudinal<br />
arrival up to nearly 144° (see Figs. 2.42, 2.55, 11.60 <strong>and</strong> 11.61). PKP has a caustic at 145°<br />
causing strong amplitudes comparable with those of P at much shorter distances around 50°<br />
(see Fig. 3.13) <strong>and</strong> separates into different branches beyond the caustic (see Figs. 2.45, 11.62<br />
<strong>and</strong> 11.63).<br />
In more detail, the types of seismic phases appearing in the various distance ranges <strong>and</strong> their<br />
peculiarities are discussed in Chapter 11 where many record examples are given both in the<br />
main text <strong>and</strong> in complementary Datasheets (DS 11.1 to11.3).<br />
49
2. <strong>Seismic</strong> <strong>Wave</strong> <strong>Propagation</strong> <strong>and</strong> <strong>Earth</strong> <strong>models</strong><br />
Fig. 2.45 Short-period (left) <strong>and</strong> long-period (right) seismograms for the Mid-Indian Rise<br />
earthquake on May 16, 1985 (M = 6.0, h = 10 km) in the range D = 145.6° to 173.2°. (From<br />
Kulhánek, Anatomy of Seismograms, plate 55, pp. 165-166, ©1990; with permission from<br />
Elsevier Science). Note: The figure above gives still the old names of the core phases.<br />
According to the new IASPEI phase names PKP2 should be replaced by PKPab, PKP1 by<br />
PKPbc <strong>and</strong> PKIKP by PKPdf (see IS 2.1, also for the detailed ray tracing of these phases).<br />
The first discernable motion of a seismic phase in the record is called the arrival time <strong>and</strong> the<br />
measurement of it is termed picking of the arrival (see 11.2.2). Up to now, arrival time<br />
picking <strong>and</strong> reporting to international data centers is one of the major operations of data<br />
analysts at seismic stations or network centers. Plotting the time differences between reported<br />
arrival times <strong>and</strong> calculated origin times over the epicentral distance, seismologists were able<br />
to construct travel-time curves for the major phases <strong>and</strong> to use them to infer the average radial<br />
velocity structure of the <strong>Earth</strong> (see 2.7). In Fig. 2.46 (left) more than five million travel-time<br />
picks, archived by the International Seismological Centre (ISC) for the time 1964 to 1987,<br />
have been plotted. Most time picks align nicely to travel-time curves, which match well with<br />
the travel-time curves theoretically calculated for major seismic phases on the basis of the<br />
IASP91 model (Fig. 2.46 right).<br />
50
2.6 <strong>Seismic</strong> phases <strong>and</strong> travel times in real <strong>Earth</strong><br />
Fig. 2.46 Left: Travel-time picks collected by the ISC between 1964 <strong>and</strong> 1987 for events<br />
shallower than 50 km. (From Shearer, Introduction to Seismology, 1999; with permission<br />
from Cambridge University Press). Right: IASP91 travel-time curves for surface focus (from<br />
Kennett, 1991).<br />
An even more complete picture of the entire seismic wavefield may nowadays be obtained by<br />
stacking data from modern digital seismic networks. For this, records at common sourcereceiver<br />
ranges are averaged to produce a composite seismogram. Stacks of almost 100,000<br />
seismograms from the global digital networks are plotted in Fig. 2.47 (for short-period<br />
records with periods T < 2s) <strong>and</strong> Fig. 2.48 (for long-period records with T > 10 s). Although<br />
the arrivals appear sharper at higher frequencies, much fewer later phases can be<br />
distinguished in short-period records. The late arriving reflected core phases P'P' (PKPPKP),<br />
PKKP, however, <strong>and</strong> higher multiples of them, are discernable in short-period records only.<br />
Note that the relative darkness with which the “curves” appear against the gray background is<br />
a measure of the relative frequency with which these phases can be observed above the noise<br />
level. The transparent overlays to the figures give the nomenclature for the visible phases in<br />
these stacks together with the more complete calculated travel-time curves according to the<br />
IASP91 velocity model (Kennett <strong>and</strong> Engdahl, 1991). They match very well.<br />
51
2. <strong>Seismic</strong> <strong>Wave</strong> <strong>Propagation</strong> <strong>and</strong> <strong>Earth</strong> <strong>models</strong><br />
Fig. 2.47 A stack of short-period filtered (
Overlay to Fig. 2.47<br />
2.6 <strong>Seismic</strong> phases <strong>and</strong> travel times in real <strong>Earth</strong><br />
53
2. <strong>Seismic</strong> <strong>Wave</strong> <strong>Propagation</strong> <strong>and</strong> <strong>Earth</strong> <strong>models</strong><br />
Overlay to Figs. 2.48 <strong>and</strong> 2.49<br />
54
2.6 <strong>Seismic</strong> phases <strong>and</strong> travel times in real <strong>Earth</strong><br />
Fig. 2.48 A stack of long-period (> 10 s), vertical component data from the global networks<br />
between 1988 <strong>and</strong> 1994. See the overlay for the phase names <strong>and</strong> for the travel-time curves<br />
calculated for all types of phases (see also Fig. 2.49) using the IASP91 model (Kennett <strong>and</strong><br />
Engdahl, 1991) (from Astiz et al., Global Stacking of Broadb<strong>and</strong> Seismograms, Seismological<br />
Research Letters, Vol. 67, No. 4, p. 14, © 1996; with permission of Seismological Society of<br />
America).<br />
55
2. <strong>Seismic</strong> <strong>Wave</strong> <strong>Propagation</strong> <strong>and</strong> <strong>Earth</strong> <strong>models</strong><br />
Fig. 2.49 Global travel-time curves for shallow earthquakes as produced by stacking<br />
broadb<strong>and</strong> seismograms. <strong>Seismic</strong> phases are shown in different colors depending on their<br />
polarization (blue: vertical motion; green: radial-horizontal; <strong>and</strong> red: transverse-horizontal)<br />
(courtesy of L. Astiz).<br />
Additionally, Fig. 2.49 reveals that the polarization of these various phases differs. While all<br />
primary longitudinal phases <strong>and</strong> all from P or K to S converted phases <strong>and</strong> vice versa appear<br />
56
57<br />
2.7 Global <strong>Earth</strong> <strong>models</strong><br />
on vertical <strong>and</strong> radial-horizontal components only, multiple reflected S waves, which lose<br />
with each reflection more <strong>and</strong> more of their SV polarized energy due to conversion into P (or<br />
K at the CMB), become more <strong>and</strong> more transversely polarized. Primary S, however, has<br />
significant energy on both horizontal components that are oriented either parallel to the<br />
backazimuth to the source (radial) or perpendicular to it (transverse). Direct P waves,<br />
polarized in the direction of ray propagation, have in the teleseismic range dominating vertical<br />
components because of their steep incidence angle, which gets smaller <strong>and</strong> smaller with<br />
increasing distance (see e.g., PKP phases). PP, P3 <strong>and</strong> higher multiples may, however, have<br />
significant energy in the radial component too. These examples illustrate that the visibility<br />
<strong>and</strong> discrimination of body wave phases in seismic records depends on their relative<br />
amplitude, polarization <strong>and</strong> frequency content. All of these criteria have to be taken into<br />
account, besides the differences in travel-times, when analyzing seismic records.<br />
2.7 Global <strong>Earth</strong> <strong>models</strong><br />
In the first part of the 20th century travel-time <strong>models</strong> for seismic phases, empirically derived<br />
from historical data, were rudimentary at best. One of the earliest travel-time model, the<br />
Zoeppritz tables (Zoeppritz, 1907) were applied by Herbert Hall Turner in a version as<br />
published by Galitzin (1914) to locate earthquakes for the ‘Bulletin of the British Association<br />
of the Advancement of Science, Seismology Committee’ for the years 1914 until 1917.<br />
During the 1920s, Turner gradually exp<strong>and</strong>ed these tables for newly discovered phases <strong>and</strong><br />
better phase observations, often suggested <strong>and</strong> derived by Beno Gutenberg. These Zoeppritz-<br />
Turner tables were in use to locate earthquakes for the International Seismological Summary<br />
(ISS) from 1918 to 1929. This situation greatly improved with the introduction of the<br />
Jeffreys-Bullen (J-B) tables (Jeffreys <strong>and</strong> Bullen, 1940), which provided a complete,<br />
remarkably accurate representation of P, S <strong>and</strong> other later-arriving phases. Like the<br />
Gutenberg-Richter travel-time tables, the J-B tables were developed in the 1930s using<br />
reported arrival times of seismic phases from a sparse global network of stations, many of<br />
which often had poor time-keeping. Once the travel times of the main phases had been<br />
compiled, smoothed empirical representations of these travel times were inverted using the<br />
Herglotz-Wiechert method to generate a velocity model. The travel times for other phases<br />
were then determined directly from the velocity model. As a testament to the careful work<br />
that went into producing the J-B tables, they are still being used by the International<br />
Seismological Centre (ISC) <strong>and</strong> by the U. S. Geological Survey National <strong>Earth</strong>quake<br />
Information Center (NEIC) for routine earthquake location.<br />
Although the limitations of the J-B tables were known for some time, it was not until the early<br />
1980´s that a new generation of <strong>models</strong> was constructed in a completely different way.<br />
Instead of establishing smoothed, empirical representations of phase-travel times, inverse<br />
modeling was used to construct one-dimensional <strong>models</strong> for structure that fit phase travel<br />
times reported in the ISC Bulletin since 1964 <strong>and</strong> other parametric data. The Preliminary<br />
Reference <strong>Earth</strong> Model (PREM) of Dziewonski <strong>and</strong> Anderson (1981) was the most important<br />
member of this generation of new global 1-D <strong>models</strong>. However, PREM was constructed to fit<br />
both body-wave travel-time <strong>and</strong> normal-mode data, so it was not generally thought to be<br />
especially useful for earthquake location. In fact, soon afterwards Dziewonski <strong>and</strong> Anderson<br />
(1983) published a separate analysis of just P waves in an effort to produce an improved<br />
travel-time table.
2. <strong>Seismic</strong> <strong>Wave</strong> <strong>Propagation</strong> <strong>and</strong> <strong>Earth</strong> <strong>models</strong><br />
In 1987 the International Association of Seismology <strong>and</strong> Physics of the <strong>Earth</strong>’s Interior<br />
(IASPEI) initiated a major international effort to construct new global travel-time tables for<br />
earthquake location <strong>and</strong> phase identification. As a result of this effort two <strong>models</strong> were<br />
developed: IASP91 (Kennett <strong>and</strong> Engdahl, 1991); <strong>and</strong> SP6 (Morelli <strong>and</strong> Dziewonski, 1992).<br />
Although differences in predicted travel times between these two <strong>models</strong> were small, some<br />
effort was still required to reconcile the travel times of some important, well-observed seismic<br />
phases before either of these <strong>models</strong> could be used by the ISC <strong>and</strong> NEIC for routine<br />
earthquake location. The upper mantle part of the IASP91 model was fitted to summary P <strong>and</strong><br />
S wave travel times, binned in 1° intervals of epicentral distance, published by Dziewonski<br />
<strong>and</strong> Anderson (1981, 1983) (Fig. 2.50).<br />
Fig. 2.50 Fitting of IASP91 upper mantle travel times as a function of epicentral distance to<br />
the summary first-arrival travel times of P (top) <strong>and</strong> S waves (bottom) according to<br />
Dziewonski <strong>and</strong> Anderson (1981, 1983) in time-reduced presentation (from Kennett <strong>and</strong><br />
Engdahl, 1991).<br />
58
59<br />
2.7 Global <strong>Earth</strong> <strong>models</strong><br />
As shown in Fig. 2.51, the IASP91 upper mantle differed substantially from PREM <strong>and</strong>, in<br />
particular, IASP91 had no mantle low-velocity zone for either P or S waves. Although this did<br />
run counter to the prevailing ideas about upper mantle structure, it did have a practical<br />
advantage for locating events because the upper mantle travel times in IASP91 were not<br />
discontinuous. Characteristics of the main upper mantle discontinuities were also different<br />
from previous <strong>models</strong>. In IASP91 the 210 km discontinuity was essentially absent. The 410<br />
km <strong>and</strong> 660 km discontinuity velocity jumps in IASP91 were slightly greater in amplitude<br />
than in PREM. Path coverage was generally more uniform in the lower mantle, so these parts<br />
of the IASP91 P <strong>and</strong> S <strong>models</strong> were considered to be more representative of the average<br />
<strong>Earth</strong>. P structure was reasonably well constrained, except near the core-mantle boundary, but<br />
the complication of interfering phases put a practical limit on the amount <strong>and</strong> quality of data<br />
constraining S structure. Nevertheless, IASP91 seems to have done a reasonably good job of<br />
representing teleseismic travel times, as indicated by the analysis of arrival-time data from<br />
well-constrained explosions <strong>and</strong> earthquakes (Kennett <strong>and</strong> Engdahl, 1991).<br />
Fig. 2.51 Comparison of upper mantle velocity <strong>models</strong> for IASP91, PEMCA, <strong>and</strong> PREMC<br />
(from Kennett <strong>and</strong> Engdahl, 1991;). Left: β - speed of S wave; right: α - speed of P wave.<br />
Morelli <strong>and</strong> Dziewonski (1993) developed an alternative model (SP6) using the same model<br />
parameterization <strong>and</strong> upper mantle model as Kennett <strong>and</strong> Engdahl (1991). In their approach,<br />
they solved for multiple source-region station corrections averaged over 5° areas to account<br />
for lateral heterogeneity in an approximate manner. They then derived new sets of summary<br />
travel times for lower mantle <strong>and</strong> core P <strong>and</strong> S phases binned in 1° intervals of epicentral<br />
distance, <strong>and</strong> inverted those summary times for 1-D P <strong>and</strong> S velocity <strong>models</strong>. Although lower<br />
mantle P <strong>and</strong> S in the resulting model was generally comparable to IASP91, the <strong>models</strong><br />
differed in that SP6 had slightly lower velocity gradients with depth <strong>and</strong> correspondingly<br />
higher velocity jumps at the 660-km discontinuity. Moreover, SP6 had incorporated a<br />
pronounced negative velocity gradient in the D" region, a layer 100-150 km thick just above
2. <strong>Seismic</strong> <strong>Wave</strong> <strong>Propagation</strong> <strong>and</strong> <strong>Earth</strong> <strong>models</strong><br />
the core-mantle boundary. The SP6 model fitted the S data <strong>and</strong> all core-phase observations<br />
significantly better than IASP91. The differences in the seismic velocities between the <strong>models</strong><br />
were significant for the core, owing to the addition of substantial core phase data in the<br />
construction of SP6.<br />
The most significant differences between these new <strong>models</strong> <strong>and</strong> the older J-B travel-time<br />
model are in the upper mantle <strong>and</strong> core. The upper mantle is highly heterogeneous. Hence,<br />
velocities <strong>and</strong> major discontinuities in the upper mantle of recent <strong>models</strong> such as IASP91 <strong>and</strong><br />
SP6 are set at values, which give an effective average representation of velocities for waves<br />
traveling out to 25° (see Kennett <strong>and</strong> Engdahl, 1991). The core <strong>models</strong> for IASP91 <strong>and</strong> SP6<br />
predict more accurately than the J-B model the observed travel times of later-arriving core<br />
phases bottoming in the lowermost part of the outer core.<br />
These <strong>models</strong> also resolve a long-st<strong>and</strong>ing problem in that the relocation of nuclear tests using<br />
the J-B travel-time model results in incorrect estimates of the origin times of nuclear<br />
explosions by about -1.8 sec. This error will propagate into all derived travel times <strong>and</strong> may<br />
affect the procedure of phase association. Kennett <strong>and</strong> Engdahl (1991) resolved this error in<br />
the absolute travel time (or "baseline" error) by fitting the IASP91 model to the mean<br />
teleseismic residual estimated from the origin times <strong>and</strong> hypocenters reported for explosions<br />
<strong>and</strong> well-constrained earthquakes by "test event" contributors. As a result, the times of<br />
teleseismic P <strong>and</strong> S waves for the IASP91 model now appear to be in better agreement with<br />
the travel time data than the times predicted by the J-B model. The IASP91 model has been<br />
adopted as the global reference model for the International Data Centre in Vienna established<br />
under the 1996 Comprehensive Nuclear-Test-Ban Treaty (CTBT).<br />
Subsequently, Kennett et al. (1995) began with the best characteristics of the IASP91 <strong>and</strong> SP6<br />
<strong>models</strong> <strong>and</strong> sought to enhance the data quality by improving the locations of a carefully<br />
selected set of geographically well-distributed events. The basic strategy was to use a location<br />
algorithm developed by Engdahl et al. (1998) with a IASP91 model modified to conform to<br />
the SP6 core to relocate events <strong>and</strong> improve phase identifications using only first arriving P<br />
phases <strong>and</strong> re-identified depth phases (pP, pwP <strong>and</strong> sP). The resulting set of smoothed<br />
empirical relations between travel time <strong>and</strong> epicentral distance for a wide range of reidentified<br />
seismic phases was then used to construct an improved reference model for the P<br />
<strong>and</strong> S radial velocity profile of the <strong>Earth</strong> (AK135). A composite residual plot (Fig. 2.52)<br />
shows that the model AK135 provides a very good fit to the empirical times of 18 seismic<br />
phases. The baseline <strong>and</strong> trend of S is well presented <strong>and</strong> most core phase times are quite well<br />
matched. Thus, for improved global earthquake location <strong>and</strong> phase association, there has been<br />
convergence on effective global, radially symmetric P- <strong>and</strong> S-velocity <strong>Earth</strong> <strong>models</strong> that<br />
provide a good average fit to smoothed empirical travel times of seismic phases.<br />
The primary means of computing travel times from such <strong>models</strong> is based on a set of<br />
algorithms (Bul<strong>and</strong> <strong>and</strong> Chapman, 1983) that provide rapid calculation of the travel times <strong>and</strong><br />
derivatives of an arbitrary set of phases for a specified source depth <strong>and</strong> epicentral distance. In<br />
the mantle, AK135 differs from IASP91 only in the velocity gradient for the D" layer <strong>and</strong> in<br />
the baseline for S wave travel times (about -0.5 sec). Significant improvement in core<br />
velocities relative to earlier model fits was also realized. Inner core anisotropy, as discussed in<br />
the literature, is not yet accounted for in any of the newer 1-D <strong>Earth</strong> <strong>models</strong>. However there<br />
are so few reported arrivals of PKPdf at large distances along the spin axis of the <strong>Earth</strong> that<br />
the effects of this anisotropy in earthquake location are negligible.<br />
60
61<br />
2.7 Global <strong>Earth</strong> <strong>models</strong><br />
The model AK135 has since been used for further reprocessing of the arrival time information<br />
(Engdahl et al., 1998). The reprocessed data set <strong>and</strong> the AK135 reference model have formed<br />
the basis of much recent work on high-resolution travel-time tomography to determine threedimensional<br />
variations in seismic wave speed (e.g., Bijwaard et al., 1998). However, it is<br />
important to recognize that none of these <strong>models</strong> can properly account for the effect of lateral<br />
heterogeneities in the <strong>Earth</strong> on teleseismic earthquake location. Most deeper than normal<br />
earthquakes occur in or near subducted lithosphere where aspherical variations in seismic<br />
wave velocities are large (i.e., on the order of 5-10%). Such lateral variations in seismic<br />
velocity, the uneven spatial distribution of seismological stations, <strong>and</strong> the specific choice of<br />
seismic data used to determine the earthquake hypocenter can easily combine to produce bias<br />
in teleseismic earthquake locations of up to several tens of kilometers (Engdahl et al., 1998).<br />
For a review of recent advances in teleseismic event location, with the primary emphasis on<br />
applications using one-dimensional velocity <strong>models</strong> such as AK135, the reader is referred to<br />
Thurber <strong>and</strong> Engdahl (2000). The most accurate earthquake locations are best determined<br />
using a regional velocity model with phase arrival times from a dense local network, which<br />
may differ significantly (especially in focal depth) from the corresponding teleseismic<br />
locations.<br />
Fig. 2.52 Composite display of the estimates of st<strong>and</strong>ard deviations for the empirical travel<br />
times used in the construction of the AK135 velocity model (Kennett et al., 1995).<br />
The AK135 wave speed reference model is shown in Fig. 2.53. However, though the P- <strong>and</strong><br />
S-wave speeds are well constrained by high-frequency seismic phases, more information is<br />
needed to provide a full model for the structure of the <strong>Earth</strong>.
2. <strong>Seismic</strong> <strong>Wave</strong> <strong>Propagation</strong> <strong>and</strong> <strong>Earth</strong> <strong>models</strong><br />
Fig. 2.53 Radial symmetric reference <strong>models</strong> of the <strong>Earth</strong>. Top: AK135 (seismic wave speeds<br />
according to Kennett et al. (1995), attenuation parameters <strong>and</strong> density according to<br />
Montagner <strong>and</strong> Kennett (1996); Bottom: PREM (Dziewonski <strong>and</strong> Anderson, 1981). α - <strong>and</strong> β:<br />
P- <strong>and</strong> S-wave velocity, respectively; ρ - density, Qα <strong>and</strong> Qβ = Qμ - “quality factor” Q for P<br />
<strong>and</strong> S waves. Note that wave attenuation is proportional to 1/Q. The abbreviation on the<br />
outermost right st<strong>and</strong>, within the marked depth ranges, for: C – crust, UM – upper mantle, TZ<br />
– transition zone, LM – lower mantle, D''-layer, OC – outer core, IC – inner core.<br />
62
2.8 Synthetic seismograms <strong>and</strong> waveform modeling<br />
In particular, any reference model should also include the density <strong>and</strong> inelastic attenuation<br />
distributions in the <strong>Earth</strong>. Work by Montagner <strong>and</strong> Kennett (1996) provided these parameters<br />
which, although known less precisely than the seismic velocities, are needed because it makes<br />
the model suitable for use as a reference to compute synthetic seismograms (see 2.8)without<br />
requiring additional assumptions. Nevertheless, the primary use of AK135 (<strong>and</strong> IASP91)<br />
remains earthquake location <strong>and</strong> phase identification. The PREM model of Dziewonski <strong>and</strong><br />
Anderson (1981), also shown for comparison in Fig. 2.53, forms the basis for many current<br />
studies on global <strong>Earth</strong>’s structure using quantitative exploitation of seismic waveforms at<br />
longer periods. It is the objective of the ‘Working Group on Reference <strong>Earth</strong> <strong>models</strong>’ in the<br />
‘IASPEI Commission on <strong>Earth</strong> Structure <strong>and</strong> Geodynamics’ to retrieve a new 1-D reference<br />
<strong>Earth</strong> model for many depth-depending parameters which is also in agreement with<br />
observations of the <strong>Earth</strong>’s normal modes.<br />
The IASPEI 1991 Seismological Tables (Ed. Kennett, 1991) are now out of print. The more<br />
recent global P- <strong>and</strong> S-wave velocity <strong>and</strong> density model AK135, <strong>and</strong> the related body wave<br />
travel-time tables <strong>and</strong> plots are available via http://rses.anu.edu.au/seismology/ak135/<br />
intro.html <strong>and</strong> can be downloaded or printed in postscript. Additionally, software for traveltime<br />
routines <strong>and</strong> for corrections of the ellipticity of the <strong>Earth</strong> can be obtained via<br />
http://rses.anu.edu.au/seismology/ttsoft.html.<br />
2.8 Synthetic seismograms <strong>and</strong> waveform modeling<br />
A good measure of the advancement made by a scientific discipline is its ability to predict the<br />
phenomena with which it is dealing. One of the goals of seismology, as stated already over a<br />
hundred years ago by Emil Wiechert, is to underst<strong>and</strong> every wiggle on the seismogram. This<br />
requires, as sketched in Fig. 1.1 of Chapter 1, an underst<strong>and</strong>ing <strong>and</strong> quantitative modeling of<br />
the contributions made to the seismic record (the output) by the various subsystems of the<br />
complex information chain: the source effects (input), the propagation effects (medium), the<br />
influence of the seismograph (sensor) <strong>and</strong> of the data processing. It is possible nowadays to<br />
model each of these effects quite well mathematically <strong>and</strong> thus to develop procedures for<br />
calculating synthetic seismograms. While the modeling of the seismometer response (see<br />
Chapter 5) <strong>and</strong> of the source effects (see 3.5 <strong>and</strong> IS 3.1) have been outlined in more detail in<br />
this Manual, it is beyond the scope of a h<strong>and</strong>book on observatory practice to go into the depth<br />
of wave propagation theory. Here we have to refer to pertinent textbooks such as Aki <strong>and</strong><br />
Richards (1980 <strong>and</strong> 2002), Kennett (1983, 2001, 2002), Lay <strong>and</strong> Wallace (1995), Dahlen <strong>and</strong><br />
Tromp (1998) or, for some condensed introduction, to Shearer (1999). Below we will only<br />
sketch some of the underlying principles, refer to some fundamental approaches, discuss their<br />
potential <strong>and</strong> shortcomings <strong>and</strong> give a few examples of synthetic seismogram calculation <strong>and</strong><br />
waveform modeling for near <strong>and</strong> teleseismic events.<br />
Based on advanced theoretical algorithms <strong>and</strong> the availability of powerful <strong>and</strong> fast computers<br />
the calculation of synthetic seismograms for realistic <strong>Earth</strong> <strong>models</strong> is becoming more <strong>and</strong><br />
more a st<strong>and</strong>ard procedure both in research <strong>and</strong> in advanced observatory routines. Such<br />
calculations, based on certain model assumptions <strong>and</strong> parameter sets for the source,<br />
propagation path <strong>and</strong> sensor/recorder are sometimes referred to as the solution of the direct or<br />
forward problem whereas the other way around, namely, to draw inferences from the<br />
observed data itself on the effects <strong>and</strong> relevant parameters of propagation path <strong>and</strong> source is<br />
termed the inverse problem (see Fig. 1.1). With the exception of a few specialized cases of<br />
direct analytical solutions to the inverse problem (such as using the Wiechert-Herglotz<br />
63
2. <strong>Seismic</strong> <strong>Wave</strong> <strong>Propagation</strong> <strong>and</strong> <strong>Earth</strong> <strong>models</strong><br />
inversion (Eqs. (2.21) <strong>and</strong> (2.22)) for calculating the velocity-depth distribution of the<br />
medium from the observed travel-time curves), most inverse problems are solved by<br />
comparing synthetic data with observed ones. The model parameters are then changed<br />
successively in an iterative process until the differences between the observed <strong>and</strong> the<br />
synthetic data reach a minimum. The procedure of comparing synthetic <strong>and</strong> observed<br />
seismograms is known as waveform modeling. It can be used in routine practice for better<br />
identification of seismic phases <strong>and</strong> more reliable onset-time picking in case of noisy data.<br />
Additionally, more <strong>and</strong> more advanced seismological data centers, such as NEIC, now make<br />
use of waveform fitting for fast seismic moment tensor <strong>and</strong> other source parameter solutions,<br />
such as source depth (see 3.5.6.1).<br />
The underlying mathematical tool for constructing synthetic seismograms is the linear filter<br />
theory. The seismogram is thus treated as the output of a sequence of linear filters, each<br />
accounting for relevant aspects of the seismic source, propagation path <strong>and</strong> sensor/recorder.<br />
Accordingly, the seismogram u(t) can be written as the result of convolution of three basic<br />
filters, namely:<br />
u(t) = s(t) ∗g(t)∗i(t), (2.35)<br />
where s(t) is the signal from the seismic source, g(t) is the propagation filter, <strong>and</strong> i(t) is the<br />
overall instrument response. These basic filters can in fact be broken down into various subfilters,<br />
each accounting for specific effects of the source (such as source radiation directivity,<br />
source-time function), the propagation medium (such as structure <strong>and</strong> attenuation) or the<br />
instrument (such as sensor <strong>and</strong> recorder). This makes it possible to study in detail the effects<br />
of a specific parameter or process on the character of the seismogram, e.g., the effects of the<br />
shape <strong>and</strong> b<strong>and</strong>width of the seismograph response on the recording (see 4.2) or of the source<br />
depth, rupture orientation or time-history of the rupture process on the signal shape (see pp.<br />
400-412 in Lay <strong>and</strong> Wallace, 1995). With respect to the propagation term in Eq. (2.35) it may<br />
be modelled on the basis of a full wave-theoretical approach, solving Eq. (2.5) for 1-D media<br />
consisting of stacks of homogeneous horizontal layers. The complete response of such series<br />
of layers may be described by matrixes of their reflection <strong>and</strong> transmission coefficients <strong>and</strong> a<br />
so-called propagator algorithm (Thomson, 1950 <strong>and</strong> Haskell, 1953) or by generalized<br />
reflection <strong>and</strong> transmission coefficients for the entire stack as in the reflectivity method by<br />
Fuchs <strong>and</strong> Müller (1971), Kennett (1983), Müller (1985). Another, ray theoretical approach<br />
(e.g., Červený et al., 1977; Červený, 2001) is possible when assuming that variations in the<br />
elastic parameters of the media are negligible over a wavelength <strong>and</strong> thus these gradient terms<br />
tend to zero at high frequencies. While pure ray tracing allows one only to model travel-times,<br />
the assumption of so-called "Gausian beams", i.e., "ray tubes" with a Gaussian bell-shaped<br />
energy distribution, permits the modeling of both travel-times <strong>and</strong> amplitudes <strong>and</strong> thus to<br />
calculated complete synthetic seismograms also for non-1-D structures. While a decade ago<br />
limited computer power allowed one to model realistically only relatively long-period<br />
teleseismic records, it is now possible to compute complete short-period seismograms of up to<br />
about 10 Hz or even higher frequencies. Several program packages (e.g. Fuchs <strong>and</strong> Müller,<br />
1971; Kind, 1978; Kennett, 1983; Müller 1985; S<strong>and</strong>meier, 1990; Wang, 1999) permit one to<br />
compute routinely for given source parameters <strong>and</strong>, based on 1-D <strong>Earth</strong> <strong>models</strong>, synthetic<br />
seismograms for both near field <strong>and</strong> teleseismic events.<br />
Two examples of synthetic seismogram sections in reduced travel-time presentation are<br />
shown below. Fig. 2.54 shows records for the local/regional distance range between 50 <strong>and</strong><br />
350 km with P, S <strong>and</strong> surface waves in the frequency range between about 0.5 <strong>and</strong> 2 Hz. Fig.<br />
2.55 compiles synthetic records for longitudinal <strong>and</strong> some converted phases with frequencies<br />
between about 0.1 <strong>and</strong> 0.3 Hz in the teleseismic distance range between 32° <strong>and</strong> 172°. The<br />
64
2.8 Synthetic seismograms <strong>and</strong> waveform modeling<br />
earth-flattening approximation of Müller (1977) is used to transform the flat layered model<br />
into a spherical model. This approximation does not permit calculation of phases travelling<br />
close to the center of the <strong>Earth</strong>. The theoretical record sections are noise-free <strong>and</strong> have<br />
simpler waveforms than most real seismograms, owing to the assumption of a simple source<br />
function. Fig. 2.54 does not show signal-generated codas of scattered waves that are so typical<br />
for short-period records of local events.<br />
Fig. 2.54 Synthetic seismogram sections in the distance range 50-350 km, calculated for a<br />
hypothetical explosive source at 6 km depth in a homogenous single layer crustal model of 30<br />
km thickness. For the calculation the program by Kind (1978) was used.<br />
65
2. <strong>Seismic</strong> <strong>Wave</strong> <strong>Propagation</strong> <strong>and</strong> <strong>Earth</strong> <strong>models</strong><br />
Fig. 2.55 Long-period synthetic seismic record section for the epicentral distance range 36°-<br />
166°, assuming a surface explosion <strong>and</strong> wave-propagation through the IASP91 model<br />
(Kennett <strong>and</strong> Engdahl, 1991). For the calculation the program by Kind (1978) was used.<br />
66
2.8 Synthetic seismograms <strong>and</strong> waveform modeling<br />
The synthetic record sections shown in Figs. 2.54 <strong>and</strong> 2.55 provide some general insights into<br />
basic features of seismograms in these two distance ranges such as:<br />
• the overcritical Moho reflections PmP have the largest amplitudes in the P-wave part of<br />
near seismic recordings, with maximum amplitudes near the critical point around 70 km;<br />
• Pg is the first arrival up to about 140 km (for a crustal thickness of 30 km) with<br />
amplitudes decaying rapidly with distance in this simple model example;<br />
• since the travel-time curve of PmP approaches that of Pg asymptotically for larger<br />
distances, it may be difficult to separate Pg from Pm in real <strong>Earth</strong> for distances larger<br />
than about 100 km (see Fig. 2.40);<br />
• Pn takes over as first arrival beyond about 140 km with generally rather weak<br />
amplitudes <strong>and</strong> higher apparent velocity;<br />
• Sg (<strong>and</strong> in case of shallow events also surface waves, e.g., Rg) has (have) much larger<br />
amplitudes than the various types of direct, refracted or reflected P waves in records of<br />
local/regional events;<br />
• the core shadow due to the strongly reduced P-wave velocities in the outer core is indeed<br />
clearly developed in epicentral distances between about 100° <strong>and</strong> 140°, however, longperiod<br />
diffracted P waves may still be observable as relatively weak first arrivals up to<br />
120° <strong>and</strong> more;<br />
• PP is the first strong wave arrival in the core shadow range <strong>and</strong>, if Pdif or the weak<br />
inner-side reflections of P from the 660km or 410 km discontinuities (phase names<br />
P660-P <strong>and</strong> P440-P, respectively) are buried in the noise, PP can easily be<br />
misinterpreted as P-wave first arrival;<br />
• the caustic of PKP around 145° produces very strong amplitudes comparable to those of<br />
P between about 50° to 70°;<br />
• the branching of PKP into three travel-time branches beyond the caustic is well<br />
reproduced in the synthetic seismograms;<br />
• converted core reflections (PcS) <strong>and</strong> converted core refractions (PKS) may be rather<br />
strong secondary later arrivals in the P-wave range between about 35°-55° <strong>and</strong> in the<br />
core-shadow range between about 120°-140°, respectively.<br />
The following figures illustrate the potential of waveform modeling. Depth phases are not<br />
only very useful for determining the focal depth from teleseismic records, they are also<br />
frequently observed at regional distances <strong>and</strong> permit accurate depth determinations. Fig. 2.56<br />
shows the ray paths for the phases Pn, pPn, sPn <strong>and</strong> sPP in a single layer crust from an event<br />
at depth h, as recorded in the distance range beyond 150 km, when Pn appears as the first<br />
arrival. Fig. 2.57 (left) shows the theoretical seismograms for all these phases at a distance of<br />
210 km <strong>and</strong> as a function of source depth. It is easy to identify the depth phases. Fig. 2.57<br />
(right) presents a compilation of the summation traces of all available vertical component<br />
records of the Gräfenberg array stations for the 1978 Swabian Jura (Germany) earthquake<br />
(September 3, 05:09 UT; Ml = 6.0) <strong>and</strong> for several of its aftershocks. All these events have<br />
been recorded at an epicentral distance of about 210 km. Depth phases sPn were observed in<br />
most records. From the correlation of sPn in neighboring traces it becomes obvious that the<br />
source depth migrated within 5 hours from the main shock at h = 6.5 km to a depth of only<br />
about 2-3 km for the aftershock at 10:03 UT.<br />
67
2. <strong>Seismic</strong> <strong>Wave</strong> <strong>Propagation</strong> <strong>and</strong> <strong>Earth</strong> <strong>models</strong><br />
Fig. 2.56 Ray path of the sPn phases.<br />
Fig. 2.57 Left: Theoretical seismograms in reduced travel-time presentation at 210 km<br />
epicentral distance as function of source depth for a single-layer crust (as in Fig. 2.56) of 30<br />
km thickness. A clear depth phase sPn is recognizable between Pn <strong>and</strong> Pg; right: Gräfenberg<br />
records of Swabian Jura events in southern Germany. Epicentral distance is 210 km. Between<br />
the Pn <strong>and</strong> Pg arrival, a clear depth phase sPn can be observed. These observations indicate<br />
that after the main shock on September 3 at 05:09 the aftershocks migrated from 6.5 km depth<br />
to 2-3 km depth within 5 hours ( from Kind, 1985).<br />
Langston <strong>and</strong> Helmberger (1975) studied the influence of hypocenter depth h, type of source<br />
mechanism, source-time function <strong>and</strong> of stress drop on seismic waveforms. The superposition<br />
of P, pP <strong>and</strong> sP, which follow close one after another in the case of crustal earthquakes, make<br />
it difficult to separate these individual phases properly in more long-period teleseismic<br />
records <strong>and</strong> to pick the onset times of the depth phases reliably. However, because of the<br />
pronounced changes in the waveform of this P-wave group as a function of depth, one may be<br />
able to constrain also the source depth of distant earthquakes rather well by waveform<br />
modeling with an accuracy of about 5 km. On the other h<strong>and</strong>, one should be aware that there<br />
is a strong trade-off between source depth <strong>and</strong> the duration of the source-time function. A<br />
deeper source with source function of shorter duration may be similar to a shallower source<br />
68
2.8 Synthetic seismograms <strong>and</strong> waveform modeling<br />
with a longer source function. For simple sources, broadb<strong>and</strong> data may help to overcome<br />
much of this trade-off. For complex source functions, however, these may trade-off with<br />
differences in source depth if only data from single stations are available. Using data from<br />
several stations instead could reduce this problem.<br />
Generally, waveform modeling is much more powerful than first-motion focal mechanism<br />
determinations (see 3.4) in constraining fault orientation. Even with only a few stations <strong>and</strong><br />
limited azimuthal coverage around the source superior results may be achieved. This is of<br />
particular importance for a fast determination of source parameters. Additionally, by<br />
comparing predicted <strong>and</strong> observed amplitudes of waveforms, the seismic moment can be<br />
determined rather reliably (see 3.5). Fig. 2.58 shows an example of waveform modeling in the<br />
teleseismic distance range for records of the 1989 Loma Prieta earthquake in different<br />
azimuth around the source. From the best fitting synthetics, the source-time function, fault<br />
strike φ, dip δ, rake λ <strong>and</strong> seismic moment Mo were estimated. However, Kind <strong>and</strong> Basham<br />
(1987) could show that even with the broadb<strong>and</strong> data from only one teleseismic station good<br />
estimates of fault depth, strike, dip <strong>and</strong> rake could be derived from waveform modeling.<br />
Fig. 2.58 Results of waveform modeling for the 1989 Loma Prieta earthquake. Depicted are<br />
the pairs of observed (top trace) <strong>and</strong> synthetic waveforms (bottom trace) for long-period Pn<br />
(left column), teleseismic P (middle column) <strong>and</strong> SH waves (right column). The time function<br />
used is shown at the lowermost right side. From the inversion of these data the following<br />
source parameters were determined: φ = 128° ± 3°, δ = 66° ± 4°, λ = 133° ± 7°, <strong>and</strong> the<br />
moment Mo = 2.4×10 19 Nm (reproduced from Wallace et al., 1991, A broadb<strong>and</strong><br />
seismological investigation of the 1989 Loma Prieta, California, earthquake: Evidence for<br />
deep slow slip?, Bull. Seism. Soc. Am., Vol. 81, No. 5, Fig. 2, page 1627; 1991; ©<br />
Seismological Society of America).<br />
69
2. <strong>Seismic</strong> <strong>Wave</strong> <strong>Propagation</strong> <strong>and</strong> <strong>Earth</strong> <strong>models</strong><br />
Acknowledgments<br />
The authors thank P. Shearer, P. Malischewski <strong>and</strong> J. Schweitzer for careful proof-reading<br />
<strong>and</strong> many valuable suggestions. Thanks go also to M. Baumbach, B.L.N. Kennett, H.<br />
Neunhöfer, B. Schurr, J. Schweitzer <strong>and</strong> K. Wylegally for making some figures or related<br />
data for their production available.<br />
Recommended overview readings (see References under Miscellaneous in Volume 2)<br />
Aki <strong>and</strong> Richards (1980 <strong>and</strong> 2002)<br />
Bullen <strong>and</strong> Bolt (1985)<br />
Chapman (2002)<br />
Kennett (2001 <strong>and</strong> 2002)<br />
Lay <strong>and</strong> Wallace (1995)<br />
Lognonne <strong>and</strong> Clevede (2002)<br />
Sato et al. (2002)<br />
Shearer (1999)<br />
70