43rd Annual Report - Commonwealth Scholarship Commission in ...
43rd Annual Report - Commonwealth Scholarship Commission in ...
43rd Annual Report - Commonwealth Scholarship Commission in ...
- No tags were found...

You also want an ePaper? Increase the reach of your titles
YUMPU automatically turns print PDFs into web optimized ePapers that Google loves.
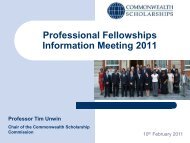
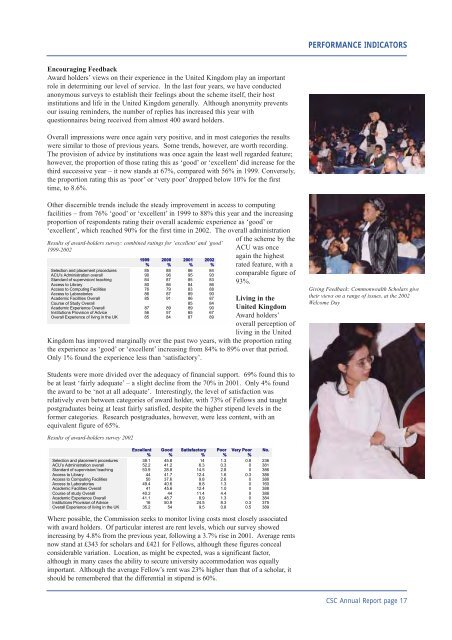
PERFORMANCE INDICATORSEncourag<strong>in</strong>g FeedbackAward holders’ views on their experience <strong>in</strong> the United K<strong>in</strong>gdom play an importantrole <strong>in</strong> determ<strong>in</strong><strong>in</strong>g our level of service. In the last four years, we have conductedanonymous surveys to establish their feel<strong>in</strong>gs about the scheme itself, their host<strong>in</strong>stitutions and life <strong>in</strong> the United K<strong>in</strong>gdom generally. Although anonymity preventsour issu<strong>in</strong>g rem<strong>in</strong>ders, the number of replies has <strong>in</strong>creased this year withquestionnaires be<strong>in</strong>g received from almost 400 award holders.Overall impressions were once aga<strong>in</strong> very positive, and <strong>in</strong> most categories the resultswere similar to those of previous years. Some trends, however, are worth record<strong>in</strong>g.The provision of advice by <strong>in</strong>stitutions was once aga<strong>in</strong> the least well regarded feature;however, the proportion of those rat<strong>in</strong>g this as ‘good’ or ‘excellent’ did <strong>in</strong>crease for thethird successive year – it now stands at 67%, compared with 56% <strong>in</strong> 1999. Conversely,the proportion rat<strong>in</strong>g this as ‘poor’ or ‘very poor’ dropped below 10% for the firsttime, to 8.6%.Other discernible trends <strong>in</strong>clude the steady improvement <strong>in</strong> access to comput<strong>in</strong>gfacilities – from 76% ‘good’ or ‘excellent’ <strong>in</strong> 1999 to 88% this year and the <strong>in</strong>creas<strong>in</strong>gproportion of respondents rat<strong>in</strong>g their overall academic experience as ‘good’ or‘excellent’, which reached 90% for the first time <strong>in</strong> 2002. The overall adm<strong>in</strong>istrationResults of award-holders survey: comb<strong>in</strong>ed rat<strong>in</strong>gs for ‘excellent’ and ‘good’1999-20021999%2000%2001%2002%Selection and placement procedures 85 88 86 84ACU’s Adm<strong>in</strong>istration overall 90 96 95 93Standard of supervision/ teach<strong>in</strong>g 84 87 85 83Access to Library 80 86 84 86Access to Comput<strong>in</strong>g Facilities 76 79 83 88Access to Laboratories 86 87 89 90Academic Facilities Overall 85 91 86 87Course of Study Overall 85 84Academic Experience Overall 87 89 89 90Institutions Provision of Advice 56 57 65 67Overall Experience of liv<strong>in</strong>g <strong>in</strong> the UK 85 84 87 89of the scheme by theACU was onceaga<strong>in</strong> the highestrated feature, with acomparable figure of93%.Liv<strong>in</strong>g <strong>in</strong> theUnited K<strong>in</strong>gdomAward holders’overall perception ofliv<strong>in</strong>g <strong>in</strong> the UnitedK<strong>in</strong>gdom has improved marg<strong>in</strong>ally over the past two years, with the proportion rat<strong>in</strong>gthe experience as ‘good’ or ‘excellent’ <strong>in</strong>creas<strong>in</strong>g from 84% to 89% over that period.Only 1% found the experience less than ‘satisfactory’.Giv<strong>in</strong>g Feedback: <strong>Commonwealth</strong> Scholars givetheir views on a range of issues, at the 2002Welcome DayStudents were more divided over the adequacy of f<strong>in</strong>ancial support. 69% found this tobe at least ‘fairly adequate’ – a slight decl<strong>in</strong>e from the 70% <strong>in</strong> 2001. Only 4% foundthe award to be ‘not at all adequate’. Interest<strong>in</strong>gly, the level of satisfaction wasrelatively even between categories of award holder, with 73% of Fellows and taughtpostgraduates be<strong>in</strong>g at least fairly satisfied, despite the higher stipend levels <strong>in</strong> theformer categories. Research postgraduates, however, were less content, with anequivalent figure of 65%.Results of award-holders survey 2002Excellent Good Satisfactory Poor Very Poor No.% %% %%Selection and placement procedures 38.1 45.8 14 1.3 0.8 236ACU’s Adm<strong>in</strong>istration overall 52.2 41.2 6.3 0.3 0 381Standard of supervision/ teach<strong>in</strong>g 53.9 28.8 14.5 2.8 0 386Access to Library 44 41.7 12.4 1.6 0.3 386Access to Comput<strong>in</strong>g Facilities 50 37.6 9.8 2.6 0 386Access to Laboratories 49.4 40.6 8.8 1.3 0 160Academic Facilities Overall 41 45.6 12.4 1.0 0 388Course of study Overall 40.2 44 11.4 4.4 0 386Academic Experience Overall 41.1 48.7 8.9 1.3 0 384Institutions Provision of Advice 16 50.9 24.5 8.3 0.3 375Overall Experience of liv<strong>in</strong>g <strong>in</strong> the UK 35.2 54 9.5 0.8 0.5 389Where possible, the <strong>Commission</strong> seeks to monitor liv<strong>in</strong>g costs most closely associatedwith award holders. Of particular <strong>in</strong>terest are rent levels, which our survey showed<strong>in</strong>creas<strong>in</strong>g by 4.8% from the previous year, follow<strong>in</strong>g a 3.7% rise <strong>in</strong> 2001. Average rentsnow stand at £343 for scholars and £421 for Fellows, although these figures concealconsiderable variation. Location, as might be expected, was a significant factor,although <strong>in</strong> many cases the ability to secure university accommodation was equallyimportant. Although the average Fellow’s rent was 23% higher than that of a scholar, itshould be remembered that the differential <strong>in</strong> stipend is 60%.CSC <strong>Annual</strong> <strong>Report</strong> page 17