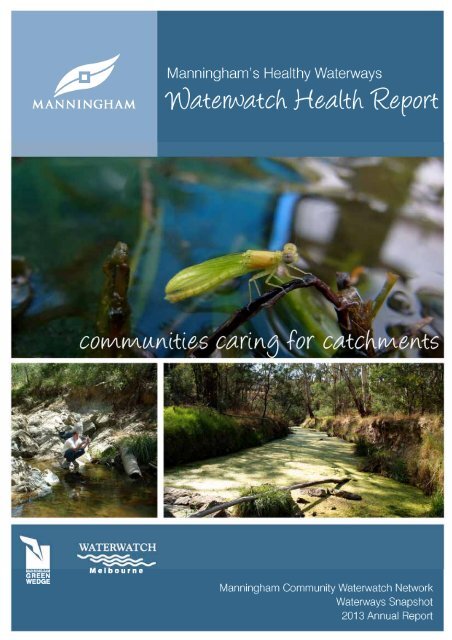
Manningham's Healthy Waterways Waterwatch Health Report
Manningham's Healthy Waterways Waterwatch Health Report
Manningham's Healthy Waterways Waterwatch Health Report
- No tags were found...

You also want an ePaper? Increase the reach of your titles
YUMPU automatically turns print PDFs into web optimized ePapers that Google loves.
Table of ContentsTable of ContentsChapter 1 Manningham’s <strong>Waterways</strong> PageManningham’s waterway 6Manningham catchments 7Chapter 2Waterway EcologyUnsewered Manningham 10Common Contaminants in Greywater 11Hard Surface Flooding 12Chapter 3Sewer Backlog ProgramManningham Sewer Backlog Program—Templestowe 14Manningham Sewer Backlog Program—Donvale 15Manningham Sewer Backlog Program—Park Orchards 16Manningham Sewer Backlog Program—Warrandyte 18Chapter 4<strong>Waterwatch</strong> MonitoringManningham <strong>Waterwatch</strong> Monitoring Program 20Manningham <strong>Waterwatch</strong> Monitoring Plan 21ANZECC Guidelines for Freshwater Ecology 22Chapter 5<strong>Waterwatch</strong> ResultsInterpretive Guide 24Catchment Ratings for 2013 252013 Water Quality Results 26<strong>Waterwatch</strong> Ecoli Monitoring Results 28Catchment <strong>Report</strong> Cards 29Chapter 6<strong>Waterwatch</strong> <strong>Report</strong> CardsAndersons Creek <strong>Waterwatch</strong> Sites 30Jumping Creek <strong>Waterwatch</strong> Sites 37Mullum Mullum Creek <strong>Waterwatch</strong> Sites 40Koonung Creek <strong>Waterwatch</strong> Sites 47Kestrel Creek <strong>Waterwatch</strong> Sites 50Yarra River <strong>Waterwatch</strong> Site 51Ruffey Creek <strong>Waterwatch</strong> Sites 54<strong>Waterwatch</strong> 2013 Annual <strong>Report</strong> 5
1. <strong>Manningham's</strong> <strong>Waterways</strong>Manningham’s <strong>Waterways</strong>Yarra River, WarrandyteManningham has an abundance ofnatural assets. These include anextensive waterway network that is avalued part of the local landscape.Identifying the environmental valuesand assessing the overall health ofour waterways is important if we areto effectively establish a long termvision and management strategy toprotect and sustain these livingsystems.Manningham’s waterways provide animportant habitat of natural andmodified bushland, open parkland andsemi-rural open space. Theselandscapes provide a wildlife corridorthat links the urban and peri-urbannatural environments.Manningham’s CatchmentsLocal creeks along with the YarraRiver provide a valuable aquaticecosystem for fish,macroinvertebrates, frogs and otheraquatic animals.<strong>Waterwatch</strong> 2013 Annual <strong>Report</strong>
1. <strong>Manningham's</strong> <strong>Waterways</strong>Table of contentsManningham’s CatchmentsAndersons CreekAndersons Creek begins in thefoothills of Ringwood and flowsnorthward 10 kilometres through thesuburbs of Park Orchards andWarrandyte. The major water qualitythreats to Andersons Creek includesseptic and greywater discharge andsullage, stormwater pollution, landfilland contaminated sites, agriculturalrunoff, open space runoff andresidential development runoff.Andersons Creek discharges into theYarra River at Everard Drive,Warrandyte.Andersons Creek, Ringwood Warrandyte RoadJumping CreekJumping Creek is situated in<strong>Manningham's</strong> Green Wedge. Muchof the creek’s riparian vegetation isstill intact and provides a significantwildlife corridor for a range of nativefauna and flora including platypus,fish and birds. The headwaters ofJumping Creek is located in the urbansuburbs of Warranwood and CroydonHills where urban constructedwetlands treat stormwater runoff. Themajor water quality threats toJumping Creek include stormwaterpollution, septic and greywaterdischarge and sullage, landfill andcontaminated sites, agricultural/horticultural runoff, open space runoffand residential development runoff.Jumping Creek, Warrandyte State Park<strong>Waterwatch</strong> 2013 Annual <strong>Report</strong> 7
1. <strong>Manningham's</strong> <strong>Waterways</strong>Mullum Mullum CreekMullum Mullum Creek runs through themiddle of the municipality andseparates the two distinct topographicand land use areas of Manningham. Tothe west of Mullum Mullum Creek arethe highly urbanised suburbs ofBulleen, Templestowe, Doncaster Eastand Donvale. To the east are the morePeri-urban suburbs of Park Orchards,Warrandyte and Wonga Park. TheMullum Mullum Creek Linear Park runsthe entire length of the creek andprovides a significant habitat andwildlife corridor. Threats to MullumMullum Creek water quality includestormwater pollution, septic andgreywater discharge and sullage,landfill and contaminated sites, openspace runoff and litter.Koonung CreekKoonung Creek runs along thesouthern border of the municipality.The creek has been significantlymodified or put underground during theconstruction of the Eastern Freeway.Water sensitive urban design wetlandshave been built alongside the freewayto protect the creek’s water quality andprovide a wildlife refuge. Theunderground section of creek runs forfour kilometres between DoncasterRoad and Thompsons Road and is animpenetrable barrier to aquatic wildlifebetween the Yarra River and theheadwaters of the creek. Threats toKoonung Creek water quality includestormwater pollution, open spacerunoff, residential development runoffand litter.Mullum Mullum Creek, Beckett RoadKoonung Creek, Doncaster<strong>Waterwatch</strong> 2013 Annual <strong>Report</strong>
2. Waterway EcologyUn-sewered ManninghamApproximately 4,620 properties inManningham are not connected to areticulated sewer. These propertiesutilise septic tanks and greywatersystems to treat domestic wastewater.Normally a septic tank treats anddisposes of all household wastewater,however, many unsewered propertiesin Manningham have a split greywater/septic system. These systemsdischarge untreated householdgreywater from the laundry, kitchen andbathrooms into the local stormwatersystem which then discharges thishighly polluted water directly into ourlocal creeks. Septic tanks that arepoorly maintained (if at all) result in thedischarge of effluent to localstormwater systems and waterways.Mullum Mullum Creek algae bloomUn-sewered Propertiesof ManninghamStormwater discharge, Ruffey CreekManningham SewerBacklog ProgramWater testing Mullum Mullum CreekMap shows locations to be sewered over the next decade.<strong>Waterwatch</strong> 2013 Annual <strong>Report</strong>
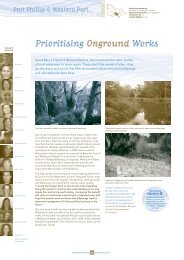
2. Waterway EcologyHard Surfaces and FloodingHeavy rainfall over a short time framecan cause significant and damagingstormwater surges. Reducing orslowing down these stormwater surgescan be a challenge. Household watertanks that collect rain water for onsiteuse is a great way to reduce this stormsurge. Engineering solutions caninclude raingardens, and waterretaining basins such as Ruffey Lakecan also slow surge events.Andersons Creek discharging turbidwater into the Yarra after heavy rainfallIn peri-urban environment good landmanagement practices and retention ofcatchment vegetation is extremelyimportant to the ecology of streams.Large areas of vegetation promotesseepage of rainfall into the substrateand reduces runoff during heavy rains.Streamside vegetation also plays animportant role by filtering outsuspended sediments and absorbspollutants from runoff water. It alsohelps hold the soil profile together andHarris Gully Tributary in floodreduce creek and river erosion.Andersons Creek flash flood at Everard Drive<strong>Waterwatch</strong> 2013 Annual <strong>Report</strong> 134
3. Sewer Backlog ProgramManningham Sewer Backlog Program—TemplestoweOver the coming years Yarra ValleyWater will be constructing a newsewerage system to previouslyunsewered parts of Manningham aspart of the Manningham SewerageBacklog Program.in Templestowe is now complete andhas been made available forhouseholders to connect. It is hopedthat most if not all properties in thisarea will be connected to the newsewer in 2012/13.Kestrel Creek is rated as highlydegraded and receives householdwastewater from the northern andcentral Templestowe areas.The program will provide a sewerageservice to properties with wastewatertreatment systems including septictanks, small treatment plants, andbiological or trickling filters.As discussed in this report the maincause of waterway pollution inManningham is the discharge ofhousehold wastewater into the localcreeks via the stormwater system.Construction of the new sewer systemHousehold wastewater fromunsewered properties in Templestowecan impact either Ruffey or Kestrelcreeks.Highly polluted stormwater dischargesare found in Ruffey Creek betweenKing Street and Dellfield Drive. Thedramatic deterioration in the waterquality of this section of creek is mostlikely from household wastewater fromunsewered properties in Templestowe.<strong>Waterwatch</strong> 2013 Annual <strong>Report</strong>
3. Sewer Backlog ProgramManningham Sewer Backlog Program—DonvaleThe majority of properties in Donvaleare currently unsewered, and arescheduled to be sewered under theBacklog Sewerage Program between2014—2016.The Donvale area is bound byGlenvale Road to the east, Mullumcreek and Smedley Road to the North,the East Link Tunnel to the south andOld Warrandyte Road to the west.The Donvale Sewer Backlog area islocated in the Mullum Mullum Creekcatchment. <strong>Waterwatch</strong> monitoringhas establish that the water quality ofMullum Mullum Creek in this areadeteriorates rapidly between Beckettand Tindals roads.This rapid deterioration in creek waterquality is caused by highly pollutedstormwater drain discharge atTandarook Crescent, Heads Road,Park Road and Conos Court.Stormwater discharges from thesedrains are observed to be of unusualcolour, odour and can have a foamy,soapy and/or oily consistency. Dryweather discharges, where the drainflows even if it has not rained for atleast 72 hours of rainfall, are alsoobserved.Water monitoring results indicate thathousehold wastewater is the likelysource of the stormwater pollutiondischarge.74<strong>Waterwatch</strong> 2013 Annual <strong>Report</strong> 2 15
3. Sewer Backlog ProgramManningham Sewer Backlog Program—Park OrchardsThe Park Orchards sewerage backlogarea contains properties that vary insize and wastewater treatmentsystems. There are approximately1,312 properties in this study area.The use of spilt systems in ParkOrchards that only treat toilet waste,with all other household wastewater(greywater) discharged off-site to thestormwater system without priortreatment, is prevalent.Systems designed to contain allwastewater on-site also exist, althoughmany have been found to notfunctioning properly. This is oftenbecause absorption trenches are notoperating effectively.Yarra Valley Water is currentlyassessing options to determine thebest method to service the ParkOrchards area.A piped sewerage network is usuallythe most common type of seweragesystem provided, however in ParkOrchards there is an innovative optionthat is being investigated that mayinvolve upgrading existing onsite septicsystems to a more modern standards.<strong>Waterwatch</strong> monitoring of the ParkOrchards area indicates that highlypolluted stormwater is impacting boththe Mullum Mullum and Andersonscreeks.Stormwater discharges are observedto have a distinct sewerage odour,have visible evidence of sanitary wasteand are soapy and oily in consistency.There is also stormwater dischargewhen no rainfall has occurred for 72hours or more when the stormwaterdrainage system should be dry.Park Orchards Sewer Backlog Program<strong>Waterwatch</strong> 2013 Annual <strong>Report</strong>
3. Sewer Backlog ProgramManningham Sewer Backlog Program—Park OrchardsLegend—On Site System TypeSecondary Treatment to land ApplicationPrimary Treatment to Land ApplicationSplit SystemOff-Site Discharge<strong>Waterwatch</strong> 2013 Annual <strong>Report</strong> 742 17
3. Sewer Backlog ProgramManningham Sewer Backlog Program—WarrandyteWarrandyte is a diverse suburb with awide variety of property types.Warrandyte’s sewer service isscheduled to be completed by July2013.Approximately 100 properties arelocated west of Tindals Road betweenReynolds Road and Warrandyte Road.These properties include those onFlannery Court, Cedar Rise andGlamis Street to the south, andAylesbury Way, Amersham Drive andMirabella Court to the North. Severalproperties on Tindals Road are alsopart of the area to be sewered.Approximately 110 properties arelocated around the Beauty Gully Roadarea. These properties include thoselocated on Beauty Gully Road,Grandview Road, Logan Avenue andHill Street, as well as severalproperties on Gold Memorial Road andBetton Crescent.Twenty seven properties west ofHutchison Avenue and on the nearbyHaughton Avenue are also to besewered.<strong>Waterwatch</strong> 2013 Annual <strong>Report</strong>
3. Sewer Backlog ProgramManningham Sewer Backlog Program—WarrandyteThe largest of Warrandyte’s backlogareas contains over 280 properties, themajority of which lie around AlexanderRoad, Oakland Drive and CampbellCourt at the western end ofWarrandyte. There are also someproperties on the southern side ofWarrandyte Road, as well as onoutlying streets including OrchardGrove. Currently this area is scheduledto be serviced within the 2012/13financial year.Ringwood-Warrandyte Road Corridorare scheduled for servicing. This areaincludes several commercial propertiesincluding a large nursery and weddingreception centres. It also includesseveral riverfront properties along TillsRoad.Properties in the Warrandyte SewerBacklog area are located at theconfluences of Andersons Creek andsmaller Yarra River Tributaries.The area along Webb Street involvesmainly large blocks south of the mainbusiness area of Warrandyte.Approximately 75 properties along the74<strong>Waterwatch</strong> 2013 Annual <strong>Report</strong> 2 19
4. <strong>Waterwatch</strong> MonitoringManningham <strong>Waterwatch</strong> Monitoring ProgramThe Manningham <strong>Waterwatch</strong>Monitoring Program consists of anetwork is a community volunteers thatmonitors the health of our localwaterways. The monitoring programsaims to assess the current conditionand detect changes in the health oflocal streams and catchments.The Manningham <strong>Waterwatch</strong>Monitoring Network consists of 25volunteers who monitor 29 sites acrossthe municipality once per month. Asmonitoring is repeated overconsecutive months and years, trendsin waterway condition can be detectedand used to identify, implement andmonitor on-ground environmentalactivities leading to the improved healthof local creeks, rivers and catchments.Water quality monitoring is important sothat water resources can be managed.The Manningham <strong>Waterwatch</strong><strong>Waterwatch</strong> Monitoring Sitesbb bbMonitoring sitesbbbbMonitoring Plan sets out a framework ofmonitoring objectives, sampling design,data analysis and findings. The plan isinteractive and is reviewed and refinedaccording to changing catchmentconditions and issues.The monitoring data can be comparedacross the municipality over time tobuild up a ‘big picture’ of catchmentbbb b b b b b bbbb b bbconditions and medium term waterquality trends.The <strong>Waterwatch</strong> monitoring communityare stakeholders who not only haveinterest in our waterways but also aimto promote awareness of local issuesand implement on ground action thatwill improve waterway health.The monitoring design also aims tobetter understand aquatic ecologicalsystems, monitor their change overtime and identify what is currentlyimpacting on the health of ourwaterways.Testing water quality in theMullum Mullum CreekAustralian PlatypusConservancy tracking platypusin the Mullum Mullum Creek<strong>Waterwatch</strong> 2013 Annual <strong>Report</strong>
4. <strong>Waterwatch</strong> MonitoringManningham <strong>Waterwatch</strong> Monitoring PlanWhy are we monitoring?To assess the health of Manningham’surban and peri-urban waterways;To identify what is currently impactingon the health of our local waterways;To assess how these impacts areaffecting stream ecology; and toidentify opportunities for streamrehabilitation, community educationand associated projects.Who will use our data?The primary users of <strong>Waterwatch</strong> dataare local community and environmentgroups. Local council, Parks Victoria,Yarra Valley Water and MelbourneWater are secondary users of thisdata.How will the data be used?Our <strong>Waterwatch</strong> data will be used toassess the current health of our localwaterways and to provide informationto help local councils and watermanagers make decisions affecting thecreeks and river. The data will alsohelp guide <strong>Waterwatch</strong>, Landcare andFriends of groups to prioritise streamrehabilitation programs.What will be monitored?<strong>Waterwatch</strong> volunteers will bemonitoring a sweep of physical andchemical monitoring parametersincluding pH, electrical conductivity,turbidity, ortho phosphorus,temperature, ammonium, algae, andmacroinvertebrates.<strong>Waterwatch</strong> school programs challenge studentsto test the water quality of their local creek.What level of data quality isachievable?The accuracy tolerable error range(TER) is to be set at plus orminus 10% of the true value.This range will enable the <strong>Waterwatch</strong>data to accurately answer thequestions posed in this monitoringplan. The data is to be complete,representative and comparable acrosscatchments.How will we ensure the data iscredible?Each <strong>Waterwatch</strong> volunteer is to betrained by a <strong>Waterwatch</strong> EducationOfficer. Each <strong>Waterwatch</strong> monitoringgroup and volunteer will undertake aQuality Assurance/ Quality ControlMystery Solution testing program thatwill accurately assess all participantsmonitoring protocols and equipment.<strong>Waterwatch</strong> communitytraining dayCommunity volunteers testing thehealth of our local waterways.<strong>Waterwatch</strong> 2013 Annual <strong>Report</strong> 6 21
4. <strong>Waterwatch</strong> MonitoringANZECC Guidelines for Freshwater EcosystemspHpH is the measure of the acidity ofwater. The pH scale ranges from 1.0(acid) through 7.0 (neutral) to 14.0(alkaline). When it rains pollutants suchas oil, detergents, industry andconstruction site runoff can enter ourwaterways and impact the pH levels.An increase or decrease in pH outsidethe normal range can de detrimental tothe health of local waterways.Andersons CreekpH Rating GuideA B C D E FRange 6.0-7.0 5.5-6 or10.6 or
4. <strong>Waterwatch</strong> MonitoringANZECC Guidelines for Freshwater EcosystemsTurbidityTurbidity is the measure of waterclarity. Particles such as soil, silt, sandand other substances in the watercolumn that can impact on light passingthrough the water. This measurementcan indicate the amount of sedimentthat is being washed into ourwaterways after rain events,stormwater and from point sourcepollution.Mullum Mullum CreekTurbidity Rating GuideA B C D E FRange
5. <strong>Waterwatch</strong> ResultsInterpretation GuideThis report gives a summary of thewater quality condition ofManningham’s municipal waterways.The report rates current waterway andcatchment condition from datacollected over a six year period (May2007—December 2012) using an A-to-F scale from the well establishedAustralian and New ZealandEnvironment and Conservation Council(ANZECC) fresh water guidelines.These guidelines provide anauthoritative guide for setting waterquality objectives required to sustaincurrent, and future, environmentalvalues.These guidelines provide governmentand the general community with asound set of tools for assessing andmanaging ambient water quality innatural and semi-natural waterresources. The strategy is based onthe philosophy of EcologicallyDamselfly from Koonung CreekSustainable Development (ESD). Theguidelines are used as a resource inorder to guide the ecologicalprocesses, on which life depends andis maintained.The 2013 <strong>Waterwatch</strong> Annual <strong>Report</strong>uses the ANZECC guidelines to rateturbidity, electrical conductivity, pH andortho phosphorus at a site and subcatchmentscale using a score systemrated from ‘A’ (best quality) down to‘F’ (most degraded). The reportcompares the yearly results in order toassess water quality trends at both asite and catchment scale.Platypus in Mullum Mullum CreekMullum Mullum Creek at Beckett Road<strong>Waterwatch</strong> 2013 Annual <strong>Report</strong>
5. <strong>Waterwatch</strong> ResultsCatchment Ratings for 20132013 <strong>Waterwatch</strong> Catchment RatingC+CC-D-ECABCDEFCatchment<strong>Waterwatch</strong> Catchment andParameter Ratings for 2013OverallRatingTurbidity PO4 EC pHAndersons Creek E C- F E- CJumping Creek C A C E- CKoonung Creek C B B- E+ CMullum Mullum Creek D- A- E D B-Ruffey Creek C- B C- E- C+Yarra River C+ D+ B- B B+<strong>Waterwatch</strong> 2013 Annual <strong>Report</strong> 25
5. <strong>Waterwatch</strong> Results2013 Phosphorus—Monitoring ResultsA - ExcellentB - GoodC - FairD - PoorE/F - Degraded2013 Electrical Conductivity—Monitoring ResultsA - ExcellentB - GoodC - FairD - PoorE/F - Degraded<strong>Waterwatch</strong> 2013 Annual <strong>Report</strong>
5. <strong>Waterwatch</strong> Results2013 Turbidity—Monitoring Results2013 pH—Monitoring ResultsA - ExcellentB - GoodC - FairD - PoorE/F - DegradedA - ExcellentB - GoodC - FairD - PoorE/F - Degraded<strong>Waterwatch</strong> 2013 Annual <strong>Report</strong>162712
5. <strong>Waterwatch</strong> Results<strong>Waterwatch</strong> Ecoli Monitoring ResultsEcoli Results October 30, 201230030040054006600100200300300038005000EPAGuidelinesPassFailSafe levels forswimming
5. <strong>Waterwatch</strong> ResultsCatchment <strong>Report</strong> CardsThe following <strong>Report</strong> Cardsdetail the water qualitymonitoring results at each ofthe <strong>Waterwatch</strong> monitoringsites across the municipality.The results provide an overallyearly water quality healthassessment and rating foreach of the water qualityparameters measuredbetween 2007 to 2012.Andersons CreekHusseys Lane2012Overall rating:Phosphorus:Conductivity:Example <strong>Report</strong> CardExcellent Good Fair Poor Degraded Very DegradedEach report card has its ownsite photograph and waterquality analysis for each yearof monitoring.Turbidity:pH:Although there may be animprovement or decline inrating from year to year, along term trend will only beestablished after many yearsof monitoring.Ammonium:Andersons Creek—Husseys Lane2007 2008 2009 2010 2011 2012Overall rating E+ E+ E+ D- D- E+Ortho PhosphorusF F- F- F- F- FChangeElectricalConductivityF+E+ F EE-D-TurbidityC+ B B BpHD E+ D- DA-D+BD-<strong>Waterwatch</strong> 2013 Annual <strong>Report</strong> 2910
6. <strong>Waterwatch</strong> <strong>Report</strong> CardAndersons CreekConfluence2012Excellent Good Fair Poor Degraded VeryDegradedOverall RatingOrtho PhosphorusElectrical ConductivityTurbiditypHAmmoniumAndersons Creek—Confluence2007 2008 2009 2010 2011Overall rating D- D+ D+ D C-Ortho Phosphorus F E- F F+ E+Electrical Conductivity E+ D+ D E+ ETurbidity D C B- C+ A-pH B- B B C B2012D-E-ECB-Change<strong>Waterwatch</strong> 2013 Annual <strong>Report</strong>
6. <strong>Waterwatch</strong> <strong>Report</strong> CardAndersons CreekGold Memorial2012Excellent Good Fair Poor Degraded VeryDegradedOverall RatingOrtho PhosphorusElectrical ConductivityTurbiditypHAmmoniumAndersons Creek—Gold Memorial2007 2008 2009 2010 2011Overall rating E+ E+ E+ D D-Ortho Phosphorus F- F- F F+ F-Electrical Conductivity E+ E+ E E+ ETurbidity C B B C+ A-pH D D+ E+ C D2012E+FD-BD-Change<strong>Waterwatch</strong> 2013 Annual <strong>Report</strong> 3118
6. <strong>Waterwatch</strong> <strong>Report</strong> CardAndersons CreekHusseys Lane2012Overall RatingExcellent Good Fair Poor Degraded VeryDegradedOrtho PhosphorusElectrical ConductivityTurbiditypHAmmoniumAndersons Creek—Husseys Lane2007 2008 2009 2010 2011Overall rating E+ E+ E+ D- D-Ortho Phosphorus F F- F- F- F-Electrical Conductivity F+ E+ F E E-Turbidity C+ B B B A-pH D E+ D- D D+2012E+FD-BD-Change<strong>Waterwatch</strong> 2013 Annual <strong>Report</strong>
6. <strong>Waterwatch</strong> <strong>Report</strong> CardAndersons Creek658 Warrandyte Rd2012Excellent Good Fair Poor Degraded VeryDegradedOverall RatingOrtho PhosphorusElectrical ConductivityTurbiditypHAmmoniumAndersons Creek—658 Warrandyte Road2007 2008 2009 2010 2011 2012Overall rating D- D- D-Ortho Phosphorus F- F- F-Electrical ConductivityF F F-Turbidity A+ B+ A+pHB B BChange<strong>Waterwatch</strong> 2013 Annual <strong>Report</strong> 3318
6. <strong>Waterwatch</strong> <strong>Report</strong> CardAndersons CreekWirth Road Drain2012Overall RatingExcellent Good Fair Poor Degraded VeryDegradedOrtho PhosphorusElectrical ConductivityTurbiditypHAmmoniumAndersons Creek—Wirth Road Drain2007 2008 2009 2010 2011Overall rating E D- D D D-Ortho Phosphorus F- F- F- F- F-Electrical Conductivity F E- E E FTurbidity A- B B B A+pH B B- B C+ C+2012D-F-F-A+B-Change<strong>Waterwatch</strong> 2013 Annual <strong>Report</strong>
6. <strong>Waterwatch</strong> <strong>Report</strong> CardAndersons CreekHarris Gully2012Overall RatingExcellent Good Fair Poor Degraded VeryDegradedOrtho PhosphorusElectrical ConductivityTurbiditypHAmmoniumAndersons Creek—Harris Gully Tributary2007 2008 2009 2010 2011 2012Overall rating D- E+ E+ E D- E+Ortho Phosphorus E- F+ F+ E E+ E-Electrical Conductivity E- F F+ F+ E ETurbidity E- F+ F+ F E FpH B B- B- B C+ BChange<strong>Waterwatch</strong> 2013 Annual <strong>Report</strong>
6. <strong>Waterwatch</strong> <strong>Report</strong> CardJumping CreekJumping Creek Rd2012Overall RatingOrtho PhosphorusExcellent Good Fair Poor Degraded VeryDegradedElectrical ConductivityTurbiditypHAmmoniumJumping Creek—Jumping Creek Road2007 2008 2009 2010 2011Overall rating D C+ C C COrtho Phosphorus D C+ B D- A-Electrical Conductivity E D- E D+ ETurbidity C A- F- B+ A+pH C D B D2012CAEADChange<strong>Waterwatch</strong> 2013 Annual <strong>Report</strong> 3718
6. <strong>Waterwatch</strong> <strong>Report</strong> CardJumping CreekBrysons Road2012Overall RatingExcellent Good Fair Poor Degraded VeryDegradedOrtho PhosphorusElectrical ConductivityTurbiditypHAmmoniumJumping Creek—Brysons Road2007 2008 2009 2010 2011Overall rating C- C C C C-Ortho Phosphorus A+ C+ D D C-Electrical Conductivity E E+ E D- E-Turbidity C+ A A+ A- A+pH C B- B D-2012C-B-FA+DChange<strong>Waterwatch</strong> 2013 Annual <strong>Report</strong>
6. <strong>Waterwatch</strong> <strong>Report</strong> CardJumping CreekMerrill Crescent2012Excellent Good Fair Poor Degraded VeryDegradedOverall RatingOrtho PhosphorusElectrical ConductivityTurbiditypHAmmoniumJumping Creek—Merrill Crescent2007 2008 2009 2010 2011Overall rating C+ C C+ C+ COrtho Phosphorus B- B- B- C DElectrical Conductivity E+ E- D D- E-Turbidity B+ B+ A+ B+ A+pH B- C+ C+ B- B2012CDEAB-Change<strong>Waterwatch</strong> 2013 Annual <strong>Report</strong> 3918
6. <strong>Waterwatch</strong> <strong>Report</strong> CardMullum Mullum CkThe Parkway2012Excellent Good Fair Poor Degraded VeryDegradedOverall RatingOrtho PhosphorusElectrical ConductivityTurbiditypHAmmoniumMullum Mullum Creek—The Parkway2007 2008 2009 2010 2011Overall rating E D C- C- D+Ortho Phosphorus F- E- E E EElectrical Conductivity F- C D+ C- ETurbidity D D- B- C B-pH B C+ C+ B- B2012C-ED-A+BChange<strong>Waterwatch</strong> 2013 Annual <strong>Report</strong>
6. <strong>Waterwatch</strong> <strong>Report</strong> CardMullum Mullum CkTindals Road2012Excellent Good Fair Poor Degraded VeryDegradedOverall RatingOrtho PhosphorusElectrical ConductivityTurbiditypHAmmoniumMullum Mullum Creek—Tindals Road2008 2009 2010 2011Overall rating D+ D+ D+ D+Ortho Phosphorus F- F- F- FElectrical Conductivity D D+ D ETurbidity B B+ A A+pH B B C B2012D+FD-A-BChange<strong>Waterwatch</strong> 2013 Annual <strong>Report</strong> <strong>Report</strong> 2013 1841
6. <strong>Waterwatch</strong> <strong>Report</strong> CardMullum Mullum CkHeads Road2012Overall RatingExcellent Good Fair Poor Degraded VeryDegradedOrtho PhosphorusElectrical ConductivityTurbiditypHAmmoniumMullum Mullum Creek—Heads Road2007 2008 2009 2010 2011Overall rating D+ C- C- C+ C+Ortho Phosphorus F E- E E+ DElectrical Conductivity C- C- D D+ D+Turbidity A+ B A+ A+ ApH C+ C B- B-2012B-DCA+BChange<strong>Waterwatch</strong> 2013 Annual <strong>Report</strong>
6. <strong>Waterwatch</strong> <strong>Report</strong> CardMullum Mullum CkPark Road2012Excellent Good Fair Poor Degraded VeryDegradedOverall RatingOrtho PhosphorusElectrical ConductivityTurbiditypHAmmoniumMullum Mullum Creek—Park Road2007 2008 2009 2010 2011Overall rating D+ D+ F+ F- FOrtho Phosphorus F F F+ F- FElectrical Conductivity D+ D+ E+ E+ D-Turbidity B B A+ A+ A+pH B C+ C+ B- C+2012DF-DA+DChange<strong>Waterwatch</strong><strong>Waterwatch</strong>2013AnnualAnnual<strong>Report</strong><strong>Report</strong>20134318
6. <strong>Waterwatch</strong> <strong>Report</strong> CardMullum Mullum CkTandarook Drain2012Overall RatingExcellent Good Fair Poor Degraded VeryDegradedOrtho PhosphorusElectrical ConductivityTurbiditypHAmmoniumMullum Mullum Creek—Tandarook Drain2008 2009 2010 2011 2012Overall rating C- D+ C+ C+ C+Ortho Phosphorus E+ F E+ D DElectrical Conductivity C D D+ D+ CTurbidity B- A+ C A+ A+pH B C B B CChange<strong>Waterwatch</strong> 2013 Annual <strong>Report</strong>
6. <strong>Waterwatch</strong> <strong>Report</strong> CardMullum Mullum CkBeckett Road2012Excellent Good Fair Poor Degraded VeryDegradedOverall RatingOrtho PhosphorusElectrical ConductivityTurbiditypHAmmoniumMullum Mullum Creek—Beckett Road2007 2008 2009 2010 2011Overall rating C+ C+ C B- B-Ortho Phosphorus C+ C D B CElectrical Conductivity C- C D C- CTurbidity B B B A+ A+pH B C C+ C B2012B-B-CA+DChange<strong>Waterwatch</strong> 2013 Annual <strong>Report</strong> 4518
6. <strong>Waterwatch</strong> <strong>Report</strong> CardMullum Mullum CkPaddys Tributary2012Overall RatingExcellent Good Fair Poor Degraded VeryDegradedOrtho PhosphorusElectrical ConductivityTurbiditypHAmmoniumMullum Mullum Creek—Paddys Lane Tributary2008 2009 2010 2011 2012Overall rating E+ D D E+ E+Ortho Phosphorus F- F- F- F- F-Electrical Conductivity F F+ F E- F-Turbidity A A+ A+ B A+pH B B B B BChange<strong>Waterwatch</strong> 2013 Annual <strong>Report</strong>
6. <strong>Waterwatch</strong> <strong>Report</strong> CardKoonung CreekGolf Course2012Excellent Good Fair Poor Degraded VeryDegradedOverall RatingOrtho PhosphorusElectrical ConductivityTurbiditypHAmmoniumKoonung Creek—Freeway Golf Course2008 2009 2010 2011 2012Overall rating C+ C COrtho Phosphorus C+ D+ CElectrical Conductivity D- E+ E+TurbidityB B BpHB B- B-Change<strong>Waterwatch</strong> 2013 Annual <strong>Report</strong> 4718
6. <strong>Waterwatch</strong> <strong>Report</strong> CardKoonung CreekTram Reserve2012Overall RatingExcellent Good Fair Poor Degraded VeryDegradedOrtho PhosphorusElectrical ConductivityTurbiditypHAmmoniumMullum Mullum Creek—Tram Reserve2008 2009 2010 2011Overall rating C+ C- C COrtho Phosphorus C+ C C- C+Electrical Conductivity D+ E C- ETurbidity A- A B- ApH C+ D+ C+ C2012CC+DBC+Change<strong>Waterwatch</strong> 2013 Annual <strong>Report</strong>
6. <strong>Waterwatch</strong> <strong>Report</strong> CardKoonung CreekLeeds Street2012Excellent Good Fair Poor Degraded VeryDegradedOverall RatingOrtho PhosphorusElectrical ConductivityTurbiditypHAmmoniumKoonung Creek—Leeds Street2008 2009 2010 2011Overall rating C+ C+ COrtho Phosphorus C C D+Electrical Conductivity D- E E-Turbidity A+ A+ A+pH C B- B2012CBF+B-C+Change<strong>Waterwatch</strong> 2013 Annual <strong>Report</strong> 18 49
6. <strong>Waterwatch</strong> <strong>Report</strong> CardKestrel CreekFitzsimons Lane2012Overall RatingExcellent Good Fair Poor Degraded VeryDegradedOrtho PhosphorusElectrical ConductivityTurbiditypHAmmoniumKestrel Creek—Fitzsimons Lane2008 2009 2010 2011Overall rating E+ D-Ortho Phosphorus F- F-Electrical Conductivity F- FTurbidityB C+pHC B-2012D-F-FBB-Change<strong>Waterwatch</strong> 2013 Annual <strong>Report</strong>
6. <strong>Waterwatch</strong> <strong>Report</strong> CardYarra RiverWarrandyte2012Excellent Good Fair Poor Degraded VeryDegradedOverall RatingOrtho PhosphorusElectrical ConductivityTurbiditypHAmmoniumYarra River—Warrandyte Bridge2008 2009 2010 2011Overall rating B B- B- C+Ortho Phosphorus B- C C+ CElectrical Conductivity B B B BTurbidity A+ C B- B-pH B B B B-2012CC+-D-C+Change<strong>Waterwatch</strong> 2013 Annual <strong>Report</strong> 5118
6. <strong>Waterwatch</strong> <strong>Report</strong> CardYarra RiverManningham Rd2012Excellent Good Fair Poor Degraded VeryDegradedOverall RatingOrtho PhosphorusElectrical ConductivityTurbiditypHAmmoniumYarra River—Manningham Road2008 2009 2010 2011Overall rating C- C+Ortho PhosphorusD C+Electrical Conductivity B- BTurbidity E- DpH B- B2012B-C+BCBChange<strong>Waterwatch</strong> 2013 Annual <strong>Report</strong>
6. <strong>Waterwatch</strong> <strong>Report</strong> CardYarra RiverBurke Road2012Excellent Good Fair Poor Degraded VeryDegradedOverall RatingOrtho PhosphorusElectrical ConductivityTurbiditypHAmmoniumYarra River—Burke Road2008 2009 2010 2011Overall rating C- COrtho Phosphorus C- C+Electrical Conductivity B- BTurbidityE EpHB C+2012C+BBDB-Change<strong>Waterwatch</strong> 2013 Annual <strong>Report</strong> 18 53
6. <strong>Waterwatch</strong> <strong>Report</strong> CardRuffey CreekRuffey Lake2012Overall RatingExcellent Good Fair Poor Degraded VeryDegradedOrtho PhosphorusElectrical ConductivityTurbiditypHAmmoniumOverall ratingOrtho PhosphorusElectrical ConductivityTurbiditypHRuffey Creek—Ruffey Lake2008 2009 20102011 2012Site moved from RuffeyCreek at Victoria StreetCC+CCD+Change<strong>Waterwatch</strong> 2013 Annual <strong>Report</strong>
6. <strong>Waterwatch</strong> <strong>Report</strong> CardRuffey CreekVictoria Street2012Excellent Good Fair Poor Degraded VeryDegradedOverall RatingOrtho PhosphorusElectrical ConductivityTurbiditypHAmmoniumRuffey Creek—Victoria Street Outlet2007 2009 2010 2011Overall rating D E+ D D-Ortho Phosphorus D E+ D- FElectrical Conductivity E F E FTurbidity D- E- C C+pH C+ C+ C- C2012 ChangeSite moved to Ruffey Lake<strong>Waterwatch</strong> 2013 Annual <strong>Report</strong> 1855
6. <strong>Waterwatch</strong> <strong>Report</strong> CardRuffey CreekDellfield Drive2012Overall RatingExcellent Good Fair Poor Degraded VeryDegradedOrtho PhosphorusElectrical ConductivityTurbiditypHAmmoniumRuffey Creek—Dellfield Drive2008 2009 2010 2011Overall rating D+ C- C- D+Ortho Phosphorus E F+ E+ FElectrical Conductivity F D- D- E-Turbidity A+ A- A- A+pH C+ B- B- C+2012D+D-F-A+B-Change<strong>Waterwatch</strong> 2013 Annual <strong>Report</strong>
6. <strong>Waterwatch</strong> <strong>Report</strong> CardRuffey CreekKing Street2012Excellent Good Fair Poor Degraded VeryDegradedOverall RatingOrtho PhosphorusElectrical ConductivityTurbiditypHAmmoniumRuffey Creek—King Street2008 2009 2010 2011Overall rating C C+ C COrtho Phosphorus C C- D+ DElectrical Conductivity F+ D D- E+Turbidity A+ A B- ApH B B- B C+2012C-C-FB-B-Change<strong>Waterwatch</strong> 2013 Annual <strong>Report</strong> 18 57