- Page 3 and 4: Statement of lengthThis thesis does
- Page 5 and 6: molecules also bind to enzymes dire
- Page 7 and 8: Table of ContentsTitlePagesIntroduc
- Page 9 and 10: TitlePageFigure 4.5: Catalytic and
- Page 11 and 12: IntroductionFunctional and comparat
- Page 13 and 14: egulation owing to the large amount
- Page 15 and 16: (A) Closed complex formationRNA pol
- Page 17 and 18: Intuitively negative supercoiling,
- Page 19 and 20: I.3. Transcription factors: domain
- Page 21 and 22: I.4. Transcriptional regulatory net
- Page 23 and 24: (Balazsi et al. 2005). Gene express
- Page 25 and 26: metabolism / carbon nutrition with
- Page 27 and 28: I.4.5. Signal sensing in transcript
- Page 29 and 30: I.5. Non-transcriptional output: cy
- Page 31 and 32: transcriptional initiation by c-di-
- Page 33 and 34: phosphatase activity of the kinases
- Page 35 and 36: I.7. ConclusionIn this chapter, we
- Page 37 and 38: Chapter 1: Global regulators of bac
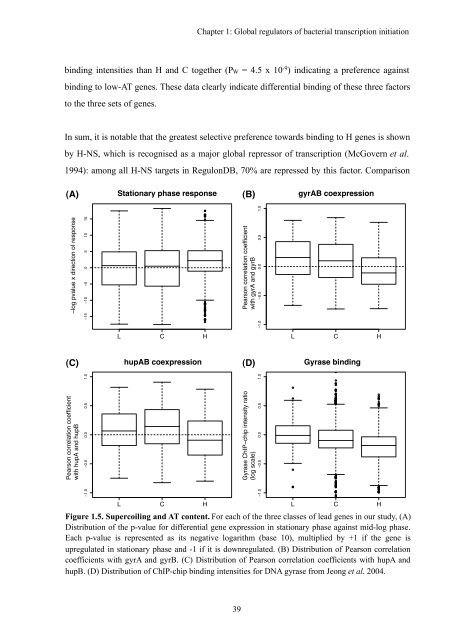
- Page 39 and 40: Chapter 1: Global regulators of bac
- Page 41 and 42: Chapter 1: Global regulators of bac
- Page 43 and 44: Chapter 1: Global regulators of bac
- Page 45 and 46: Chapter 1: Global regulators of bac
- Page 47: Chapter 1: Global regulators of bac
- Page 51 and 52: Chapter 1: Global regulators of bac
- Page 53 and 54: Chapter 1: Global regulators of bac
- Page 55 and 56: Chapter 1: Global regulators of bac
- Page 57 and 58: Chapter 1: Global regulators of bac
- Page 59 and 60: Chapter 2: Transcriptional control
- Page 61 and 62: Chapter 2: Transcriptional control
- Page 63 and 64: Chapter 2: Transcriptional control
- Page 65 and 66: Chapter 2: Transcriptional control
- Page 67 and 68: Chapter 2: Transcriptional control
- Page 69 and 70: Chapter 2: Transcriptional control
- Page 71 and 72: Chapter 2: Transcriptional control
- Page 73 and 74: Chapter 2: Transcriptional control
- Page 75 and 76: Chapter 2: Transcriptional control
- Page 77 and 78: Chapter 2: Transcriptional control
- Page 79 and 80: Chapter 2: Transcriptional control
- Page 81 and 82: Chapter 2: Transcriptional control
- Page 83 and 84: Chapter 2: Transcriptional control
- Page 85 and 86: Chapter 2: Transcriptional control
- Page 87 and 88: Chapter 3: Transcriptional and post
- Page 89 and 90: Chapter 3: Transcriptional and post
- Page 91 and 92: Chapter 3: Transcriptional and post
- Page 93 and 94: Chapter 3: Transcriptional and post
- Page 95 and 96: Chapter 3: Transcriptional and post
- Page 97 and 98: Chapter 3: Transcriptional and post
- Page 99 and 100:
Chapter 3: Transcriptional and post
- Page 101 and 102:
Chapter 3: Transcriptional and post
- Page 103 and 104:
Chapter 3: Transcriptional and post
- Page 105 and 106:
Chapter 4: Comparative genomics of
- Page 107 and 108:
Chapter 4: Comparative genomics of
- Page 109 and 110:
Chapter 4: Comparative genomics of
- Page 111 and 112:
Chapter 4: Comparative genomics of
- Page 113 and 114:
Chapter 4: Comparative genomics of
- Page 115 and 116:
Chapter 4: Comparative genomics of
- Page 117 and 118:
Chapter 4: Comparative genomics of
- Page 119 and 120:
Chapter 4: Comparative genomics of
- Page 121 and 122:
Chapter 4: Comparative genomics of
- Page 123 and 124:
Chapter 4: Comparative genomics of
- Page 125 and 126:
Chapter 4: Comparative genomics of
- Page 127 and 128:
Chapter 4: Comparative genomics of
- Page 129 and 130:
Chapter 4: Comparative genomics of
- Page 131 and 132:
Chapter 4: Comparative genomics of
- Page 133 and 134:
Chapter 5: Comparative genomics of
- Page 135 and 136:
two-domain architectures wherethese
- Page 137 and 138:
Chapter 5: Comparative genomics of
- Page 139 and 140:
Chapter 5: Comparative genomics of
- Page 141 and 142:
Chapter 5: Comparative genomics of
- Page 143 and 144:
Chapter 5: Comparative genomics of
- Page 145 and 146:
Chapter 5: Comparative genomics of
- Page 147 and 148:
Chapter 5: Comparative genomics of
- Page 149 and 150:
(A)60% of genomes from class4530150
- Page 151 and 152:
Chapter 5: Comparative genomics of
- Page 153 and 154:
Discussion and conclusionsDiscussio
- Page 155 and 156:
Discussion and conclusionsD1.1.3. C
- Page 157 and 158:
Discussion and conclusionsD2. Futur
- Page 159 and 160:
BibliographyAmikam, D., Steinberger
- Page 161 and 162:
BibliographyBlattner, F.R., Plunket
- Page 163 and 164:
BibliographyChen, S.L., Hung, C.S.,
- Page 165 and 166:
BibliographyEchols, N., Harrison, P
- Page 167 and 168:
Bibliographysystem level analysis o
- Page 169 and 170:
BibliographyHerring, C.D., Raghunat
- Page 171 and 172:
BibliographyJenal, U., and Malone,
- Page 173 and 174:
BibliographyKeseler, I.M., Collado-
- Page 175 and 176:
BibliographyLee, S.H., Angelichio,
- Page 177 and 178:
BibliographyMcClelland, M., Sanders
- Page 179 and 180:
BibliographyO Croinin, T., Carroll,
- Page 181 and 182:
BibliographyPrice, M.N., Dehal, P.S
- Page 183 and 184:
BibliographySatriano, J., and Schlo
- Page 185 and 186:
BibliographySteinberger, O., Lapido
- Page 187 and 188:
BibliographyUssery, D.W., Wassenaar
- Page 189 and 190:
BibliographyYanofsky, C. 1981. Atte
- Page 191 and 192:
Appendix 1Appendix 1.1: Differences
- Page 193 and 194:
!!!!!!!!!!!! !!!!!!!!!!!!!!!!!!!!!!
- Page 195 and 196:
Appendix 1Appendix 1.5: Gene expres
- Page 197 and 198:
Appendix 2Appendix 2.1: Differences
- Page 199 and 200:
Appendix 2Appendix 2.3: Co-regulati
- Page 201 and 202:
Appendix 2Appendix 2.5: Flux coupli
- Page 203 and 204:
Appendix 2Appendix 2.7: Co-regulati
- Page 205 and 206:
Appendix 2Appendix 2.8B: Connectivi
- Page 207 and 208:
Appendix 2Appendix 2.10: Correlatio
- Page 209 and 210:
Appendix 2Appendix 2.12A: Robustnes
- Page 212 and 213:
Appendix 3Appendix 3Supplementary m
- Page 214 and 215:
Reaction ID Regulatory metabolite I
- Page 216 and 217:
Appendix 3Appendix 3.3B: Direct reg
- Page 218 and 219:
Appendix 3Appendix 3.4B: Direct reg
- Page 220 and 221:
Appendix 4Appendix 4Supplementary m
- Page 222 and 223:
Appendix 4Motile organisms are rich
- Page 224:
Appendix 4We can expand the analysi
- Page 227 and 228:
Appendix 5Appendix 5.1A: PFAMs for
- Page 229 and 230:
Appendix 5Appendix 5.1C: PFAMs for
- Page 231 and 232:
Appendix 5Appendix 5.2B: Small-mole
- Page 233 and 234:
Appendix 5Appendix 5.3: Organisms s
- Page 235 and 236:
Appendix 5Appendix 5.5: Partner dom
- Page 237 and 238:
Appendix 5fraction of SDRRs would a
- Page 239 and 240:
Appendix 5Appendix 5.6C: Non-hybrid
- Page 241 and 242:
Appendix 5Appendix 5.8: List of org
- Page 244 and 245:
Appendix 6Appendix 6List of genomes
- Page 246 and 247:
Appendix 648. Mycobacterium tubercu
- Page 248 and 249:
Appendix 6144. Bacillus cereus ATCC
- Page 250 and 251:
Appendix 6240. Nitrobacter winograd
- Page 252 and 253:
Appendix 6336. Cytophaga hutchinson
- Page 254 and 255:
Appendix 6432. Acinetobacter bauman
- Page 256 and 257:
Appendix 6528. Enterobacter sakazak
- Page 258 and 259:
Appendix 6624. Polynucleobacter nec
- Page 260 and 261:
Appendix 7Appendix 7List of genomes
- Page 262 and 263:
Appendix 748. Bordetella parapertus
- Page 264 and 265:
Appendix 7144. Haemophilus somnus14
- Page 266 and 267:
Appendix 7240. Prochlorococcus mari
- Page 268 and 269:
Appendix 7336. Synechococcus sp. CC
- Page 270 and 271:
Downloaded from genome.cshlp.org on
- Page 272 and 273:
Downloaded from genome.cshlp.org on
- Page 274 and 275:
Downloaded from genome.cshlp.org on
- Page 276 and 277:
Downloaded from genome.cshlp.org on
- Page 278 and 279:
Downloaded from genome.cshlp.org on
- Page 280 and 281:
Downloaded from genome.cshlp.org on
- Page 282 and 283:
Downloaded from genome.cshlp.org on
- Page 284 and 285:
JOURNAL OF BACTERIOLOGY, June 2008,
- Page 286 and 287:
VOL. 190, 2008 P. MIRABILIS GENOME
- Page 288 and 289:
VOL. 190, 2008 P. MIRABILIS GENOME
- Page 290 and 291:
VOL. 190, 2008 P. MIRABILIS GENOME
- Page 292 and 293:
VOL. 190, 2008 P. MIRABILIS GENOME
- Page 294:
VOL. 190, 2008 P. MIRABILIS GENOME
- Page 297 and 298:
2 Nucleic Acids Research, 2008PCR a
- Page 299 and 300:
4 Nucleic Acids Research, 2008Table
- Page 301 and 302:
6 Nucleic Acids Research, 2008Table
- Page 303 and 304:
8 Nucleic Acids Research, 2008solve
- Page 305 and 306:
524 Mol Genet Genomics (2008) 279:5
- Page 307 and 308:
526 Mol Genet Genomics (2008) 279:5
- Page 309 and 310:
528 Mol Genet Genomics (2008) 279:5
- Page 311 and 312:
530 Mol Genet Genomics (2008) 279:5
- Page 313 and 314:
532 Mol Genet Genomics (2008) 279:5
- Page 315 and 316:
534 Mol Genet Genomics (2008) 279:5
- Page 317 and 318:
4378 J.J. James et al. / FEBS Lette
- Page 319 and 320:
4380 J.J. James et al. / FEBS Lette
- Page 321 and 322:
4382 J.J. James et al. / FEBS Lette
- Page 324 and 325:
An Assessment of the Role of DNA Ad
- Page 326 and 327:
DAM and Transcriptionpotential of s