Quality Assessment of Microarray Gene Expression Data
Quality Assessment of Microarray Gene Expression Data
Quality Assessment of Microarray Gene Expression Data

You also want an ePaper? Increase the reach of your titles
YUMPU automatically turns print PDFs into web optimized ePapers that Google loves.
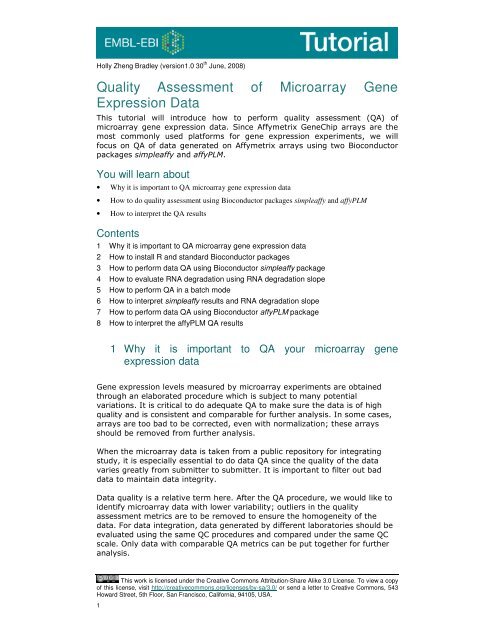
Holly Zheng Bradley (version1.0 30 th June, 2008)<strong>Quality</strong> <strong>Assessment</strong> <strong>of</strong> <strong>Microarray</strong> <strong>Gene</strong><strong>Expression</strong> <strong>Data</strong>This tutorial will introduce how to perform quality assessment (QA) <strong>of</strong>microarray gene expression data. Since Affymetrix <strong>Gene</strong>Chip arrays are themost commonly used platforms for gene expression experiments, we willfocus on QA <strong>of</strong> data generated on Affymetrix arrays using two Bioconductorpackages simpleaffy and affyPLM.You will learn about• Why it is important to QA microarray gene expression data• How to do quality assessment using Bioconductor packages simpleaffy and affyPLM• How to interpret the QA resultsContents1 Why it is important to QA microarray gene expression data2 How to install R and standard Bioconductor packages3 How to perform data QA using Bioconductor simpleaffy package4 How to evaluate RNA degradation using RNA degradation slope5 How to perform QA in a batch mode6 How to interpret simpleaffy results and RNA degradation slope7 How to perform data QA using Bioconductor affyPLM package8 How to interpret the affyPLM QA results1 Why it is important to QA your microarray geneexpression data<strong>Gene</strong> expression levels measured by microarray experiments are obtainedthrough an elaborated procedure which is subject to many potentialvariations. It is critical to do adequate QA to make sure the data is <strong>of</strong> highquality and is consistent and comparable for further analysis. In some cases,arrays are too bad to be corrected, even with normalization; these arraysshould be removed from further analysis.When the microarray data is taken from a public repository for integratingstudy, it is especially essential to do data QA since the quality <strong>of</strong> the datavaries greatly from submitter to submitter. It is important to filter out baddata to maintain data integrity.<strong>Data</strong> quality is a relative term here. After the QA procedure, we would like toidentify microarray data with lower variability; outliers in the qualityassessment metrics are to be removed to ensure the homogeneity <strong>of</strong> thedata. For data integration, data generated by different laboratories should beevaluated using the same QC procedures and compared under the same QCscale. Only data with comparable QA metrics can be put together for furtheranalysis.This work is licensed under the Creative Commons Attribution-Share Alike 3.0 License. To view a copy<strong>of</strong> this license, visit http://creativecommons.org/licenses/by-sa/3.0/ or send a letter to Creative Commons, 543Howard Street, 5th Floor, San Francisco, California, 94105, USA.1
In the following sessions, you will learn how to perform QA on Affymetrix datausing several Bioconductor packages.2 How to install R and Standard Bioconductor packagesAs a brief introduction, Bioconductor is an open source and open developments<strong>of</strong>tware project to provide tools for the analysis and comprehension <strong>of</strong>genomic data. It is based primarily on programming language R, which is afree s<strong>of</strong>tware environment for statistical computing and graphics. We firstneed to install R and standard Bioconductor packages on your machine.Install RR can be downloaded from CRAN (Comprehensive R Archive Network)http://www.r-project.org/ . On the CRAN site, find a mirror site nearest you.Use the latest version <strong>of</strong> R; make sure to choose the download designated foryour preferred operating system. Then download the precompiled binarydistributions <strong>of</strong> the base system. Refer to the installation instruction (theREADME files) on the CRAN website for more details.Install Standard Bioconductor packagesThe installation can be accomplished by running the biocLite.R installationscript. Start running R; in an R command window, type the following: source ("http://www.bioconductor.org/biocLite.R") biocLite()Make sure the computer is connected to internet during the installation. Thisinstalls the following packages: affy, affydata, affyPLM, annaffy, annotate,Biobase, Biostrings, DynDoc, gcrma, genefilter, geneplotter, hgu95av2.db,limma, marray, matchprobes, multtest, ROC, simpleaffy, vsn, xtable,affyQCReport. The QA procedure we describe below will use the simpleaffyand affyPLM packages.2
3 How to perform data QA using Bioconductor simpleaffypackageOnce R and standard Bioconductor packages are installed, an Affymetrix QAmetrics can be produced using package simpleaffy. Each CEL file is analyzedindividually using simpleaffy and three QA metrics measurements areproduced: average background, scale factors, and percent present. These QAmeasurements are recommended by Affymetrix to evaluate the quality <strong>of</strong> RNAsamples and whether the labeling, hybridization and scanning procedures aredone properly. High average background level would affect signal-to-noiseratio and is likely due to problems in RNA sample preparation. As for scalefactor, the MAS 5.0 expression summary algorithm normalizes arrays byscaling them to a common value. If scale factors between arrays are large,then it is an indication that issues may occur when trying to compare betweenchips; present-and-absent calls can be used to flag genes as having beenreliably detected. The percentage <strong>of</strong> present calls is used to provide an overallmeasure <strong>of</strong> quality. Large variations in present calls between similar samplescan signal problems, especially when considered alongside scale factor andbackground level.Here is how to obtain the QA metrics:First load the simpleaffy package. library(“simpleaffy”)Read a CEL file (using E-GEOD-1008-raw-cel-1508900008.cel as an example)and create an object data data
c("affy_average_background",prettyNum(as.double(avgbg))) c("affy_scale_factor",prettyNum(sfs)) c("affy_percent_present",prettyNum(as.double(pp))) sink()Here is an example output file E-GEOD-1008-raw-cel-1508900008.cel.qc[1] "platform" "MG_U74Av2"[1] "affy_average_background" "580.3727"[1] "affy_scale_factor" "0.08205732"[1] "affy_percent_present" "43.70596"4 How to evaluate RNA degradation using RNA degradationslopeA fourth QA measurement one can get for Affymetrix data is RNA degradationslope. For each probeset, it basically numbers individual probes sequentiallyfrom 5’ end to the 3’ end. If the probes towards the 3’ end are systematicallystronger than those towards the 5’ end, the RNA degradation slope would beexcessively big and indicating RNA degradation. Bioconductor has a packageAffyRNAdeg that does the calculation: RNAdeg
percent present values. Arrays with very high average background should bediscarded from further analysis. For scale factors, the values should be within3-fold <strong>of</strong> each other. Extremely low value <strong>of</strong> percent present is an indication<strong>of</strong> poor quality.A typical RNA degradation slope varies by chip types. For high quality RNA, aslope <strong>of</strong> 0.5 is typical for HG-U95 and MG-U74 chips, while 1.7 is typical forHG-U133A chips. Slopes that are 2 fold or higher than these numbers indicateRNA degradation.You may plot the QA metrics values on a diagram and decide what the cut<strong>of</strong>fshould be used to remove outliers. Figures 1-4 are some example <strong>of</strong> QAmetrics distribution. Based on the distribution, it is easier to determine thecut<strong>of</strong>f values.Average Background distribution600Number <strong>of</strong> CEL files500400300200100MG_U740Av2MOE430AMouse430_2007014021028035042049056063070077086094010301910Avergae background valuesPercent Present distributionNumber <strong>of</strong> CEL files80070060050040030020010000 5 10 15 20 25 30 35 40 45 50 55 60 65Percent present valuesMG_U74Av2MOE430AMouse430_2Scale Factor distribution350Number <strong>of</strong> CEL files30025020015010050MG_U74Av2MOE430AMouse430_2000.81.62.43.244.95.78.110.416.724scale factor values5
RNA Degradation Slope distribution500Number 450 <strong>of</strong> CEL files400350300250200150100500-0.50.1 0.7 1.3 1.9 2.53.1 3.7 4.3 4.9 5.5 6.1 6.7 7.3 8 8.8 10. 11.4 12RNAdeg slope valuesMG_U74Av2MOE430AMouse430_2Figures 1 -4. Distribution <strong>of</strong> Affymetrix QA metrics values and RNAdegradation slope. The three lines with different colors represent threedifferent datasets generated on different array platforms.7 How to perform data QA using Bioconductor affyPLMpackageIn addition to the simpleaffy assessments, the CEL files can be furtherevaluated with probe level model (PLM). Bioconductor affyPLM package canbe used to do PLM fitting for CEL files (Bolstad 2005). Unlike simpleaffy andAffyRNAdeg, in which CEL file is evaluated one at a time, affyPLM takes allCEL files within one dataset and generates a probe level model object.Numerous useful quality assessment tools have been derived from the PLMfitting procedure. Here we introduce how to use two <strong>of</strong> the methods – theRelative Log <strong>Expression</strong> (RLE) procedure and the Normalized UnscaledStandard Error (NUSE) procedure.In a machine with large memory, load appropriate packages: require(affy) require(simpleaffy) require(affyPLM)Read a list <strong>of</strong> CEL files: files
sink(./nuse.stats) NUSE(plmStruct, type = “stats” ) sink()Example output for a RLE QA run; the format <strong>of</strong> the output <strong>of</strong> a NUSE run isthe same as this:E-GEOD-1008-raw-cel-1508899808.celE-GEOD-1008-raw-cel-1508899818.celmedian -0.09745975 0.04404993IQR 0.59707186 0.45582381E-GEOD-1008-raw-cel-1508899826.celE-GEOD-1008-raw-cel-1508899834.celmedian 0.0508637 0.07331429IQR 0.4090146 0.48258093E-GEOD-1008-raw-cel-1508899844.celE-GEOD-1008-raw-cel-1508899854.celmedian -0.06030324 0.03250762IQR 0.37609944 0.399493808 How to interpret the affyPLM QA resultsRLE values are computed for each probeset by comparing the expressionvalue on each array against the median expression value for that probesetacross all arrays. Assuming that most genes do not change in expressionlevels across arrays, it means that in theory the RLE values for these arraysshould be close to 0. The RLE values refer to the mean RLE values as shownin the above example. If you plot the RLE values for all arrays in a diagramsuch as Figure 5, a reasonable cut<strong>of</strong>f can be picked to remove arrays withpoor quality.Distribution <strong>of</strong> PLM rle Values200Number <strong>of</strong> CEL Files180160140120100806040200MG_U74Av2Mouse430_2MOE430A-0.3-0.2-0.2-0.1-00.020.080.140.20.260.320.380.44rle Values7
Figure 5. Distribution <strong>of</strong> affyPLM RLE values. The three lines with differentcolors represent three different datasets generated on different arrayplatforms.When NUSE is calculated, the standard error estimates obtained for each geneon each array from fitPLM are taken and standardized across arrays so thatthe median standard error for that gene is 1 across all arrays. This processaccounts for differences in variability between genes. An array with elevatedNUSE relative to the other arrays is typically <strong>of</strong> lower quality. The NUSE meanvalues can be plotted and a reasonable cut<strong>of</strong>f can be chosen. See Figure 6 foran example distribution plot <strong>of</strong> NUSE values for three different datasets.Distribution <strong>of</strong> PLM nuse ValuesNumber <strong>of</strong> CEL Files80070060050040030020010000.9811.021.041.061.081.1nuse values1.121.141.161.181.21.24MG_U74Av2Mouse430_2MOE430AFigure 6. Distribution <strong>of</strong> affyPLM NUSE values. The three lines with differentcolors represent three different datasets generated on different arrayplatforms.8
AppendixA R script that allows QA CEL files in batch mode# Run using the following command:# R CMD BATCH -input= -output= .input
file=outfile, append=FALSE);capture.output(c("affy_average_background",prettyNum(as.double(celavgbg))),file=outfile, append=TRUE);capture.output(c("affy_scale_factor",prettyNum(sfs(celqc))),file=outfile, append=TRUE);capture.output(c("affy_percent_present",prettyNum(as.double(perc))),file=outfile, append=TRUE);capture.output(c("affy_RNAdeg_slope",prettyNum(RNAdeg$slope)),file=outfile, append=TRUE);}scorecel(infile=input, outfile=output);GlossaryBioconductorBioconductor is an open source and open development s<strong>of</strong>tware project to providetools for the analysis and comprehension <strong>of</strong> genomic data. The website forBioconductor is http://www.bioconductor.org/RR is a free programming language and s<strong>of</strong>tware environment for statistical computingand graphics. It compiles and runs on a wide variety <strong>of</strong> UNIX platforms, Windows andMacOS. The website is http://www.r-project.org/simpleaffysimpleaffy is a Bioconductor package designed to provide a starting point for exploringAffymetrix data, and to provide functions for some <strong>of</strong> the most common tasks wefound ourselves doing over and over again. It also provides access to many <strong>of</strong> thestandard QC functions recommended for Affymetrix arrays.affyPLMaffyPLM is a package that extends and improves the functionality <strong>of</strong> the base affypackage. Central focus is on implementation <strong>of</strong> methods for fitting probe-levelmethods and tools using these models. It also provides PLM based quality assessmenttools. http://www.bioconductor.org/packages/bioc/1.8/html/affyPLM.htmlArrayExpressArrayExpress is a public repository for transcriptomics data, which is aimed at storingMIAME- and MINSEQE-compliant data in accordance with MGED recommendations.The ArrayExpress <strong>Data</strong> Warehouse stores gene-indexed expression pr<strong>of</strong>iles from acurated subset <strong>of</strong> experiments in the repository.http://www.ebi.ac.uk/microarray-as/aer/#ae-main[0]10
Further reading1. Claire L. Wilson and Crispin J. Miller (2005) Simpleaffy: a BioConductor packagefor Affymetrix <strong>Quality</strong> Control and data analysis. Bioinformatics 2005 21(18):3683-36852. Bolstad BM, Irizarry RA, Gautier L, and Wu Z. (2005) Preprocessing High-densityOligonucleotide Arrays in Bioinformatics and Computational Biology SolutionsUsing R and Bioconductor. Gentleman R, Carey V, Huber W, Irizarry R, and DudoitS. (Eds.), Springer, 2005.3. Bolstad BM (2007) affPLM: Model based QC assessment <strong>of</strong> Affymetrix <strong>Gene</strong>Chips.http://www.bioconductor.org/packages/bioc/1.8/vignettes/affyPLM/inst/doc/<strong>Quality</strong>Assess.pdf4. Audrey Kauffmann <strong>of</strong> EBI is developing an R package which in combination witharrayQaulityMetrics will allow direct QA <strong>of</strong> microarray data from ArrayExpress.array<strong>Quality</strong>Metrics is another QA package EBI developed; it can perform QA onarrays made by manufactures other than Affymetrix. We will introduce how to usethese packages when the new one is released to Bioconductor.What to do nextOnce you have read this tutorial, you might want to test your understanding by trying the QAprocesses using your own CEL files.11