Quality Assessment of Microarray Gene Expression Data
Quality Assessment of Microarray Gene Expression Data
Quality Assessment of Microarray Gene Expression Data

You also want an ePaper? Increase the reach of your titles
YUMPU automatically turns print PDFs into web optimized ePapers that Google loves.
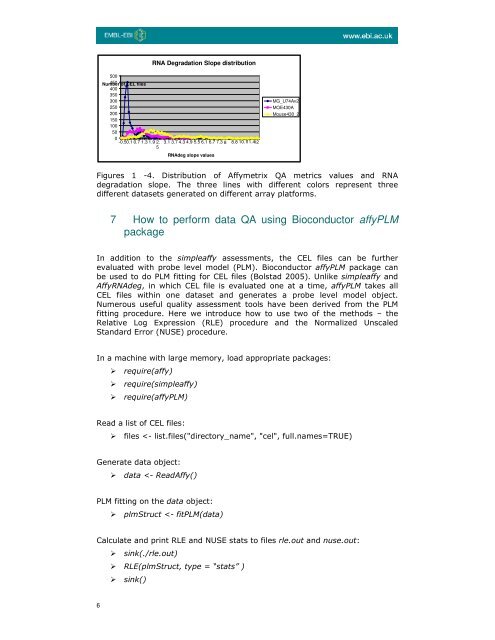
RNA Degradation Slope distribution500Number 450 <strong>of</strong> CEL files400350300250200150100500-0.50.1 0.7 1.3 1.9 2.53.1 3.7 4.3 4.9 5.5 6.1 6.7 7.3 8 8.8 10. 11.4 12RNAdeg slope valuesMG_U74Av2MOE430AMouse430_2Figures 1 -4. Distribution <strong>of</strong> Affymetrix QA metrics values and RNAdegradation slope. The three lines with different colors represent threedifferent datasets generated on different array platforms.7 How to perform data QA using Bioconductor affyPLMpackageIn addition to the simpleaffy assessments, the CEL files can be furtherevaluated with probe level model (PLM). Bioconductor affyPLM package canbe used to do PLM fitting for CEL files (Bolstad 2005). Unlike simpleaffy andAffyRNAdeg, in which CEL file is evaluated one at a time, affyPLM takes allCEL files within one dataset and generates a probe level model object.Numerous useful quality assessment tools have been derived from the PLMfitting procedure. Here we introduce how to use two <strong>of</strong> the methods – theRelative Log <strong>Expression</strong> (RLE) procedure and the Normalized UnscaledStandard Error (NUSE) procedure.In a machine with large memory, load appropriate packages: require(affy) require(simpleaffy) require(affyPLM)Read a list <strong>of</strong> CEL files: files