Quality Assessment of Microarray Gene Expression Data
Quality Assessment of Microarray Gene Expression Data
Quality Assessment of Microarray Gene Expression Data

Create successful ePaper yourself
Turn your PDF publications into a flip-book with our unique Google optimized e-Paper software.
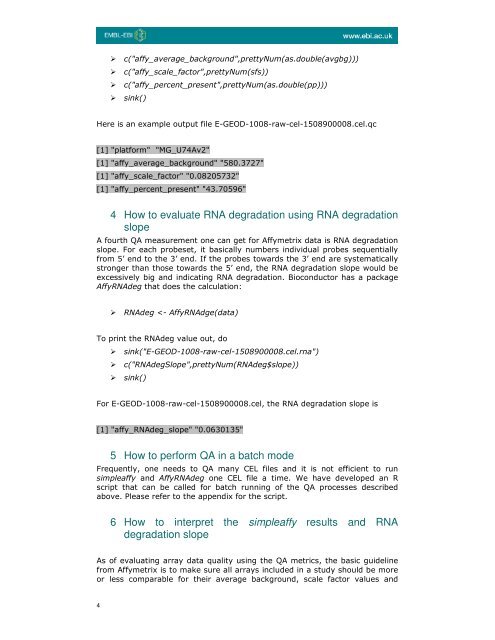
c("affy_average_background",prettyNum(as.double(avgbg))) c("affy_scale_factor",prettyNum(sfs)) c("affy_percent_present",prettyNum(as.double(pp))) sink()Here is an example output file E-GEOD-1008-raw-cel-1508900008.cel.qc[1] "platform" "MG_U74Av2"[1] "affy_average_background" "580.3727"[1] "affy_scale_factor" "0.08205732"[1] "affy_percent_present" "43.70596"4 How to evaluate RNA degradation using RNA degradationslopeA fourth QA measurement one can get for Affymetrix data is RNA degradationslope. For each probeset, it basically numbers individual probes sequentiallyfrom 5’ end to the 3’ end. If the probes towards the 3’ end are systematicallystronger than those towards the 5’ end, the RNA degradation slope would beexcessively big and indicating RNA degradation. Bioconductor has a packageAffyRNAdeg that does the calculation: RNAdeg