ANNUAL REPORt 2011 - Investor Relations - Johnson & Johnson
ANNUAL REPORt 2011 - Investor Relations - Johnson & Johnson
ANNUAL REPORt 2011 - Investor Relations - Johnson & Johnson

You also want an ePaper? Increase the reach of your titles
YUMPU automatically turns print PDFs into web optimized ePapers that Google loves.
Interest expense in 2010 was relatively flat as compared to<br />
2009duetoaloweraverageratedespiteahigherdebtbalance.The<br />
total debt balance at the end of 2010 was $16.8 billion as compared<br />
to $14.5 billion at the end of 2009. The higher average debt balance<br />
of $15.7 billion in 2010 versus $13.5 billion in 2009 was due to<br />
increased borrowings. The Company increased borrowings, capitalizing<br />
on favorable terms in the capital markets. The proceeds of the<br />
borrowings were used for general corporate purposes.<br />
Interest income in 2009 decreased by $271 million as compared<br />
to 2008 due to lower rates of interest earned despite higher<br />
average cash balances. The cash balance, including marketable<br />
securities, was $19.4 billion at the end of 2009, and averaged<br />
$15.6 billion as compared to the $12.2 billion average cash balance<br />
in 2008. The increase in the average cash balance was primarily<br />
due to cash generated from operating activities.<br />
Interest expense in 2009 increased by $16 million as compared<br />
to 2008 due to a higher debt balance. The net debt balance at the<br />
end of 2009 was $14.5 billion as compared to $11.9 billion at the end<br />
of 2008. The higher average debt balance of $13.5 billion in 2009<br />
versus $12.9 billion in 2008 was primarily related to funding acquisitions<br />
and investments and the purchase of the Company’s Common<br />
Stock under the Common Stock repurchase program announced<br />
on July 9, 2007.<br />
Provision for Taxes on Income: The worldwide effective income tax<br />
rate was 21.8% in <strong>2011</strong>, 21.3% in 2010 and 22.1% in 2009. The <strong>2011</strong><br />
tax rate increased as compared to 2010 due to certain U.S. expenses<br />
which are not fully tax deductible and higher U.S. state taxes partially<br />
offset by increases in taxable income in lower tax jurisdictions<br />
relative to higher tax jurisdictions. The 2010 tax rate decreased as<br />
compared to 2009 due to decreases in taxable income in higher tax<br />
jurisdictions relative to taxable income in lower tax jurisdictions and<br />
certain U.S. tax adjustments.<br />
Liquidity and Capital Resources<br />
LIQUIDITY & CASH FLOWS<br />
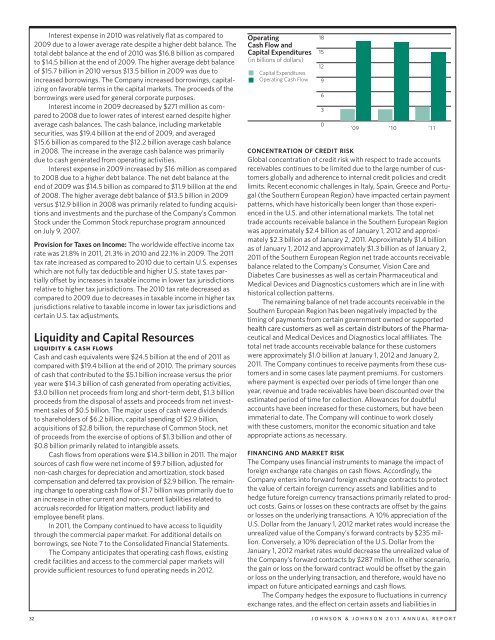
Cash and cash equivalents were $24.5 billion at the end of <strong>2011</strong> as<br />
compared with $19.4 billion at the end of 2010. The primary sources<br />
of cash that contributed to the $5.1 billion increase versus the prior<br />
year were $14.3 billion of cash generated from operating activities,<br />
$3.0 billion net proceeds from long and short-term debt, $1.3 billion<br />
proceeds from the disposal of assets and proceeds from net investment<br />
sales of $0.5 billion. The major uses of cash were dividends<br />
to shareholders of $6.2 billion, capital spending of $2.9 billion,<br />
acquisitions of $2.8 billion, the repurchase of Common Stock, net<br />
of proceeds from the exercise of options of $1.3 billion and other of<br />
$0.8 billion primarily related to intangible assets.<br />
Cash flows from operations were $14.3 billion in <strong>2011</strong>. The major<br />
sources of cash flow were net income of $9.7 billion, adjusted for<br />
non-cash charges for depreciation and amortization, stock based<br />
compensation and deferred tax provision of $2.9 billion. The remaining<br />
change to operating cash flow of $1.7 billion was primarily due to<br />
an increase in other current and non-current liabilities related to<br />
accruals recorded for litigation matters, product liability and<br />
employee benefit plans.<br />
In <strong>2011</strong>, the Company continued to have access to liquidity<br />
through the commercial paper market. For additional details on<br />
borrowings, see Note 7 to the Consolidated Financial Statements.<br />
The Company anticipates that operating cash flows, existing<br />
credit facilities and access to the commercial paper markets will<br />
provide sufficient resources to fund operating needs in 2012.<br />
Operating<br />
Cash Flow and<br />
Capital Expenditures<br />
(in billions of dollars)<br />
Capital Expenditures<br />
Operating Cash Flow<br />
CONCENTRATION OF CREDIT RISK<br />
Global concentration of credit risk with respect to trade accounts<br />
receivables continues to be limited due to the large number of customers<br />
globally and adherence to internal credit policies and credit<br />
limits. Recent economic challenges in Italy, Spain, Greece and Portugal<br />
(the Southern European Region) have impacted certain payment<br />
patterns, which have historically been longer than those experienced<br />
in the U.S. and other international markets. The total net<br />
trade accounts receivable balance in the Southern European Region<br />
was approximately $2.4 billion as of January 1, 2012 and approximately<br />
$2.3 billion as of January 2, <strong>2011</strong>. Approximately $1.4 billion<br />
as of January 1, 2012 and approximately $1.3 billion as of January 2,<br />
<strong>2011</strong> of the Southern European Region net trade accounts receivable<br />
balance related to the Company’s Consumer, Vision Care and<br />
Diabetes Care businesses as well as certain Pharmaceutical and<br />
Medical Devices and Diagnostics customers which are in line with<br />
historical collection patterns.<br />
The remaining balance of net trade accounts receivable in the<br />
Southern European Region has been negatively impacted by the<br />
timing of payments from certain government owned or supported<br />
ceutical and Medical Devices and Diagnostics local affiliates. The<br />
total net trade accounts receivable balance for these customers<br />
were approximately $1.0 billion at January 1, 2012 and January 2,<br />
<strong>2011</strong>. The Company continues to receive payments from these customers<br />
and in some cases late payment premiums. For customers<br />
where payment is expected over periods of time longer than one<br />
year, revenue and trade receivables have been discounted over the<br />
estimated period of time for collection. Allowances for doubtful<br />
accounts have been increased for these customers, but have been<br />
immaterial to date. The Company will continue to work closely<br />
with these customers, monitor the economic situation and take<br />
appropriate actions as necessary.<br />
FINANCING AND MARKET RISK<br />
The Company uses financial instruments to manage the impact of<br />
foreign exchange rate changes on cash flows. Accordingly, the<br />
Company enters into forward foreign exchange contracts to protect<br />
the value of certain foreign currency assets and liabilities and to<br />
hedge future foreign currency transactions primarily related to product<br />
costs. Gains or losses on these contracts are offset by the gains<br />
or losses on the underlying transactions. A 10% appreciation of the<br />
U.S. Dollar from the January 1, 2012 market rates would increase the<br />
unrealized value of the Company’s forward contracts by $235 million.<br />
Conversely, a 10% depreciation of the U.S. Dollar from the<br />
January 1, 2012 market rates would decrease the unrealized value of<br />
the Company’s forward contracts by $287 million. In either scenario,<br />
the gain or loss on the forward contract would be offset by the gain<br />
or loss on the underlying transaction, and therefore, would have no<br />
impact on future anticipated earnings and cash flows.<br />
The Company hedges the exposure to fluctuations in currency<br />
exchange rates, and the effect on certain assets and liabilities in<br />
32 JOHNSON & JOHNSON <strong>2011</strong> <strong>ANNUAL</strong> REPORT<br />
18<br />
15<br />
12<br />
9<br />
6<br />
3<br />
0<br />
’09 ’10 ’11<br />
health care customers as well as certain distributors of the Pharma-