ANNUAL REPORt 2011 - Investor Relations - Johnson & Johnson
ANNUAL REPORt 2011 - Investor Relations - Johnson & Johnson
ANNUAL REPORt 2011 - Investor Relations - Johnson & Johnson

Create successful ePaper yourself
Turn your PDF publications into a flip-book with our unique Google optimized e-Paper software.
Company generally issues credit to customers for returned goods.<br />
The Company’s sales returns reserves are accounted for in accordance<br />
with the U.S. GAAP guidance for revenue recognition when<br />
right of return exists. Sales returns reserves are recorded at full sales<br />
value. Sales returns in the Consumer and Pharmaceutical segments<br />
are almost exclusively not resalable. Sales returns for certain franchises<br />
in the Medical Devices and Diagnostics segment are typically<br />
resalable but are not material. The Company rarely exchanges products<br />
from inventory for returned products. The sales returns reserve<br />
for the total Company has ranged between 1.0% and 1.2% of annual<br />
net trade sales during the prior three fiscal reporting years <strong>2011</strong>,<br />
2010 and 2009.<br />
Promotional programs, such as product listing allowances and<br />
cooperative advertising arrangements, are recorded in the year<br />
incurred. Continuing promotional programs include coupons and<br />
volume-based sales incentive programs. The redemption cost of<br />
consumer coupons is based on historical redemption experience by<br />
product and value. Volume-based incentive programs are based on<br />
estimated sales volumes for the incentive period and are recorded<br />
as products are sold. The Company also earns service revenue for<br />
co-promotion of certain products. For all years presented, service<br />
revenues were less than 2% of total revenues and are included in<br />
sales to customers. These arrangements are evaluated to determine<br />
the appropriate amounts to be deferred.<br />
In addition, the Company enters into collaboration arrangements<br />
that contain multiple revenue generating activities. The<br />
revenue for these arrangements is recognized as each activity is<br />
performed or delivered, based on the relative fair value. Upfront<br />
fees received as part of these arrangements are deferred and recognized<br />
as revenue earned over the obligation period. See Note 1 to<br />
the Consolidated Financial Statements for additional disclosures<br />
on collaborations.<br />
Reasonably likely changes to assumptions used to calculate the<br />
accruals for rebates, returns and promotions are not anticipated to<br />
have a material effect on the financial statements. The Company<br />
currently discloses the impact of changes to assumptions in the<br />
quarterly or annual filing in which there is a material financial<br />
statement impact.<br />
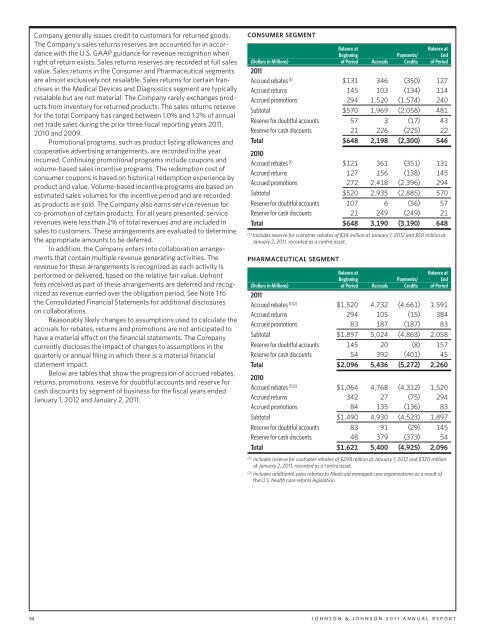
Below are tables that show the progression of accrued rebates,<br />
returns, promotions, reserve for doubtful accounts and reserve for<br />
cash discounts by segment of business for the fiscal years ended<br />
January 1, 2012 and January 2, <strong>2011</strong>.<br />
CONSUMER SEGMENT<br />
Balance at Balance at<br />
Beginning Payments/ End<br />
(Dollars in Millions) of Period Accruals Credits of Period<br />
<strong>2011</strong><br />
Accrued rebates (1) $131 346 (350) 127<br />
Accrued returns 145 103 (134) 114<br />
Accrued promotions 294 1,520 (1,574) 240<br />
Subtotal $570 1,969 (2,058) 481<br />
Reserve for doubtful accounts 57 3 (17) 43<br />
Reserve for cash discounts 21 226 (225) 22<br />
Total $648 2,198 (2,300) 546<br />
2010<br />
Accrued rebates (1) $121 361 (351) 131<br />
Accrued returns 127 156 (138) 145<br />
Accrued promotions 272 2,418 (2,396) 294<br />
Subtotal $520 2,935 (2,885) 570<br />
Reserve for doubtful accounts 107 6 (56) 57<br />
Reserve for cash discounts 21 249 (249) 21<br />
Total $648 3,190 (3,190) 648<br />
(1) Includes reserve for customer rebates of $34 million at January 1, 2012 and $50 million at<br />
January 2, <strong>2011</strong>, recorded as a contra asset.<br />
PHARMACEUTICAL SEGMENT<br />
Balance at Balance at<br />
Beginning Payments/ End<br />
(Dollars in Millions) of Period Accruals Credits of Period<br />
<strong>2011</strong><br />
Accrued rebates (1)(2) $1,520 4,732 (4,661) 1,591<br />
Accrued returns 294 105 (15) 384<br />
Accrued promotions 83 187 (187) 83<br />
Subtotal $1,897 5,024 (4,863) 2,058<br />
Reserve for doubtful accounts 145 20 (8) 157<br />
Reserve for cash discounts 54 392 (401) 45<br />
Total $2,096 5,436 (5,272) 2,260<br />
2010<br />
Accrued rebates (1)(2) $1,064 4,768 (4,312) 1,520<br />
Accrued returns 342 27 (75) 294<br />
Accrued promotions 84 135 (136) 83<br />
Subtotal $1,490 4,930 (4,523) 1,897<br />
Reserve for doubtful accounts 83 91 (29) 145<br />
Reserve for cash discounts 48 379 (373) 54<br />
Total $1,621 5,400 (4,925) 2,096<br />
(1) Includes reserve for customer rebates of $298 million at January 1, 2012 and $320 million<br />
at January 2, <strong>2011</strong>, recorded as a contra asset.<br />
(2) Includes additional sales rebates to Medicaid managed care organizations as a result of<br />
the U.S. health care reform legislation.<br />
34 JOHNSON & JOHNSON <strong>2011</strong> <strong>ANNUAL</strong> REPORT