ANNUAL REPORt 2011 - Investor Relations - Johnson & Johnson
ANNUAL REPORt 2011 - Investor Relations - Johnson & Johnson
ANNUAL REPORt 2011 - Investor Relations - Johnson & Johnson

Create successful ePaper yourself
Turn your PDF publications into a flip-book with our unique Google optimized e-Paper software.
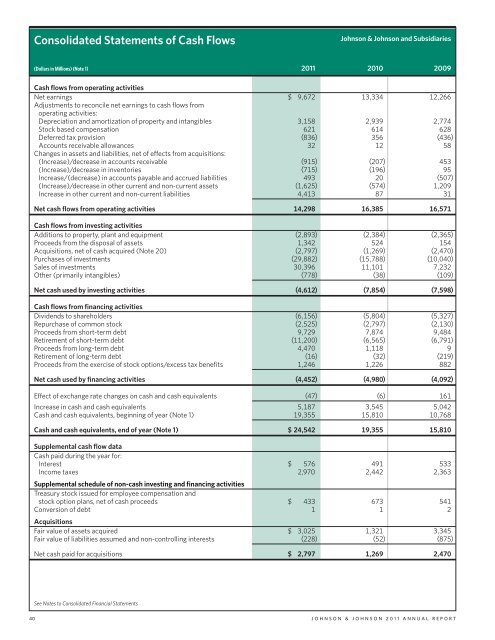
Consolidated Statements of Cash Flows<br />
<strong>Johnson</strong> & <strong>Johnson</strong> and Subsidiaries<br />
(Dollars in Millions) (Note 1) <strong>2011</strong> 2010 2009<br />
Cash flows from operating activities<br />
Net earnings $ 9,672 13,334 12,266<br />
Adjustments to reconcile net earnings to cash flows from<br />
operating activities:<br />
Depreciation and amortization of property and intangibles 3,158 2,939 2,774<br />
Stock based compensation 621 614 628<br />
Deferred tax provision (836) 356 (436)<br />
Accounts receivable allowances 32 12 58<br />
Changes in assets and liabilities, net of effects from acquisitions:<br />
(Increase)/decrease in accounts receivable (915) (207) 453<br />
(Increase)/decrease in inventories (715) (196) 95<br />
Increase/(decrease) in accounts payable and accrued liabilities 493 20 (507)<br />
(Increase)/decrease in other current and non-current assets (1,625) (574) 1,209<br />
Increase in other current and non-current liabilities 4,413 87 31<br />
Net cash flows from operating activities 14,298 16,385 16,571<br />
Cash flows from investing activities<br />
Additions to property, plant and equipment (2,893) (2,384) (2,365)<br />
Proceeds from the disposal of assets 1,342 524 154<br />
Acquisitions, net of cash acquired (Note 20) (2,797) (1,269) (2,470)<br />
Purchases of investments (29,882) (15,788) (10,040)<br />
Sales of investments 30,396 11,101 7,232<br />
Other (primarily intangibles) (778) (38) (109)<br />
Net cash used by investing activities (4,612) (7,854) (7,598)<br />
Cash flows from financing activities<br />
Dividends to shareholders (6,156) (5,804) (5,327)<br />
Repurchase of common stock (2,525) (2,797) (2,130)<br />
Proceeds from short-term debt 9,729 7,874 9,484<br />
Retirement of short-term debt (11,200) (6,565) (6,791)<br />
Proceeds from long-term debt 4,470 1,118 9<br />
Retirement of long-term debt (16) (32) (219)<br />
Proceeds from the exercise of stock options/excess tax benefits 1,246 1,226 882<br />
Net cash used by financing activities (4,452) (4,980) (4,092)<br />
Effect of exchange rate changes on cash and cash equivalents (47) (6) 161<br />
Increase in cash and cash equivalents 5,187 3,545 5,042<br />
Cash and cash equivalents, beginning of year (Note 1) 19,355 15,810 10,768<br />
Cash and cash equivalents, end of year (Note 1) $ 24,542 19,355 15,810<br />
Supplemental cash flow data<br />
Cash paid during the year for:<br />
Interest $ 576 491 533<br />
Income taxes<br />
Supplemental schedule of non-cash investing and financing activities<br />
Treasury stock issued for employee compensation and<br />
2,970 2,442 2,363<br />
stock option plans, net of cash proceeds $ 433 673 541<br />
Conversion of debt<br />
Acquisitions<br />
1 1 2<br />
Fair value of assets acquired $ 3,025 1,321 3,345<br />
Fair value of liabilities assumed and non-controlling interests (228) (52) (875)<br />
Net cash paid for acquisitions $ 2,797 1,269 2,470<br />
See Notes to Consolidated Financial Statements<br />
40 JOHNSON & JOHNSON <strong>2011</strong> <strong>ANNUAL</strong> REPORT