Molecular Orbital Energies and Correlation Diagram for ...
Molecular Orbital Energies and Correlation Diagram for ...
Molecular Orbital Energies and Correlation Diagram for ...
- No tags were found...

Create successful ePaper yourself
Turn your PDF publications into a flip-book with our unique Google optimized e-Paper software.
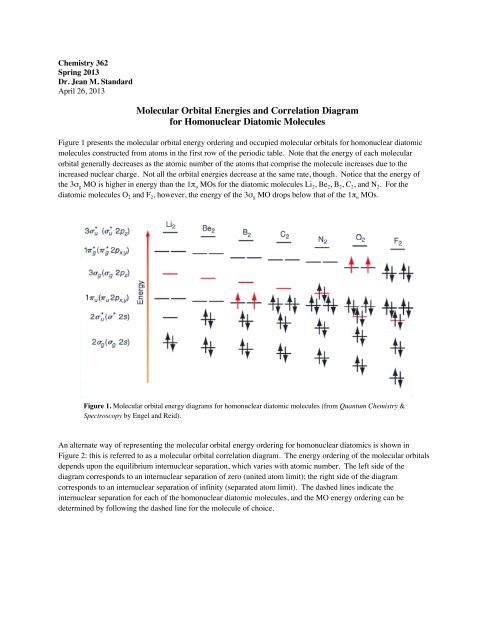
Chemistry 362Spring 2013Dr. Jean M. St<strong>and</strong>ardApril 26, 2013<strong>Molecular</strong> <strong>Orbital</strong> <strong>Energies</strong> <strong>and</strong> <strong>Correlation</strong> <strong>Diagram</strong><strong>for</strong> Homonuclear Diatomic MoleculesFigure 1 presents the molecular orbital energy ordering <strong>and</strong> occupied molecular orbitals <strong>for</strong> homonuclear diatomicmolecules constructed from atoms in the first row of the periodic table. Note that the energy of each molecularorbital generally decreases as the atomic number of the atoms that comprise the molecule increases due to theincreased nuclear charge. Not all the orbital energies decrease at the same rate, though. Notice that the energy ofthe 3σ g MO is higher in energy than the 1π u MOs <strong>for</strong> the diatomic molecules Li 2 , Be 2 , B 2 , C 2 , <strong>and</strong> N 2 . For thediatomic molecules O 2 <strong>and</strong> F 2 , however, the energy of the 3σ g MO drops below that of the 1π u MOs.Figure 1. <strong>Molecular</strong> orbital energy diagrams <strong>for</strong> homonuclear diatomic molecules (from Quantum Chemistry &Spectroscopy by Engel <strong>and</strong> Reid).An alternate way of representing the molecular orbital energy ordering <strong>for</strong> homonuclear diatomics is shown inFigure 2: this is referred to as a molecular orbital correlation diagram. The energy ordering of the molecular orbitalsdepends upon the equilibrium internuclear separation, which varies with atomic number. The left side of thediagram corresponds to an internuclear separation of zero (united atom limit); the right side of the diagramcorresponds to an internuclear separation of infinity (separated atom limit). The dashed lines indicate theinternuclear separation <strong>for</strong> each of the homonuclear diatomic molecules, <strong>and</strong> the MO energy ordering can bedetermined by following the dashed line <strong>for</strong> the molecule of choice.
Figure 2. Diatomic molecule MO correlation diagram (from Physical Chemistry by Alberty <strong>and</strong> Silbey).2