View this Presentation (PDF 4.91 MB) - RioCan
View this Presentation (PDF 4.91 MB) - RioCan
View this Presentation (PDF 4.91 MB) - RioCan
SHOW LESS
- No tags were found...

Create successful ePaper yourself
Turn your PDF publications into a flip-book with our unique Google optimized e-Paper software.
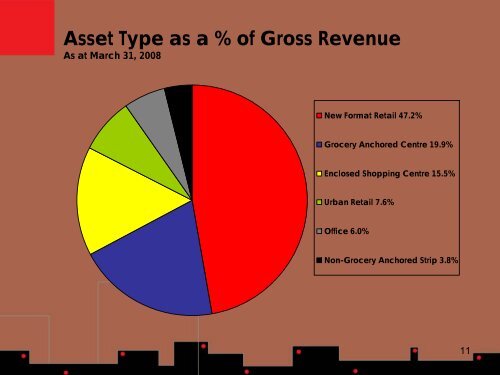
Asset Type as a % of Gross RevenueAs at March 31, 2008New Format Retail 47.2%Grocery Anchored Centre 19.9%Enclosed Shopping Centre 15.5%Urban Retail 7.6%Office 6.0%Non-Grocery Anchored Strip 3.8%11