Procedures for forest experiments and demonstration plots - Valbro
Procedures for forest experiments and demonstration plots - Valbro
Procedures for forest experiments and demonstration plots - Valbro

You also want an ePaper? Increase the reach of your titles
YUMPU automatically turns print PDFs into web optimized ePapers that Google loves.
150<br />
160<br />
170<br />
180<br />
For area-based variables: Number of replicates should also depend on production risk. There should<br />
always be a minimum of two replicates, at least <strong>for</strong> the extreme treatments.<br />
The number of treatments should be balanced with the number of replications.<br />
For variables based on individual trees (or parts of trees): Use statistical <strong>for</strong>mulas.<br />
Within-site replication of treatments should be preferred over additional variations of treatments.<br />
If such additional variations are desired, <strong>for</strong> whatever reason, <strong>and</strong> the l<strong>and</strong> area available is<br />
insufficient, a compromise may be made by replicating a combination of highly relevant treatments<br />
<strong>and</strong> extreme treatments with unreplicated <strong>plots</strong> of treatment variations.<br />
Size <strong>and</strong> shape of <strong>plots</strong><br />
Size of <strong>plots</strong><br />
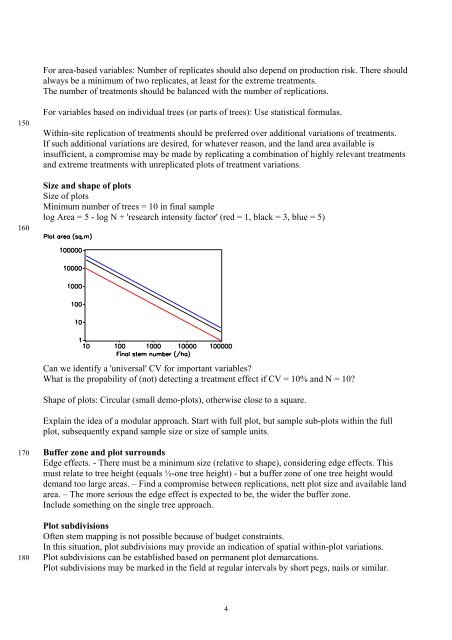
Minimum number of trees = 10 in final sample<br />
log Area = 5 - log N + 'research intensity factor' (red = 1, black = 3, blue = 5)<br />
Can we identify a 'universal' CV <strong>for</strong> important variables?<br />
What is the propability of (not) detecting a treatment effect if CV = 10% <strong>and</strong> N = 10?<br />
Shape of <strong>plots</strong>: Circular (small demo-<strong>plots</strong>), otherwise close to a square.<br />
Explain the idea of a modular approach. Start with full plot, but sample sub-<strong>plots</strong> within the full<br />
plot, subsequently exp<strong>and</strong> sample size or size of sample units.<br />
Buffer zone <strong>and</strong> plot surrounds<br />
Edge effects. - There must be a minimum size (relative to shape), considering edge effects. This<br />
must relate to tree height (equals ½-one tree height) - but a buffer zone of one tree height would<br />
dem<strong>and</strong> too large areas. – Find a compromise between replications, nett plot size <strong>and</strong> available l<strong>and</strong><br />
area. – The more serious the edge effect is expected to be, the wider the buffer zone.<br />
Include something on the single tree approach.<br />
Plot subdivisions<br />
Often stem mapping is not possible because of budget constraints.<br />
In this situation, plot subdivisions may provide an indication of spatial within-plot variations.<br />
Plot subdivisions can be established based on permanent plot demarcations.<br />
Plot subdivisions may be marked in the field at regular intervals by short pegs, nails or similar.<br />
4