8. Examples on Using the Smith Chart
8. Examples on Using the Smith Chart
8. Examples on Using the Smith Chart

You also want an ePaper? Increase the reach of your titles
YUMPU automatically turns print PDFs into web optimized ePapers that Google loves.
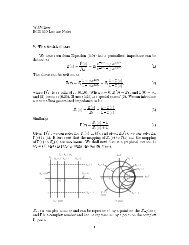
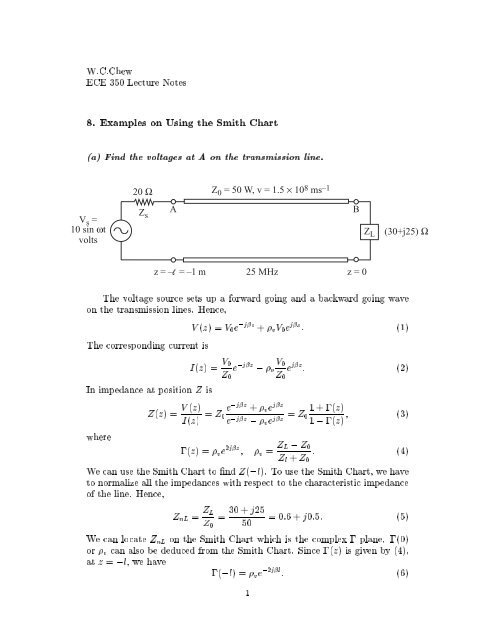
W.C.ChewECE 350 Lecture Notes<str<strong>on</strong>g>8.</str<strong>on</strong>g> <str<strong>on</strong>g>Examples</str<strong>on</strong>g> <strong>on</strong> <strong>Using</strong> <strong>the</strong> <strong>Smith</strong> <strong>Chart</strong>(a) Find <strong>the</strong> voltages at A <strong>on</strong> <strong>the</strong> transmissi<strong>on</strong> line.20 ΩZ 0 = 50 W, v = 1.5 × 10 8 ms –1V s =10 sin ωtvoltsZ sABZ L(30+j25) Ωz = –l = –1 m25 MHzz = 0The voltage source sets up a forward going and a backward going wave<strong>on</strong> <strong>the</strong> transmissi<strong>on</strong> lines. Hence,The corresp<strong>on</strong>ding current isIn impedance at positi<strong>on</strong> Z isV (z) =V 0 e ;jz + v V 0 e jz : (1)I(z) = V 0Z 0e ;jz ; vV 0Z 0e jz : (2)Z(z) = V (z)I(z) = Z e ;jz + v e jz0e ;jz ; v e = Z 1+;(z)jz 01 ; ;(z) (3)where;(z) = v e 2jz v = Z L ; Z 0: (4)Z l + Z 0We can use <strong>the</strong> <strong>Smith</strong> <strong>Chart</strong> to nd Z(;l). To use <strong>the</strong> <strong>Smith</strong> <strong>Chart</strong>, we haveto normalize all <strong>the</strong> impedances with respect to <strong>the</strong> characteristic impedanceof <strong>the</strong> line. Hence,Z nL = Z LZ 0=30 + j2550=0:6+j0:5: (5)We can locate Z nL <strong>on</strong> <strong>the</strong> <strong>Smith</strong> <strong>Chart</strong> which is <strong>the</strong> complex ; plane. ;(0)or v can also be deduced from <strong>the</strong> <strong>Smith</strong> <strong>Chart</strong>. Since ;(z) is given by (4),at z = ;l, we have;(;l) = v e ;2jl : (6)1
At f = 25MHz, and with v = 1:5 10 8 ms ;1 , = v=f = 6m. Thenl = 2l = l. Therefore, 3;(;l) = v e ;j 2 3 l : (7)At z = ;l = ;1m ;(;1) = v e ;j 2 3 . From <strong>the</strong> <strong>Smith</strong> <strong>Chart</strong>, we can readZ n (;1)=2:15 ; j0:3 or Z(;1) = 107:5 ; j15 : (8)So, an equivalent circuit for <strong>the</strong> point A is:20 ΩAV s = 10 sin ωtZsZ(–1)(107.5–j15) ΩSinceIn phasor representati<strong>on</strong>, V S =10e ;j 2Z(;1)V A = V SZ S + Z(;1)= ;j10. Hence,= ;j10107:5; j15127:5 ; j15 = 108:54e;j7:9128:38e ;j6:7 e;j90 10V=8:5e ;j91:2 V: (9)V A = V (;1) = V 0 e j [1 + ;(;1)] (10)we can nd V o from <strong>the</strong> above. Once V o is found, we can nd V B fromV B = V (0) = V o [1 + v ]: (11)j1j0.5j2j0.2z Lρ V20120 o Γ(-l)Z(-l)0.2 0.5 1 2−j0.2−j0.5−j2−j1
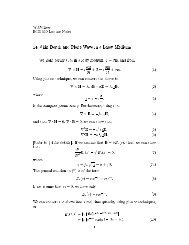
(b) Find Z L from VSWR and d min using a <strong>Smith</strong> <strong>Chart</strong>The voltage <strong>on</strong> <strong>the</strong> transmissi<strong>on</strong> line isV (z) =V o (e ;jz + v e +jz )=V o e ;jz [1 + ;(z)]: (12)If V (z) =jV (z)je j(z) , <strong>the</strong> real time voltage can be written asV (z t) =
j1j0.5j2j0.2ρVZ=-d Rn=2.5=VSWRmin00.2 0.5 1 25λ16−j0.2−j0.5−j2−j14