Test Analysis, Operational Scaling and Scoring
Test Analysis, Operational Scaling and Scoring
Test Analysis, Operational Scaling and Scoring

You also want an ePaper? Increase the reach of your titles
YUMPU automatically turns print PDFs into web optimized ePapers that Google loves.
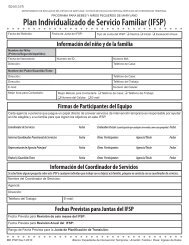
2007-2008 MSA Science Annual Technical Manual<strong>Test</strong> <strong>Analysis</strong>, <strong>Operational</strong> <strong>Scaling</strong> <strong>and</strong> <strong>Scoring</strong><strong>Test</strong> <strong>Analysis</strong>IRT item parameter estimates were used to generate test characteristic curves (TCCs), testinformation functions (TIFs), <strong>and</strong> conditional st<strong>and</strong>ard errors of measure (CSEM). These indiceswere computed for each of the base forms, form-to-form linking items, <strong>and</strong> entire item pool.Figure 1 shows the overlaid TCC plots for Form A, B, linking item set <strong>and</strong> the entire item poolfor grade 5. The TCC <strong>and</strong> TIF values were divided by the total number of score points for eachform so that the curves can be plotted on the same scale. Figure 2 displays test informationcurves for Form A, B, linking item set <strong>and</strong> the entire item pool. Figure 3 illustrates theconditional st<strong>and</strong>ard error of measurements for the four tests.Figure 1. <strong>Test</strong> Characteristic Curve of the Grade 5 Science <strong>Test</strong>Pearson/MSDE Confidential 18
2007-2008 MSA Science Annual Technical ManualFigure 2. <strong>Test</strong> Information Function of the Grade 5 Science <strong>Test</strong>Pearson/MSDE Confidential 19
2007-2008 MSA Science Annual Technical ManualFigure 3. Conditional St<strong>and</strong>ard Error of Measurement for the Grade 5 Science <strong>Test</strong>Pearson/MSDE Confidential 20
2007-2008 MSA Science Annual Technical ManualSimilar to grade 5, IRT item parameter estimates were used to generate characteristic curves(TCCs), test information functions (TIFs), <strong>and</strong> conditional st<strong>and</strong>ard errors of measure (CSEM)were computed for each of the base form, form-to-form linking items <strong>and</strong> entire item pool forgrade 8. Figure 4 shows the overlaid TCC plots for Form A, B, linking item set <strong>and</strong> the entireitem pool. The TCC <strong>and</strong> TIF values were divided by the total number of score points for eachform so that the curves can be plotted on the same scale. Figure 5 displays test informationcurves for Form A, B, linking item set <strong>and</strong> the entire item pool. Figure 6 illustrates theconditional st<strong>and</strong>ard error of measurements for the four tests.Figure 4. <strong>Test</strong> Characteristic Curve of the Grade 8 Science <strong>Test</strong>Pearson/MSDE Confidential 21
2007-2008 MSA Science Annual Technical ManualFigure 5. <strong>Test</strong> Information Function of the Grade 8 Science <strong>Test</strong>Pearson/MSDE Confidential 22
2007-2008 MSA Science Annual Technical ManualFigure 6. Conditional St<strong>and</strong>ard Error of Measurement for Grade 8 Science <strong>Test</strong>Defining Scale RangesIn order to facilitate the use <strong>and</strong> interpretation of the results of the 2008 MSA Scienceoperational administration, scale scores were created through the application of scaling constantsdeveloped following the 2007 test administration. Scale scores were computed using thefollowing simple linear transformation equation:SS = M1(θ ) + M 2where, M1 is a multiplicative term, M2 is an additive term, <strong>and</strong> θ is an IRT based measure ofstudent ability. These scaling constants (M1 <strong>and</strong> M2) were developed to meet MSDErequirements that the mean <strong>and</strong> st<strong>and</strong>ard deviation (sd) be set at mean = 400 <strong>and</strong> sd = 40 on thescale score, while maintaining the LOSS at 240 <strong>and</strong> the HOSS at 650 as closely as possible forgrades 5 <strong>and</strong> 8. The LOSS <strong>and</strong> HOSS set the minimum <strong>and</strong> maximum values that are possibleon the MSA Science test. These scaling constants as well as the LOSS <strong>and</strong> HOSS for each gradeappear in Table 8.Table 8. Target LOSS, HOSS, <strong>and</strong> scaling constants for grades 5 <strong>and</strong> 8.Grade LOSS HOSS M1 M25 240 650 42.3077 400.16888 240 650 42.617 398.9311Pearson/MSDE Confidential 23
2007-2008 MSA Science Annual Technical ManualIn Maryl<strong>and</strong> Science Assessment, student scale score was derived by item pattern scoringmethod based on maximum likelihood estimation. While maximum likelihood estimates wereavailable for students with extreme scores other than zero or perfect, occasionally these estimateshave very large conditional SEM (CSEM), <strong>and</strong> differences between these extreme values havelittle meaning. The ability estimates based on a relative small number of items as is the case forsubscales tend to be unstable which can lead to a large CSEM. The CSEM for the extreme abilityestimate therefore was truncated in consideration of the current MSA Science scale score range.The range helped us to maintain the student scores within the reasonable range while allowing usto have an underst<strong>and</strong>ing that a scale score of 240 is the lowest possible score a student can geton the test. As such, the range of CSEM should be maintained within a reasonable range.Pearson proposed that a maximum SEM be set to be 160. The maximum SEM value is proposedbased on multiple considerations.- Relative magnitude of SEM to the scale score range.Given the current scale score ranges from 240 to 650 which includes 410 points <strong>and</strong> theSEM is recommended not to exceed 40% of the scale score range. The SEM is an indexto represent the measurement precision <strong>and</strong> the range in which the true student abilityexists. A large SEM can lead to an interpretation that a student true ability can be eithertop or bottom of the scale. By curtailing the SEM to a reasonable value, we can provide abetter estimate on where the student’s true ability exists.- Existing practice on other Maryl<strong>and</strong> assessments.According to the 2004 Maryl<strong>and</strong> High School Assessment Technical Report, the SEM forLOSS <strong>and</strong> HOSS is set in consideration of the minimum SEM for the scale score. Aninternal <strong>and</strong> preliminary analysis on the Maryl<strong>and</strong> Science SEM indicates that theminimum SEM for the scale score might be approximately 10 or 11 for grades 5 <strong>and</strong> 8.Based on aforementioned considerations, the maximum CSEM was set to be 160. Upon the stateapproval of the recommendation, the truncation rule was implemented to report CSEM both forthe overall score <strong>and</strong> the subscale scores.ISE Pattern <strong>Scoring</strong>In the spring 2008 administration of the MSA Science tests for grade 5 <strong>and</strong> 8, Pearson used aninternally developed software program called IRT Score Estimation (ISE) program (Chien, Hsu,& Shin, 2007). The program has been extensively tested <strong>and</strong> compared to commerciallyavailable software programs (e.g., MULTILOG, PARSCALE; Tong, Um, Turhan, Parker, Shin,Chien, & Hsu, 2007). The report concluded that with normal cases the ISE program was able toreplicate MULTILOG <strong>and</strong> PARSCALE theta estimates. However, “in problem cases, such asmonotonically decreasing likelihood functions, in which MULTILOG <strong>and</strong> PARSCALE bothproduced theta estimates, ISE was able to produce the estimates that yielded the largestlikelihood function, in alignment with the definition of the maximum likelihood algorithm” (p.9). In addition, “with problem cases in which MULTILOG <strong>and</strong> PARSCALE failed to producetheta estimates, ISE was able to produce an estimate that yielded the largest likelihood from thelikelihood function of a given response pattern” (p. 9). With regard to the CSEMs, ISE producedsimilar results to MULTILOG. More information about the ISE program can be found in the usermanual, technical manual <strong>and</strong> evaluation report <strong>and</strong> are available upon request.The 2008 operational scores were estimated by the pattern scoring approach. The 2008operational item parameters were first equated to the base theta scale established in 2007. ThePearson/MSDE Confidential 24
2007-2008 MSA Science Annual Technical Manualequated item parameters were then used to estimate student ability (theta) using Pearson’s ISEprogram. The theta estimates were transformed onto the MSA Science operational scale usingthe transformation constants described above.Pearson/MSDE Confidential 25